Recent Posts
-
Lucky us, The UN deigns to not list the Great Barrier Reef as ‘in danger’ (yet again)
-
Wednesday
-
Blackouts and maintenance problems hit farmers forced onto solar and batteries in Western Australia
-
Tuesday
-
Monday
-
Sunday
-
One Nation are now the Party of the workers, and Labor the party of wealth and academics
-
Saturday
-
Net Zero anyone? USA bets big on coal and gas — overtakes China in spending.
-
Friday
-
Winning: Trump persuades The World Bank to drop its huge spending target on “climate”
-
Thursday
-
Bafflement?! Germany, a global leader in renewables but has one of the highest EU electricity prices
-
Wednesday
-
Horse-drawn carriages must have caused a Megadrought in Europe in 1540, right?
-
Tuesday
-
Monday
-
Sunday
-
UK facing devastating 36 degree heat — can’t decide whether to use air conditioners or rip them out
-
Saturday
-
Batteries failed on day One: A four day wind drought in South Australia wreaks havoc, high prices
-
Friday
-
The UN wants to be One World Government and it starts with a carbon tax on ships and planes
-
Thursday
-
What if Global Warming was just because something made the clouds go away…
-
Wednesday
-
Snowy 2.0 is the Trillion dollar Black Hole of Australia — sucking in energy, money, land, industrial relations, the dollar, our lifestyle
-
Tuesday
-
Monday
-
Winter Solstice
-
Saturday
-
We were throwing-renewable-energy away at record levels in 2025
-
Friday
-
Pauline Hanson, the centrist, just wants a free market in electricity, and an end to the renewable energy bribery
-
Thursday
-
Blame the Climate Yeti again for making your life more expensive! (It’s a smokescreen)
-
Wednesday
-
The Sunrise Project funneled $343 million from overseas to push net zero
-
Tuesday
-
Monday
-
Sunday
-
The US government has been secretly funding 120 dangerous biolabs around the world
-
Saturday
-
New report shows renewables are a drag on our national productivity
-
Friday
-
Thursday
-
Well, how convenient. AI data centers have arrived to be the fall guy for the Energy Minister
-
Wednesday
-
Billionaires are leaving the room with excuses — Bezos says “AI will solve climate crisis”
-
Tuesday
-
Monday
-
Sunday
|
Kudos to John O’Sullivan for finding this story; see the note at the end about the extraordinary response his post on this received.
———————————-
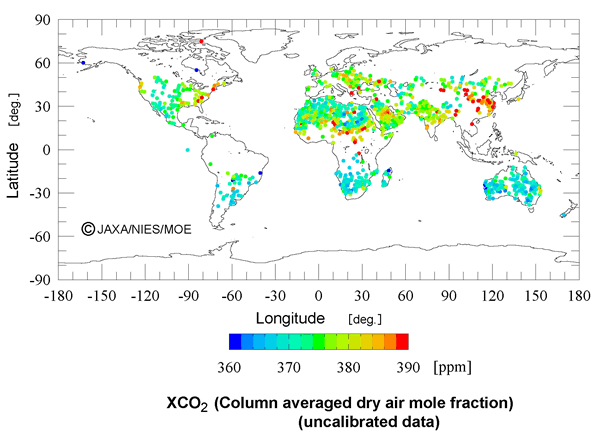
Who are the world’s worst “polluters”? According to a new high-spectral-resolution Japanese satellite — it’s developing countries.
Who knew detailed spectroscopic data on Earth’s atmosphere was available to figure out where the CO2 and other greenhouse gases are being produced and absorbed?
In January 2009, a Japanese group launched a satellite “IBUKI” to monitor CO2 and methane spectral bands around the world to establish exactly where the world’s biggest sources and sinks of greenhouse gases were. With climate change being the perilous threat to millions, this data would seem so essential you might wonder why didn’t someone do it before. As it happens, NASA tried — it launched the Orbiting Carbon Observatory in Feb 2009, which was designed to do exactly the same thing, but it crashed on launch. Oddly, NASA don’t seem to be prioritizing the deadly climate threat, as it will take NASA four years to figure out why the Taurus XL rocket failed and relaunch it.
The results from from Japan’s Aerospace Exploration Agency (JAXA) show that Industrialized nations appear to be absorbing the carbon dioxide emissions from the Third World. (Can we get carbon credits for that?) The satellite shows that levels of CO2 are typically lower in developed countries than in air over developing countries.
 CO2 sources and sinks, recorded by satellite. (Red dots indicate higher levels of CO2, Blue dots mean CO2 levels are lower than average). Official figure caption: Carbon dioxide column averaged dry air mole fractions (XCO2) for clear-sky scenes analyzed using observations at shortwave infrared bands (radiance spectrum uncalibrated data) from the IBUKI greenhouse gas observation sensor (TANSO-FTS). Clear-sky scenes at individual TANSO-FTS observation points are determined using measurements from the cloud/aerosol sensor (TANSO-CAI). Data are excluded where the associated radiance spectra are saturated, and where noise is relatively large due to weak ground surface reflection.
If the evil modern polluters were producing more CO2 (and it mattered to the global flux), then we’d see higher levels of CO2 (more red dots) over the first world. Right? But CO2 levels are lower than average (see the blue dots). The highest emissions, at least on this graph are predominantly in China, and central Africa.)
Australia, New Zealand, South Africa and the US midwest earn Gold Star environment awards for their low carbon dioxide levels.
Keep reading →
9.2 out of 10 based on 112 ratings
Another notch on the winners tally board. It’s a mark of the times that one of the most popular, well known and respected science commentators is willing to to put his reputation and effort into laying out such controversial science publicly, pulling no punches and in a potentially hostile environment. Compare this to the obituaries of “global warming” from believers.
Matt Ridley, author of The Rational Optimist, spoke at an event by the RSA* in Edinburgh. Emails are coming in — it has hit a nerve — and it’s insightful to watch Matt stand in enemy territory, carefully finding common ground with the real scientists in the audience, the seekers of truth, before he launches his attack on the consensus position. According to Bishop Hill (aka Andrew Montford) the speech was well received.
I’ve selected key paragraphs, though ended up with a 2,400 word version. The full 4,000 word version is on Bishop Hill.
David* and I were fortunate enough to have a private lunch with Matt Ridley on his Australian tour, and it was a delight. Days like that are one of rewards for the hours of work unpaid. I usually don’t mention these kind of events — name-dropping is fun — but in this loaded underworld, opponents of the establishment are demonized so it’s usually a disadvantage to the other parties, and I keep a low profile. Such are the medieval rites and rules about being a heretic in our modern era.
At the time Matt expressed some concern about what happens to writers who speak about their skepticism, and I thought it wiser not to publicly mention that he had “consorted” with the despised deniers such as David and myself. Perhaps he was checking that climate skepticism made sense, perhaps that it’s advocates were sane, rational, and presentable in polite company. Anyway, it now appears that there can be no doubt about his position on the topic.
What makes this so worth reading is how well crafted his sequence of reasoning is, and how much research he has done to put this together. In unsensational considered tones, he explains what science is, and how the ever-present temptation of confirmation bias can easily convert scientists to the path of pseudoscience. It’s packed with wisdom, which is why, I guess, I started off meaning to select a few key quotes, and ended up with 60% of his speech (apologies if I haven’t always done justice to the flow).
Jo
—————————————————————————————
My topic today is scientific heresy
Matt Ridley
 Alchemy by James Gillray I have a soft spot for heresy. One of my ancestral relations, Nicholas Ridley* the Oxford martyr, was burned at the stake for heresy. When are scientific heretics right and when are they mad? How do you tell the difference between science and pseudoscience?
Astronomy is a science; astrology is a pseudoscience.
Evolution is science; creationism is pseudoscience.
Chemistry is science; alchemy was pseudoscience.
…
Now comes one that gave me an epiphany. Crop circles*.
Keep reading →
9.1 out of 10 based on 89 ratings
BREAKING: Steven McIntyre reports that “649 Berkeley stations lack information on latitude and longitude, including 145 BOGUS stations. 453 stations lack not only latitude and longitude, but even a name. Many such stations are located in the country “[Missing]“, but a large fraction are located in “United States”. Steve says: “I’m pondering how one goes about calculating spatial autocorrelation between two BOGUS stations with unknown locations.”
——————————————————–
The BEST media hit continues to pump-PR around the world. The Australian repeats the old-fake-news “Climate sceptic Muller won over by warming”. This o-so-manufactured media blitz shows how desperate and shameless the pro-scare team is in their sliding descent. There are no scientists switching from skeptical to alarmist, though thousands are switching the other way.
The sad fact that so many news publications fell for the fakery, without doing a ten minute google, says something about the quality of our news. How is it headline material when someone who was never a skeptic pretends to be “converted” by a result that told us something we all knew anyway (o-look the world is warming)?
The five points every skeptic needs to know about the BEST saga:
1. Muller was never a skeptic
Here he is in 2003:
“carbon dioxide from burning of fossil fuels will prove to be the greatest pollutant of human history.” [kudos to Ethicalarms]
And with Grist in 2008:
“The bottom line is that there is a consensus and the president needs to know what the IPCC says”.
2. BEST broke basic text-book rules of statistics
They statistically analyzed smoothed time series! Douglass Keenan quotes the guru’s “you never, ever, for no reason, under no threat, SMOOTH the series! ” (because smoothing injects noise into the data). BEST did, thus invalidating their results.
3. The BEST results are very “adjusted” and not the same as the original thermometer readings
Think hard about what we might have discovered in the 2000’s that meant thermometers in the 1970’s (but not the 1900’s) were accidentally recording “low temperatures”. How likely is it that raw thermometer readings all over the world, with a simple 300 year old technology, needed to be globally cooled or warmed a year at a time, and they seemed to be “out” for decades?
The BEST team deny thousands of lying thermometers, news articles, reports of snowfalls and frosts in the 1970’s. Is reality better reflected in historical archives of news reports, and original readings, or through adjustments and reanalysis 40 years later? Hmmm.
4. Obviously hot air doesn’t rise off concrete
BEST tells us that the Urban Heat Island effect is minor, and misplaced thermometers don’t make any difference to the run. Thus with statistics we can show that hot air does not rise off concrete, that brick walls do not store and emit heat at night, that airport tarmacs don’t make any difference to the temperature trends of the air nearby. BEST say that the trends are accurate. We agree completely. We accept continuous trend data from all the thermometers that were sited in airports back in 1850. 😉
We don’t need complex statistical rebuttals to put BEST back in it’s box. All we need to do is point at photos and say that BEST shows that these two thermometers are recording accurate trends compared to 150 years ago.
Remember, we’re looking for evidence of a 0.7 degree rise, over a hundred years with thermometers similar to this. Repeat after me, these are good thermometers, they’re in the right place, we know that, because the BEST project says so:
 1 Just another open level clearing with 30m clearance from sources of artificial heat. Right? (Photo courtesy of Anthony Watts, www.surfacestations.org and Don Kostuch. )
Keep reading →
9.3 out of 10 based on 77 ratings
A former chief economist of the International Monetary Fund, wrote in May 2009 about how depressingly similar the US problems are to emerging economies he has worked with. It’s a provocative article: The Quiet Coup (a few excerpts posted here).
“Anything that is too big to fail is too big to exist.”
The Quiet Coup
The problem is oligarchs who overborrow, become too powerful, and gain too much influence:
 |
Click the chart above for a larger view
|
“Wall Street ran with these opportunities [lightweight regulation, cheap money, securitization, interest rate swaps, and I would add, high frequency trading]. From 1973 to 1985, the financial sector never earned more than 16 percent of domestic corporate profits. In 1986, that figure reached 19 percent. In the 1990s, it oscillated between 21 percent and 30 percent, higher than it had ever been in the postwar period. This decade, it reached 41 percent. Pay rose just as dramatically. From 1948 to 1982, average compensation in the financial sector ranged between 99 percent and 108 percent of the average for all domestic private industries. From 1983, it shot upward, reaching 181 percent in 2007.
“The great wealth that the financial sector created and concentrated gave bankers enormous political weight—a weight not seen in the U.S. since the era of J.P. Morgan (the man)… in the banking panic of 1907…
The USA might be the most powerful economy on the planet, but the pattern is similar:
“...inevitably, emerging-market oligarchs get carried away; they waste money and build massive business empires on a mountain of debt.
“The downward spiral that follows is remarkably steep. Enormous companies teeter on the brink of default, and the local banks that have lent to them collapse. Yesterday’s “public-private partnerships” are relabeled “crony capitalism.” With credit unavailable, economic paralysis ensues, and conditions just get worse and worse. The government is forced to draw down its foreign-currency reserves to pay for imports, service debt, and cover private losses. But these reserves will eventually run out. If the country cannot right itself before that happens, it will default on its sovereign debt and become an economic pariah. The government, in its race to stop the bleeding, will typically need to wipe out some of the national champions—now hemorrhaging cash—and usually restructure a banking system that’s gone badly out of balance. It will, in other words, need to squeeze at least some of its oligarchs.
“Squeezing the oligarchs, though, is seldom the strategy of choice among emerging-market governments. Quite the contrary: at the outset of the crisis, the oligarchs are usually among the first to get extra help from the government…
“to IMF officials, all of these crises looked depressingly similar”
The thing that matters to the IMF — the most important point — is whether the government is willing to cut the oligarchs loose:
Keep reading →
8.9 out of 10 based on 43 ratings
Lucky the BEST* project is here to save us from the lying thermometers of the past. Apparently people in the 1960’s and 1970’s were clever enough to get man on the moon, but too stupid to measure the temperature. Millions of people were fooled into thinking the world was cooling for three decades by erroneous thermometer readings. Who would have guessed?
Back then, everyone was sure that the 1970’s was a lot colder than the 1940’s, as Steven Goddard reminds us:
 Newsweek April 1975 See the original Newsweek report at Denis Dutton‘s site.
The Global Bermuda-Triangle Effect: Thermometer Weirding
The performance of global thermometers is baffling. The technology is nearly 300 years old. The first thermometers were produced in 1724 by Daniel Fahrenheit, and by 1742 Anders Celsius had invented its main competitor. This simple, reliable instrument spread throughout the world and worked well. So far so good. But from 1920 we see the first signs of worldwide systematic errors (first too high, and then too low?!).
The strange “Wierding” effect struck both mercury and alcohol thermometers and was most savage between 1945 and 1975. Frank Lansner compared the BEST projects result with his Rural Unadjusted Temperature Series (RUTI, below). The Berkley Earth Project (shown here in the dark green line) corrects for the inexplicable Wierding, and now reveals that the rural thermometers worldwide were systematically recording an astonishing half a degree too low! (Frankly, it’s a wonder that planes were able to land at country airports.)
 While rural raw temperatures fell, the BEST “reality” was that really it wasn’t that cold. See the RUTI analysis at Hide the Decline
Scientists and journalists fooled
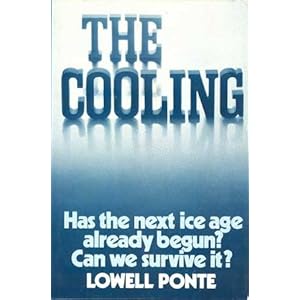 Lowell Ponte, 1976 “Another Ice Age?” asked Time Magazine on June 24, 1975.
It seems that many people were tricked into thinking the world was cooling, and saw the signs of it everywhere they looked.
The mass delusion extended to imagining that growing seasons were shorter and to seeing fictitious extra snowfall in satellite photos. From Newsweek 1975, headlined “The Cooling World”:
In England, farmers have seen their growing season decline by about two weeks since 1950, with a resultant overall loss in grain production estimated at up to 100,000 tons annually.
A survey completed last year by Dr. Murray Mitchell of the National Oceanic and Atmospheric Administration reveals a drop of half a degree in average ground temperatures in the Northern Hemisphere between 1945 and 1968. According to George Kukla of Columbia University, satellite photos indicated a sudden, large increase in Northern Hemisphere snow cover in the winter of 1971-72. And a study released last month by two NOAA scientists notes that the amount of sunshine reaching the ground in the continental U.S. diminished by 1.3% between 1964 and 1972.

Climate Depot has the FACTSHEET on the 1970s ice-age predictions with links to the articles.
Keep reading →
9.2 out of 10 based on 95 ratings
In the UK, gargantuan (as in wow!#$) amounts of cheap energy were discovered a month ago, yet it seemingly hasn’t changed the political landscape. (Or, then again, maybe it did? I gather no one in the UK government seems to be admitting it, but from afar, it looks like a lot of clunker UK policies have not-coincidentally got the boot in the last month.) Overtly, it’s been the gift no one wanted to open… but possibly a few in power are well aware of what’s under wraps and it is influencing policies?
Back in August 2011, the experts at the The British Geological Survey team thought the country only had 150bn cubic meters of shale gas. Then on Sept 22 a group called Cuadrilla announced that they’d found the odd 5,660 bn cubic metres under Lancashire.
Right about then, a sea-change ought to have come over ministers and corporate leaders in the UK. Here was a get out of jail free card, with lots of cash-cow potential, not to mention 50+ years of gas for the whole nation. It ought to have been time for large parties, champers, and the dumping of the competing energy sources. Instead a month later, news articles are talking about the fact that no one is talking about it. (Meanwhile I hear people in a modern nation are dying of cold because they can’t afford electricity or gas. It’s not like this is important…)
The worldwide, big picture: the 1700’s were fueled by wood, the 1800’s were the age of coal, the 1900’s were all about oil, and it looks like the 2000’s will be powered by shale gas. Yes it’s that big.
Phillip Johnson at the Telegraph explains that everyone is cold, electricity is a rip off, shale gas could rescue everything but no one seems to want to talk about it…
Keep reading →
9.1 out of 10 based on 82 ratings
I need to do some testing, so odd things may come or go… but hopefully it will all be working properly soon. 🙂
Thanks for your patience, but do keep commenting!
Jo
PS: New star ratings added for blog articles. Thanks for your enthusiastic clicking, but seriously, surely I need to do more than write two lines to earn eight stars!
8.9 out of 10 based on 29 ratings
We want evidence, reason, and well informed opinions from all sides on important topics. Instead we’re coerced into paying for propaganda, character assassination, and the personal views of journalists.
The ABC has been outdoing itself lately. It doesn’t just ignore skeptics, it’s been actively working to denigrate them. No ad hom is too low, no fabrication too far fetched. Could it be complete fiction? Why not? Could it be the most expensive high profile ABC programs, costing tax-payers hundreds of thousands an episode? Yes sir.
It’s not a conspiracy, it’s a culture. When comedians and scriptwriters live off a diet of dogma at the ABC (it starts with the science unit), why would we be surprised that they’d churn out the same half-truths, deceit, and sloppy reasoning in their fictional work?
The ABC Chairman — Maurice Newman — recently worried about the poor intellectual quality of ABC “investigations” in The Australian, “Ad hominem attacks substitute for logical and evidence-based discourse that would otherwise allow viewers and listeners the opportunity to decide for themselves where they stand on the issues.”
Our billion-dollar ABC is supposed to represent the diverse views of the country:
The ABC editorial policy tells us the ABC must: “4.2 Present a diversity of perspectives so that, over time, no significant strand of thought or belief within the community is knowingly excluded or disproportionately represented.” [Thanks Bob Fernley-Jones]
The diversity of opinion is clear: the latest polls show 34% of Australians are in favor of a Carbon Tax and 57% are against.
So how do the ABC represent the voices of 57% of the people?
- A/ ignore them,
- B/ denigrate them, or
- C/ both of the above (see, e.g. “Anthony Watts”).
The lengths the ABC will go to, to destroy reputations of those they personally disagree with are considerable
I’ve already described how Wendy Carlisle called herself a “science journalist”, yet ignored Australia’s leading carbon modeler as he explained problems with climate models (twice, at length, with slides). Instead of asking Evans a single question when he was in the same room after the talks, Carlisle thought it was worth making international phone calls to people tenuously and distantly connected to the Monckton tour in order to talk about what their department was called in 1985.
The agit-prop is not just talk shows, it now extends to “comedy” and fictional dramas.
Crownies tries to defame Anthony Watts
 Fictional character: James Watt Two weeks ago, a legal drama —Crownies — put a lawyer-character in a devilish quandry. The poor dear — fresh from being drilled in Climate Alarm 101 at school — was forced to defend a “denier” who’d been punched by the lawyer’s hero — a frustrated alarmist scientist. The ‘persistent climate denialist’ was a blogger called “James Watt” who ran a site called “CO2fraud”, a thinly veiled attempt to denigrate Anthony Watts who runs the skeptical website Watts Up With That(easily the most popular climate site in the world). At the end of the case, Watt looks like a loser nerd who deserved to be punched. The climate scientist reckoned he might do it again “for $1000, it might just be worth it.” As per usual the script writers attack strawmen and produce a caricature of errors.
(Note to Crownies writers: hundreds of studies show the MWP was not just “local”, no major skeptic says GHG’s break laws of thermodynamics, the hot spot wasn’t found, alarmists still can’t name any empirical evidence, and if a glacier melts that doesn’t mean fossil fuels caused it. Any cause of warming will melt ice, raise sea levels, change growing seasons, you know.).
To see Episode 13: Try this link, or this one or possibly The ABC’s iView facility* (Parts of interest at 5.30, 15.30, 27.30, 30.30 and 38 mins.)
The ABC doesn’t even try to hide that the point was to make Watts look like an idiot — it’s written into their episode description:
Richard is prosecuting a case in court, this time with a good chance of winning. But he is not happy. He has to prosecute his climate scientist hero Tim Coghburn for assault, after Coghburn punched a persistent climate denialist, James Watt. Watt is an annoying gadfly and Richard detests all he stands for. And the fiasco is made worse when Richard sees Coghburn is being represented by Richard’s old, much admired law lecturer. Richard makes a stuttering start in court, and the defence QC makes Watt look unreliable and a bit of a goose. Part of Richard wants to lose because of his environmental concerns, but part of him needs a win. Richard finally cross examines Tim Coghburn and gets to reconcile his needs. He leads Tim through a series of questions as put by James Watt and his ilk, stirring Coghburn’s anger as he airs the simple rebuttals. Eventually Tim blurts out that yes, he did hit James Watt, and it felt great. Richard has his win, Tim is fined, and Watt still comes out of it looking like an idiot.
A Hamster tries satire on Monckton. If only it were funny…
While we toured with Christopher Monckton in Sydney in July, he mentioned that an ABC related team had interviewed him for 45 minutes, and then it all turned out to be a gotcha pretending he was Sacha Baron Cohen.
Now, What-Ho, three months later, they’ve finally scraped it into a 4 minute comedy sketch. The central idea was a good one — the riotous notion that Monckton was Cohen all along and has tricked everyone from the US Congress to media outlets everywhere. It could’ve been good — if only the actors could act. None of them can deliver their lines in any half-way convincing style. Watch Shaun Micallef self-consciously fake a laugh, see someone called Tony Martin overact his scripted lines, and laugh at the big Gotcha Moment flop as Monckton doesn’t bite and politely tells them they ought take their equipment and go.
As is usual with religious zealots, they just can’t carry off a joke. The best and funniest comedians know their topic well. But the Chaser crew don’t know Monckton well enough to realize that he has Graves Disease, and Martin’s comment that Monckton looks so “ridiculous” chokes on its own poor taste. This is cheap-trick propaganda, except it isn’t cheap. (The 8 shows cost $3.2 million dollars and the Chaser boys are getting $1.2 million of taxpayer money themselves.)
[I predict that Hamster, like Crownies, will bomb. Who wants to watch predictable shows tell them what to think and who to sneer at.]
The weak scientific culture of the ABC starts with the science unit
Bob Fernley-Jones documents just how unscientific Robyn Willliams “science” program has become.
Williams personal views on topics like “climate science” dominate his show. He reviews sympathetic smear books that personally attack scientists, but he won’t interview authors of science books who hold different opinions to his own (e.g. Professor Bob Carter, who wrote Climate: The Counter Consensus). Nor will Williams interview well-informed critics like William Kininmonth (Climate Change: A Natural Hazard), Dr David Evans, or Prof Garth Paltridge (The Climate Caper). And this despite global warming being rather near the top of the national agenda.
Keep reading →
8.9 out of 10 based on 81 ratings
Good news: signs are coming in from all over the non-Australian-and-New-Zealand world. Hints of sanity are spreading. Everywhere Green schemes are being slashed, junked and rethought.
I’m heartened. There are reasons to be optimistic, (even if, in the end, the good news was not because politicians got rational, but because the money ran out).
For those that missed it, Delingpole reported the beginning of the October good-news shift with ‘Let’s commit suicide more slowly,’ suggests Osborne.
George Osborne has vowed that the UK will not lead the rest of Europe in its efforts to cut carbon emissions, raising the prospect that the country’s carbon targets could be watered down if the EU does not agree to more ambitious emission reduction goals.
EU referendum reports on the collapse of the UK’s largest Carbon Capture Scheme and what it means for the Green Agenda
It has come to pass that Longannet, the flagship scheme for carbon capture in the UK, has been junked, despite the availability of £1 billion funding from this moronic administration. And since it is the only remaining project in the running for CCS funding, that makes it about thirty months from inception to total collapse of this absurd policy. God only knows how much money has been wasted on it.
The Spanish announced they’re cutting wind power subsidies by 40%: Spanish Wind Energy Companies Distressed By Subsidy Cuts. The Times reports that the UK government was thinking of cutting it’s wind subsidies too. “In addition, Britain’s target of producing 30 per cent of its electricity from renewable means by 2030 could be in jeopardy.”
Keep reading →
9.3 out of 10 based on 92 ratings
I thought the Canadians had gotten over this type of insanity. Environment Canada apparently wants to cut the coal industry in half. (At least that’s as much as they’ll admit too. Presumably they’d feel like they’d completed their life’s work if they could only wipe it out completely.)
Christopher Monckton has analyzed the Canadian regulatory action on “Coal Emissions” and finds that, as usual, legislators are choosing the most expensive option possible with other people’s money. Environment Canada wants to spend $6 billion to reduce the atmospheric concentration of a trace molecule by 0.01 ppmv, and assuming there is any advantage in doing so, it would still cost one-eighteenth as much to just do nothing, suck it and see, and pay for all the theoretical damage that could ensue.
Like so many other Western Nations, there is not even the pretense that the legislation makes sense judged by any numerical outcome, yet Canadian citizens may have to pay thousands in tithe to witchdoctors and carpetbaggers in a futile attempt to change the weather. It’s as if the highest echelons of Western leadership are stone-age innumerate.
As per usual with these type of posts, I expect no real challenge to Monckton’s figures. Environment Canada are not going to pop up and announce a specific accurate target — not in dollars, ppmv, °C or Watts per metre. The fans of these symbolic feel-good policies will respond with overwhelming silence. I mean, the numbers are so damningly small that even if they found an order of magnitude in a correction (“oh look, now that’s 0.007 °C!”), the policy still doesn’t make any sense.
I used to be reluctant to publish these type of figures, they just seem so incredibly small and too-hard-to-believe. But now we know, it really is that stupid.
If there is any consolation for Canadians, it’s that schadenfreude sense that at least things are more stupid in Australia.
— Jo

Guest Post by Christopher Monckton
Why the regulations would not work
The reasons why abandonment of the regulations is recommended. At the minimum market discount rate of 5%, it would be almost 18 times costlier to implement the regulations than it is to meet the cost of climate-related damage that may arise from taking no action to control CO2 emissions at all.
Keep reading →
8.4 out of 10 based on 44 ratings
If you are in Sydney, I recommend dropping in to meet David Archibald and hear him speak!
6.30pm, Club Five Dock, 66 Great North Road, Five Dock
Details below… Jim Simpson runs a model group of skeptics 🙂
Keep reading →
9.2 out of 10 based on 11 ratings
La Nina is here. But how big will it get?
The NCEP NOAA forecasts suggest it might be so big, it’s historic — stronger and colder than anything since possibly 1917. (Then again, the Australian BOM are saying it’ll be a bit weaker than the last one.) But as Frank Lansner points out, the NCEP model got it right last year when many others were not even close.
Lansner has spotted the uber cold forecasts of NCEP. By March next year their models are telling them the Pacific Ocean (section Nino 3.4) will be 2.5 degrees below average. The forecasts are so unusually cold, some of the model runs don’t even fit on the graph. (Warmistas must be quaking at the thought of a blockbuster cold northern winter. Bring out your “warming causes cooling” memos.)

If conditions do reach 2.6 degrees below average, that would make the ocean surface temperatures in that zone, colder than anytime in the last 60 years. It would be the La Nina to almost match the strength of the 1998 El Nino anomaly (2.8K) that set records all over the world.
Keep reading →
7.9 out of 10 based on 18 ratings
Pickering has it in a picture 🙂
Let’s applaud the brilliant Larry Pickering.
It says a lot about the state of our nation, that after retiring 30 years ago, the esteemed cartoonist felt the inescapable urge to come back now.
The Australian government and the Big Climate Scare are both achieving once-in-a-generation status. They are both ideas so preposterously absurd, they are Fertilizer for Funnies.

When a government is so bad, that it brings long retired cartoonists out of retirement, you know this era is the end-game stage of a historic low.
Cartoons like this are exactly why the Big Scare Campaign is scared to death of free speech.
Pickering uses comedic exaggeration to the full, but people don’t need to take this literally. It cuts through. This captures a dangerous idea. What if the government was milking the scientific system? Imagine if they treated some scientists different (what, you mean like calling them names?).
Gillard may control the Army but we skeptics have the best cartoonists. It’s no match. The Tax is temporary.
Keep reading →
9.4 out of 10 based on 36 ratings
Have you wondered what the global raw rural data tells us?
What did those thermometers say before the adjustments, smoothing, selection, and averaging?
This just might be the first time anyone has publicly compared the global raw data to published adjusted data sets in this way.
Frank Lansner has been dedicated in the extreme, and has developed a comprehensive Rural Unadjusted Temperature Index, or RUTI. One of the most interesting points to come out of this extensive work is the striking difference between coastal stations and inland stations. Frank kept noticing that the trend of the inland stations was markedly different from coastal stations and island stations.
 Fig1. Red-Blue lines mark regions where there was a different coastal to inland trend. In green areas the two trends were similar. What he finds is perhaps not so unusual: The coastal areas are heavily influenced by the sea surface temperature. Inland stations record larger rises and falls in temperature, which is hardly surprising. But, the implications are potentially large. When records from some stations are smoothed over vast distances (as in 1200 km smoothing), results can be heavily skewed by allowing coastal trends to be smoothed across inland areas. What Lansner finds is that coastal trends can be smoothed over the oceans, but that there is little justification for smoothing them over land.
Lansner chose the longest records he could find, and checked the sites via Google mapping to avoid the UHI (Urban Heat Island Effect) as best he could. This will always be a challenge. But, the stand-out message from all over the world is in some ways also the bleeding, but unspoken, obvious: Our land masses heat up and cool down faster than the deep expanse of the oceans.
The coastal slice of the world is thin, so it’s small in terms of its land area, yet its influence over the “Global Land Averages” may be far larger than it ought.
Tree ring divergence explained?
Tantalizingly, Lansner also seems able to explain the mysterious post 1960 temperature “decline” in tree rings that was famously hidden from global graphs. Mann et al removed the tree ring record after 1960, saying it didn’t match thermometer recordings, but since most trees grow inland, rather than on coasts (or in the ocean), the trees turned out to be matching the inland trends, not the sea-surface trend. Global inland temperatures were cooling fast by 1960, and the temperatures implied by the tree rings followed the inland raw data.
Yes, there are all the usual caveats: This is one man’s, non-peer reviewed work; it hasn’t been replicated, and some adjustments help us to get a better result, so an unadjusted series has it’s own problems. But, I’m posting the key parts here for discussion, and you will have to visit Frank’s site to appreciate the phenomenal amount of work that has gone into this.
The strange thing is that this kind of detailed research is being done by an unpaid scientist working from home. Lansner feels the coastal versus non-coastal trend is so obvious that many scientists must be aware of it, yet don’t seem to have published on it, and don’t appear to criticize publications that combine the different trends in ways that don’t reflect their relative surface area of the globe.
Keep reading →
9.4 out of 10 based on 19 ratings
Bountiful Joy! The Australian Labor Party have discovered the endless free lunch, and they’re going to feed the Nation!
All this time we’ve been wondering how to make the pie bigger, save the world, and live to be 105, and the answer was staring us in the face!
The Diabolical Choice

Box One: Cheap Electricity
Box Two: Same electricity — Costs a lot more!
Labor chooses Box 2!
Why? Look at the benefits:
1) For $11 billion dollars a year you get almost as much electricity (except at night time, early morning, late afternoon, and on cloudy, windless or extra windy days.)
2) You are providing a guaranteed market for a product no one in their right mind would buy! (This is the Labor “free market solution”.)
3) You give people “Hope”! Hope that someday, the people profiting from selling you a product that isn’t very good, will pay for the research to figure out how to make it worth buying!
4) Then whoever that smarty pants country is, will sell this back to us, making even more profit because they own the patents. Good for them. (Who said Australia was just a Quarry?)
5) In the end, remember that only the top 500 “polluters” will pay, and wait for it, if they are a business (what corporation isn’t?) according to the Honorable Combet they will not be affected because the tax is cleverly designed to be “competitively neutral” and quote: “it is not expected that companies will have to absorb the costs” (ie, they’ll all hit the consumers for the bill).
6) Even most consumers won’t have to pay! Only things that move, grow, light, or change temperature will cost more, and 90% of people will get more compensation than they pay. The other 10% (i.e. what’s left of the workforce) will cover all the extra costs of the Tax-on-everything. They’ll also earn the money to pay compensation to 90% of the country.
Thus the entire country can vote to live off 10% of the workers (at least ’til they leave the country*). The efficiency!
Pause for a moment to admire the penetrating insight of this master plan. The acute sagacity!
It’s so obviously the path to wealth, it’s a wonder no country thought of it before?
Keep reading →
9.4 out of 10 based on 16 ratings
The End Game of the Great Global Warming Myth draws closer
With impeccable timing the Australian Government is snatching defeat from the jaws of what could have been a glorious victory. Just as Gore, activists and then Hansen admit they lost, the infighting among the big scare campaign begins, the EU pulls the pin on Kyoto, and UK news outlets are asking if a Little Ice Age is on the way…
No one in officialdom is admitting the science has changed, or that they got it wrong, but the world is behaving as though it no longer believes.
What are the odds? Today the Australian Government is voting on the “Clean Energy Bill” (which will henceforth be known as the “Costly Energy Bill”) and at the same time the EU is saying: Enough! The big boys have to play or we are out. Which means the impossible trio of USA, China and India need to sign up to Kyoto II.
They might as well have said: “It’s all over for us. Kyoto II is dead”.
EU sets conditions for signing up to Kyoto II
LUXEMBOURG – European Union environment ministers — responsible for only 11 percent of global carbon emissions — said they would commit to a new phase of the Kyoto climate change pact, on the condition that nations blamed for the rest join up too.
“What’s the point of keeping something alive if you’re alone there? There must be more from the 89 percent,” EU Environment Commissioner Connie Hedegaard told Reuters.
The European Union stated the need for a road map that would indicate when the biggest emitters — led by the United States, China and India — would sign up. The milestones on the way, however, were imprecise.
A first commitment phase of the Kyoto Protocol — the only global, legally-binding contract on tackling climate change — ends at the end of next year and analysts say time has run out to get a new world-wide deal in place before then.
[Source: Reuters]
Five years late to the Party, and yet paying for everyone…
Keep reading →
9.2 out of 10 based on 11 ratings
What’s the worst thing you could call a scientist? Apparently, a “climate change denier” and “a fraud”.

Even scientists who are hunting Yetis are not suspected of being as evil, unscrupulous and deranged as skeptics-of-the-extent-of the-UN-committee’s-projections-of-man-made-global-warming, aka, “climate-change-deniers”. I mean, who would dare question the UN, eh? It is a collective God, it can’t be wrong — like, say, the Pope in 1633. If they say it’s 3 degrees / 2 degrees /3.3 degrees, whatever, they must be right (even if they do keep changing their mind).
Scientists who are hunting Yetis have no credentials, poor sods and are ripe for a whack.
Who are these “international scientists” who are going to find his Yeti for him? We have been given no names, nor credentials, nor institutions they belong to. I suspect, like so many of the so-called climate-change deniers, they are frauds.
But here’s the thing, I know the author, Darren Curnoe (though it’s been a while), and he’s a really nice guy. We shared a group house once, when I was on the way from science to TV, and he was on the way from TV to science. We had avid conversations about the evolution of the human condition, with zeal, and I remember him fondly, and would be more than happy to have yet another red wine.
So it is with more respect than usual that I mention that perhaps Darren ought read other sites than The Conversation to figure out what makes a skeptic tick. He might find that he’s been falsely sold the line by psychologists like Lewandowsky (don’t you miss the Soviet Union, where if you disagreed you must be mad?) that skeptics have no credentials. Instead skeptics can name 1000 eminent scientists, 9,000 PhD’s, and 900 peer reviewed papers just for starters. “Deniers” include guys like the revered Freeman Dyson, who sat on the board of Bulletin of the Atomic Scientists, (a group which Darren was impressed by on another thread). Freeman, with 21 honorary degrees, and countless prizes, was very much a skeptic. (See the link under 1000 eminent scientists to find scores more “denier” professors who must be hiding their cheques from Exxon).
In the end it wouldn’t matter if we were sheep herders, what matters is the evidence. Who makes predictions that observations can verify? Skeptics have (forgive me for repeating it) 28 million weather balloons, 6000 boreholes, 3000 argo buoys, and 500 million years of paleohistory* showing how the alarmists theory exaggerates the threat. Alarmists have models, bank-loads of money, hot PR teams, and no scruples about hiding their data or rigging the graphs.
Who breaks laws of reason, hailing Gods of science? Not skeptics.
Keep reading →
8.9 out of 10 based on 8 ratings
For those commenters who are following the news and proceedings in detail as it travels through the cogs and gates of parliament, please share your thoughts on this thread as it unfolds. Thanks to those who have the time to follow the details.
I’ve moved relevant comments from other threads to here.
7.8 out of 10 based on 4 ratings
The Australian government asks for submissions, gets around 4500, mostly against the tax, then ignores almost all of them. It’s just another form of suppression and censorship, a sign that the elites don’t give a fig what we think.
Menzies House is calling it an utter disgrace.
“In a shocking and historically unprecedented suppression of political expression, a staggering four thousand five hundred Australians have had their voices silenced by Australia’s political elite in the Labor-dominated Joint Select Committee on Australia’s Clean Energy Future Legislation.”
It shows what we all knew all along: the submission process was a merely legal formality, a scent of democracy.
This is a new low, and based on current performance, is just what we’d expect. They can’t justify this tax, they can’t debate the science, but they can ram it through. The only way “forward” is with whitewash, erasers, and the all-purpose delete key.
So figure what was going on in the minds of the chief censors:
a/ Abject desperation: We’re doomed! (Never let the plebs know that we got thousands of well written, detailed submissions that were against the tax, so find any half-baked pathetic excuse to not publish or count most of the letters!)
b/ Callous disregard: The people who wrote this stuff would never vote for Labor anyhow and who, seriously, is going to bust us? (That is, we’re not interested in their views. And anyhow, Fairfax and the ABC won’t even mention that the submissions were canned, so it never happened. Who cares?)
Keep reading →
8.3 out of 10 based on 11 ratings
I‘m peppered with emails asking me if articles like this one (which claims there is no Greenhouse Effect at all on Venus) could be right.
Michael Hammer has some 20 patents in spectroscopy, and he explains why the Greenhouse Effect — where CO2 and other gases absorb and emit infra red — is very real, and backed by empirical evidence. The calculations using the Stefan-Boltzmann Law on the atmosphere of Earth and Venus, argue that the Greenhouse Effect is not-detectable. But not-detectable (by that method) does not “prove” the effect is zero. Other methods — like satellite observations of Earth’s atmosphere, and countless lab experiments, tell us that the Greenhouse Effect is real. (The Stefan-Boltzmann Law is used to create the first graph below). Huffman’s calculations suggest other factors are more important than greenhouse gases (with which we heartily agree) and that Hansen et al were barking up the wrong tree by pretending that Venus “shows” us anything much about the Greenhouse Effect. (Indeed, the IPCC mention “Venus” in their first Assessment Report back in 1990 as one of the three key reasons.)
So here in middle-of-the-road centrist land, the people who claim Earth could become more like Venus are wildly exaggerating, but the people who claim that Venus “proves” that the Greenhouse Effect doesn’t exist are just as wrong.
For your average reader, sorry it is esoteric, but there will be avid interest by some science-aficionados in this topic.
— Jo
Guest Post: Michael Hammer
Joanne sent me an email to ask my opinion on the “Huffman blog”: There is no Greenhouse Effect on Venus.
Let’s start with a plot of the long wave infrared emission from Earth as seen by the Nimbus satellite. This is not model output, it is real experimental data. A plot is shown below:
 Caption from Petty: Fig. 6.6: Example of an actual infrared emission spectrum observed by the Nimbus 4 satellite over a point in the tropical Pacific Ocean. Dashed curves represent blackbody radiances at the indicated temperatures in Kelvin. (IRIS data courtesy of the Goddard EOS Distributed Active Archive Center (DAAC) and instrument team leader Dr. Rudolf A. Hanel.) The horizontal axis shows wavenumbers, which are the reciprocals of wavelengths. The vertical axis shows the energy density of the radiation from the Earth observed by Nimbus. The dotted overlaid traces represent the emission spectrum from black bodies at various temperatures (calculated from Plank’s law which is known with a very high degree of surety). Without any atmosphere, Earth’s emission pattern as seen from space would look like one of these dotted lines.
Note the big bite out of the spectrum at around 660 wavenumbers and the smaller bite at around 1000 wavenumbers. The former is at the CO2 absorption line and the latter at the Ozone (O3) absorption line. Those two bites represent energy that is not being radiated to space that would be if there was no atmosphere. In short it is the signature of a green house gas reducing Earth’s radiation to space at the green house wavelengths. I invite those who disagree to give an alternate explanation for what is causing these notches.
Keep reading →
8.6 out of 10 based on 8 ratings
|
JoNova A science presenter, writer, speaker & former TV host; author of The Skeptic's Handbook (over 200,000 copies distributed & available in 15 languages).

Jo appreciates your support to help her keep doing what she does. This blog is funded by donations. Thanks!


 Follow Jo's Tweets
 To report "lost" comments or defamatory and offensive remarks, email the moderators at: support.jonova AT proton.me
Statistics
The nerds have the numbers on precious metals investments on the ASX
|






Recent Comments