Contents of LinksThe Science of CO2 & temperature Blogs – Detailed discussions of the science Correlation: CO2 & temperature Hockey Stick Graph (See MWP & LIA also) Medieval Warming & Little Ice Age Science (Method and Philosophy) Storms (Cyclones and Hurricanes) |
|
The Science of CO2 and Temperature
Albedo
- Over the whole surface of the Earth, about 30 percent of incoming solar energy is reflected back to space. [NASA]
Benefits of Carbon Dioxide
- Carbon Dioxide Fertilizes plants and increases plant growth Earths Biosphere is Booming. Source link.
- Hundreds of papers show how plant life on Earth loves CO2.
- Doubling CO2 may increase crop yields by 33%. Kimball.
- Trees grow faster. Paper in Nature.
- Farmers use CO2 to increase crop growth here.
- Greening of Planet Earth Video.
- If CO2 caused a little global warming it would be a good thing. Evidence suggests global warming is good for our health
ClimateGate
- IPCC involvement with “hide the decline” [climateaudit]
Clouds
- Spencer and Christie’s research on tropical clouds, summary here, original paper here.
- Spencer’s feedback
- Spencer on the PDO
- High clouds decrease with rising temperature
- Josh Willis reassess Argo Data
- Peilke Sr critics Josh Willis
- Global cloud cover is about 66%, plus many graphs of trends and patterns in cloud cover. (Climate4you)
- ECHO-G cloud cover graphs
- High clouds tend to warm, low clouds cool [NASA]
CO2
- Human emissions are dwarfed by total natural emissions
- DOE Statistics
- EU Emissions fell by 2% in 2011
- CO2 levels at Mauna-Loa Hawaii. Data.
- Half a billion years of CO2 and temperatures. Scotese and Berner GRAPH & Here
- Description of the Holocene Optimum (Uni of Arizona Lecture).
- Carbon rose 3000 years after temperatures in the PETM 50 million years ago. Sluijs et al. 2007
- Half life of CO2. Graph comparing studies.
Greenhouse Gas Theory
- Falsification Of The Atmospheric CO2 Greenhouse Effects Within The Frame Of Physics Link. It quotes the 1909 experiment with the two greenhouses, one normal the other with glass transparent to infra red.
- Hans Schreuder I love my Carbon dioxide the greenhouse gas effect is not just not significant, it is not possible
- Similarly Will Alexanders article takes a broader and more holistic view and seems to be stating similar conclusions about the greenhouse effect’s non-existence.
- Miskolczi’s 2007 paper, see here for commentary.
- Michael Hammers discussion of radiative energy budget on Jennifer Marohasy’s site is here. He suggests that the amount of feedback attributed to water vapor in the models is impossible and explains why using at least two different methods.
- The Log Graph of carbon dioxide absorption on p 8 of The Skeptics Handbook comes from David Archibald: The Past and Future of Climate (Pdf).
- The history of scientific papers AGWObserver. Arrhenius 1896, Gebhart 1966.
- The IPCC and NASA both admit they don’t understand water vapor: NASA 1997
Missing hot spot (due to lack of feedback – see also feedback)
- My summary, and response to claims that ‘it’s been found”.
- Signatures of different causes of warming see page 25. CCSP report 2006.
- Radiosonde recorded temperatures in atmospheric temperatures for 1979 – 1999. US CSSP published the graphic summary in part E of Figure 5.7 on page 116 in 2006
- A variation of the signatures of different causes of warming are also graphed in IPCC Assessment Report 4, 2007, Chapter 9, Figure 9.1, page 675
- Dr David Evans has summarized the explanation and evidence here for the Missing Greenhouse Signature.
- SPPI reports on the missing signature Greenhouse Warming? What Greenhouse Warming? August 2007. Christopher Monckton. (16 page pdf file).
- Fallacies about Global warming John McLean SPPI (8 page pdf). This covers the historic methods of recording temperatures, the meaning of peer reviewed papers, measuring global temperatures, the ‘consensus’, whether trends in temperature means anything and the accuracy of climate models. Its especially strong discussing the nature of the IPCC and it’s ‘scientific’ standing, or not.
- Statistics of radiosonde errors: Debate at climate audit and the opposite view at real climate.
- Santer’s 2008 paper and some discussion.
- Allen and Sherwood’s paper, and some commentary. There’s another Sherwood paper from 2008 that people quote but which didn’t find the hot-spot, the official AMS entry and the RC commentary. Sherwood’s UNSW site. The AMS paper from 2007 where Allen and Sherwood suggest wind-shear is a good way to analyze temperatures.
- All of my posts on the topic.
- Assorted Papers: Sneider, Kurtman, Lindzen 1999 [PDF], Slingo 1999 [PDF], Held and Soden 2000 [PDF], Lindberg 2002 [PDF], Bony 2003 [PDF], Douglass 2007 [PDF]
Ice cores
- Ice Core CO2 data: Carbon Dioxide Information Analysis Center, CDIAC
- Callion’s 2003 paper detailing the 800 year lag for the first time.
- Lorius on Climate Sensitivity in ice cores in 1990 Review.
- See Palisad for the most informative detailed graphics on what the Vostok and Dome Ice cores mean and why they strongly mathematically suggest CO2 follows temperatures and has little effect on them.This is what you need to see to understand “feedback” or the postulated “amplification”.
- A colorful but informative and link-filled presentation is here.
- See the lag for yourself. My large graphs of the full 420,000 years of Vostok data is here.
- Discussion of ice cores, questioning reliability of CO2 estimates here. 1997
Feedback Loops
- Richard Lindzen calculates the feedback from data (ppt).
- Richard Lindzen shows how outgoing radiation demonstrated negative feedback and a climate sensitivity of about 0.5 C with ERBE data. (Lindzen and Choi 2009).
- Positive Feedback: Have We Been Fooling Ourselves?
- “Climate Sensitivity Reconsidered”: APS newsletter
- Hansen 1984, original paper.
- Paltridge 2009, Humidity levels are falling in the upper troposphere… (Summary)
- Spencer discusses watervapor feedback.
Hockey Stick Graph
- Good summary from the Ross McKitrick who uncovered Mann’s fraud 2005 overview and a 2008 speech with up to date extras.
- The Australian Department of Climate Change still sports the hockey stick on its website in 2008. ( Ahhh. Maybe they got the message. It’s gone now in 2009. I’ll try to find an archive version.)
- The Medieval Warming Period: What the combined mass of independent researchers say about the historical past in 2007 is in Figure 3 (the last blue downtick seems to be due to using 30 year averages with the last period ending in about 1975, the end of the last cooling).
- Hockey Stick? What Hockey Stick? This long pdf goes right through the Mann-McIntyre saga, then lists graph after graph of observations around the world over the last millenia that supports the idea that the Medieval Warming Period was real.
- Mann Bradley Hughes 1998 abstract, PDF, Correngium (2004)
- Briffas Hockey Stick. My summary; Climate Audit; Watts Up; Real Climate; A Reply to Real Climate; Briffas’ reply; (CA reply to Briffa); Yamal06 – the most influential tree.
- Andrew Bostom‘ summary: “Horse Hockey Climate Scientology” Dec 2008.
- Wegman Report 2006. ( Back up)
- McIntyre and McKitrick: Corrections to Mann 2003; Hockey Sticks, Principal Componants, & Spurious Significance 2005; M&M Critic and update 2005.
- David Deming on that email “get rid of the MWP””.
- Story in Dutch Magazine in 2005 Natuurwetenschap & Techniek.
Miskolczi
- Optical Depth, the greenhouse effect
- Miskolczi’s web site.
- F.M. Miskolczi: Greenhouse effect in semi-transparent planetary atmospheres. Idojaras – Quarterly Journal of the Hungarian Meteorological Service, Vol. 111. No. 1. 2007.
- The Stable Stationary Value of the Earth’s Global Average Atmospheric Plank-weighted Greenhouse-gas Optical Thickness 2010 (publisher)
- Optical Depth of the Atmosphere (graph)
Medieval Warming Period (MWP) & Little Ice Age (LIA)
The best collection of information is the Medieval Warming Period Data base and Map at CO2science.org. (Look at that map, it’s animated.)
- Temperature reconstructions –
- Tree rings, South America, last 3620 years, Lara 1993.
- Gunten 2009, Sediments in Chile, AD 850- present. MWP 0.3 degrees and LIA from 1350-1750.
- Discussion of tree ring proxies and their limits.
- References to studies and information.
- Boreholes
Oceans (see also Water)
- Ocean temperatures: The New Bluff in Climate Temperatures, David Evans, Science and Public Policy Institute.
- Measurements of Sea level rise (University of Colorado)
- The Role of the Oceans in Climate, Summary: NOAA.
- Argo Buoy Data
- William Di Puccio discusses the ocean data and whether it falsifies the AGW theory
- Wiki on Argo Buoys
- Watts Up on cooling oceans and falling CO2 . 21-3-09
- John Willis reassess’s the ARGO data
- Pielke Snr reassess’s Josh Willis’s reassessment.
Oceans (Acidification)
- Influence of undersea volcanoes: Acid Oceans Due to Undersea Volcanoes. (He notes in passing that freshwater lakes don’t seem to be acidifying. )
Pacific Decadal Oscillation (PDO)
- PDO Summary (Roy Spencer)
- PDO and Clouds (Roy Spencer) “Global Warming as a Natural Response to Cloud Changes Associated with the Pacific Decadal Oscillation (PDO)”
- PDO (best graph)
- PDO Summary here
Predictions
- BBC: Met Office Global Forecasts Too Warm In 11 Out Of Last 12 Years (2012)
- Predictions (that were right)
- Predictions (that went wrong)
Rivers
- Murray Darling River runoff and rainfall 1895 – 2010 (CSIRO)
Satellites
- NASA Earth Observatory (Beautiful images from space)
Science (Method and philosophy)
- Science – “The decline effect” Where experiments can’t be repeated. (Roy Spencer’s thoughts).
- Ioannidis study: “Why most published Research Findings are False”
Sea Ice
- Current global sea ice graph. Arctic Climate Research, Uni of Illinois.
- National Snow and Ice Data Centre NSIDC.
- Basics of Sea Ice annual flux.
- Antarctic NSIDC current year.
- Arctic NSIDC current year.
Solar-Magnetic Theory
- Solar cycles 24 and 25 and predicted climate response, David Archibald. Energy & Environment, Volume 17, Number 1, January 2006 , pp. 29-35(7). See also The Past and Future of Climate (Pdf).
- “Solar Cycle 24 Why the world will continue cooling and why carbon dioxide won’t make a detectable difference”. David Archibald, (2008, 70 page book)
- The Chilling Stars: The New Theory of Climate Change by Henrik Svensmark, Totem Books 2007.
- Reply to Lockwood and Frohlich by Svensmark 2007
- Falls in cosmic rays affect low clouds Svensmark 2009
- Alexander: Linkages between solar activity, climate predictability and water resource development
Snow cover
Storms (Hurricanes and Cyclones)
- Storm activity is at an all time low (Sept 2009)
- Ryan Maue’s Global Tropical Cyclone Activity
- Southern Hemisphere Tropical Cyclones (2010 – 2011)
- Tropical Cyclone Trends, Australian Bureau of Meteorology, updated graph.
Summary Documents
- Overall 2008 summary (50 page pdf) by the Non-governmental International Panel on Climate Change.
- 2009 NIPCC (Non Governmental International Panel of Climate Change). Check here for the latest detailed comprehensive report. 8Mb!
- Monthly reports by SPPI. See the latest graphs on CO2, Temp, Oceans and Ice.
- An excellent summary and collection of relevant graphs by Friends of Science
- see also Greenhouse Gas Theory (below).
- Environmental Effects of Increased Atmospheric CO2, Robinson, Robinson, & Soon. Excellent 12 page summary.
- There is No Evidence, David Evans summary pdf.
- There is no evidence (that answers the question) in the IPCC Assessment Report 4 Chapter Nine. AR4, Ch 9.
- Is the US Surface Temperature Record Reliable? Watts report.
- Projecting Australian climate change – Technical Report by the CSIRO 2006
Temperature
- RSS Globe: Remote Sensing Systems in California. Uses only satellite data.
- UAH: University of Alabama in Huntsville. Uses only satellite data.
- HadCrug: The Hadley Centre in the UK uses a mix of satellite data and land-based thermometers.
- GissGlobal: The Goddard Institute for Space Studies (GISS) at NASA uses land-based thermometers (plus a few ocean thermometers), but no satellite data.
- Plot your own graphs at WoodForTrees.org.
- Graphs of Southern Hemisphere versus Northern Hemisphere warming, Climate Audit
- Central England Temperature Graph, 1650 -2000
- Reconstruction of air temperatures in Eastern Europe based on Lambs Winter Severity Index.
- Half a billion years of CO2 and temperatures. Scotese and Berner GRAPH & Here
- Description of the Holocene Optimum (Uni of Arizona Lecture).
- Graph of temperatures since the last ice age.
- Western Australia temperature records
- Hubert Lambs‘ reconstruction of the last 1000 years.
Thermometers, Siting and Data
- Australian BOM data: Weather Station DATA
- Listing of Australian Stations
- Click locations to see Australian station photographs
- Google Maps
- Air-bases photographs
- UAH Satellite data v 6.0 Lower Troposphere | Mid-Troposphere | Tropopause | Lower Stratosphere
Thermometers, Surface recording (problems) (UHI)
- Urban Heat Island Effect: UHI
- Is the US Surface Temperature Record Reliable? Anthony Watts report.
- See Anthony Watts collection of photos of Weather Stations that record car-park warming, and air conditioner output. (Like these ones in Detroit Lakes, or Tucson, Wickenberg.)
- Watts and D’Aleo document the deliberate tampering of the data. (SPPI)
- GISS temperatures are ‘adjusted’ making the past cooler.
- Jones et al 2008 admit that urban warming accounts for 0.1 degree per decade in China!
- University of Melbourne work showing 1.8 C rise in Melbourne CBD
- Why ground measured data is suspect. Alan Carlin
Venus
There is no greenhouse effect on Venus with temperature, pressure and Stephan Boltzman to calculate with.Volcanoes
Water (Evaporation, cooling, latent heat)
- Evaporation from the oceans cools the planet by 50 degrees: NASA.
The Politics of Science
- Sacked! Pat Michaels. Will Happer. Wall Street Journal writes about Al Gores’ purge in 1993.The dog ate my evidence, Pat Michaels, National Review.
EPA regulations
- Alan Carlin writes on the EPA Proposals
History
- A history of the Global Warming theory by Spencer Weart.
- James Hansens speech in 1988.
- National Academy of Science “Global Environmental Change” 1999.
- The list of 100+ “Gates”.
Politics of peer review
- Roger Pielke Jnr interview with Tom Fuller on the misrepresentation of his research by government bureaucracies.
The ‘consensus’
- Two Nobel Physics Prizewinners,
- Four elite Astronauts,
- 1000 scientists dispute the AGW theory. Marc Morano’s list on the US Senate site. Over 200 pages of names, credentials, and statements.
- 30,000 scientists don’t agree that global warming is caused by man-made carbon dioxide, including 9,000 PhD’s.
There is no convincing scientific evidence that human release of carbon dioxide, methane, or other greenhouse gases is causing or will, in the foreseeable future, cause catastrophic heating of the Earths atmosphere…”
- Poptech defends Frederick Seitz and Art Robinson in detail. A great resource.
- A Canadian survey of more than 51,000 specialists in the Association of Professional Engineers, Geologists and Geophysicists of Alberta showed 68 per cent disagree with the popular statement that “the debate on the scientific causes of recent climate change is settled.”
- The Consensus. What consensus? John McLean. (See also IPCC)
The IPCC
- Prejudiced Authors, Prejudiced Findings. John McLean
- 50 articles that question the IPCC’s credibility.
- The IPCC Can’t Count. John McLean
- IPCC reviewers numbers are wrong. John McLean (July 2009)
- IPCC Assessment reports online
- Predictions, 1990. Pielke compares FAR, TAR, SAR and 4AR with observations.
Energy
- Key world energy statistics 2008 IEAE
- History of energy use since 10,000 B.C. book review
- US Dept of Energy (DOE). Energy Sources fossil fuels = 85%.
- Energy Information Administration (EIA). Energy consumption by fuel type Highlights. Energy by country by year
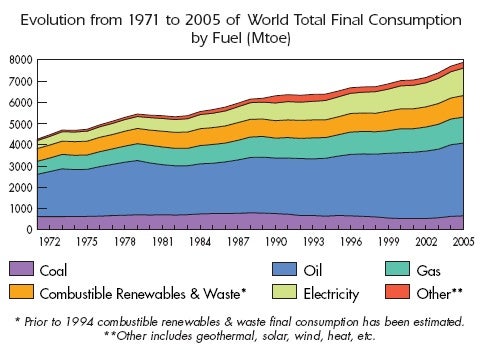
- Total Fuel consumption 1971 – 2005 Mtoe.
- Energy Consumption from 1860 -2000 graph, from page.
Energy (Alternative)
- UK Statistics on Energy Use (See the table “generation by fuel type”)
- Solar (My posts on solar energy)
- Wind Power (For Australian statistics, See Alan Moran at the AEF (Can wind power earn a place in Australia’s energy future? 7 pages) or Heartland 2010 ( Lower CO2 Levels: Costs, Benefits and Possibilities, 8 pages).
Logic and Reason
- How fallacious arguments are used for political or personal advantage
- Dr Sanity – on logical strategies used with narcisissm
The UN
- “United Nations. It’s your world. We just want to own you”. unisevil
The Money
Monetary Theory
- Global Money Supply – Dollar Daze compares Mo – M3 in different countries and official gold reserves.
- M3 inflation since 1969 in Australia. Deflationite blog.
- Reserve Bank Governor (Australia) Warwick McKibbin explains how monetary expansion has caused the GFC and how GFC II will be worse.
- Gold Bullion Daily historical statistics of turnover at the LBMA.
- GOFO (Gold Forwards): SIFO (Silver Forwards)
Economic Impact
- Costing climate change and its avoidance The Garnaut Climate Change Review.
- The impact of a carbon tax on international tourism. Richard S Tol.
- Carbon Tax a blow for developing countries. Samoa.
- British Airways chief says consumers should pay carbon tax on flights.
- Cost to offset flights. JP Morgan “Climate Care”.
- Why the free market will choose better energy sources. Alan Carlin
Funding the climate industry
- The US budget totals $30 billion on climate research between 1989 – 2008 through USGCRP + CSSP. Details here of annual expenditure.
- Activists get funding too. There’s a collection of examples here.
- Forbes Magazine interviews Rex Tillerson from Exxon.
- Funding for Tim Flannery, Tony Jones
- Greenpeace adds up claims for “subsidies” to fossil fuel industries. (IEA may have alternate numbers)
Research Programs
- Climate Science Technology Program CSTP (USA)
- Climate Change Science Program CSSP. 2009 report “Our changing planet” (USA)
- Australian government ARC funding from 2004-2009: Senate Estimates
- Australian Research Council (ARC ) | Page to find all ARC Discovery grants | Discovery grants: 2010 grants | 2011 grants | 2012 grants | Page to find all ARC Linkage Grants |
Trading carbon
- State and Trends of the Carbon Market, 2009. World Bank Report.
- State and trends of the Carbon Market, 2010. World Bank Report.
- STate and trends of the carbon market, 2011. World Bank Report.
- German Bourse Scraps Carbon trading 2012
Carbon Funded Programs
- World Bank Financed Projects
- Carbon Finance at the World Bank
Spin doctored
- A list of all the things global warming has been blamed for.
- Al’s snow job on ice cores in An Inconvenient Truth.
- Al Gores cartoon video of carbon molecules fighting sunbeams
- The Royal Society writes to Exxon to ask them not to exercise free speech. see also The Guardian .
———————————
Good luck, it’s a deep pool.I’m happy to consider suggestions, and will update this list page regularly. But I’m only looking for The Best, The Original, or very notable contributions. I’m not trying to emulate the 4,000-climate-links-pages. Apologies to all the good contributions out there which are not listed here. Email me joanne ‘AT’ joannenova.com.au
Last update Jan 9th, 2018
Skeptics Handbook artwork and downloadable files Here


[…] radiation observations by Lindzen and Choi, cloud feedback observations by Spencer, etc. See my links page for more […]
30
http://thedailybell.com/3688/VIDEO-Warming-Hoax-Rolls-On-Skeptical-Weathermen-Must-Be-Counseled
[Joe, it’s good practice to post a little something about your link. Tell us in your own words what the link is about. Manners man. mod oggi]
30
[…] http://www.guardian.co.uk/commentisf…e-good-science Climate Change alarmist converted: http://joannenova.com.au/global-warming/links/ There has never been a more serious assault on our standard of living than the carbon tax. […]
30
We have with us today one of the most prolific entrepreneurs one will ever meet. Mr. Whitelaw is a venture capitalist and invests in and helps …
30