These maps and graphs make it clear just how brazenly unscientific the Hockey Stick is.
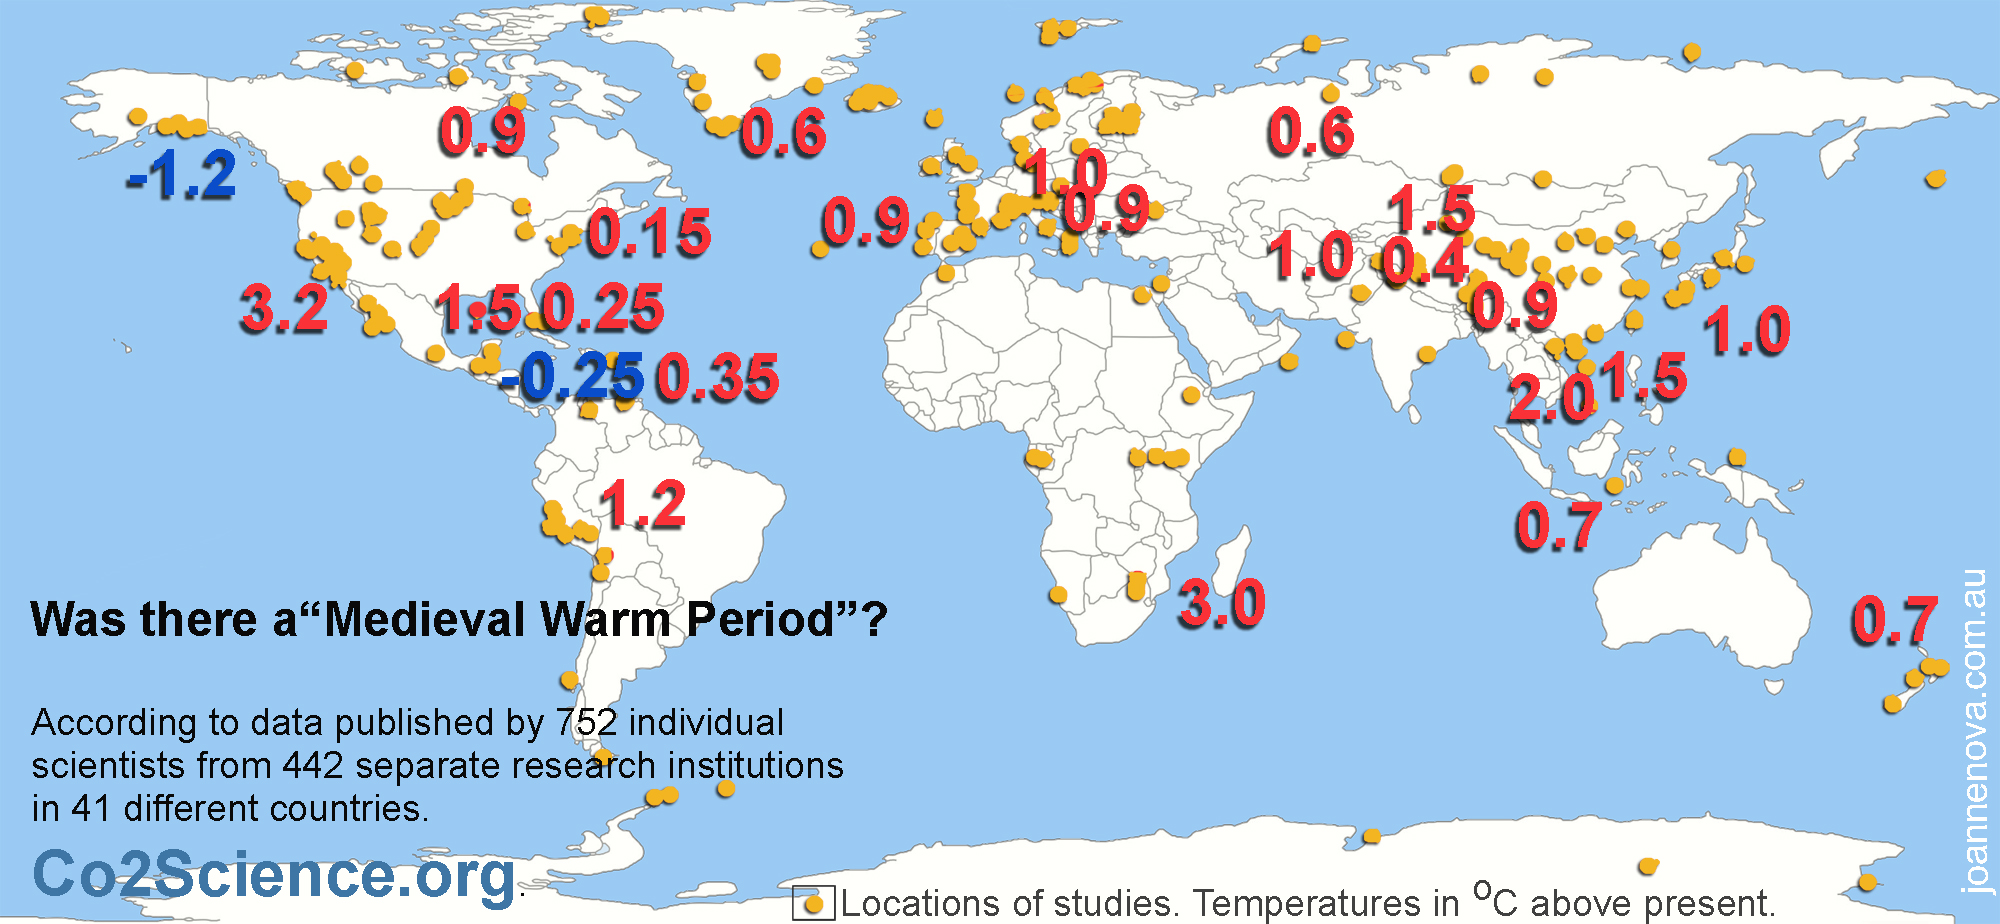
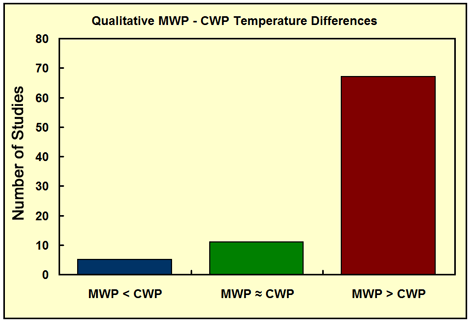
It’s clear that the world was warmer during medieval times. Marked on the map are study after study (all peer-reviewed) from all around the world with results of temperatures from the medieval time compared to today. These use ice cores, stalagmites, sediments, and isotopes. They agree with 6,144 boreholes around the world which found that temperatures were about 0.5°C warmer world wide.
***UPDATED: For more details on what boreholes show see this detailed post which updates this one. While other proxies give us information on the relative temperature and the timing, boreholes suggest the warming was global. Climate models don’t explain past global temperature swings. They don’t understand all the factors that drive the climate. The fact that the IPCC ignored this graph, which at the time agreed with most proxies, tells us the IPCC is not driven by science but by politics. The way the interpretation of borehole results have swung wildly reflects how politicized science has become.
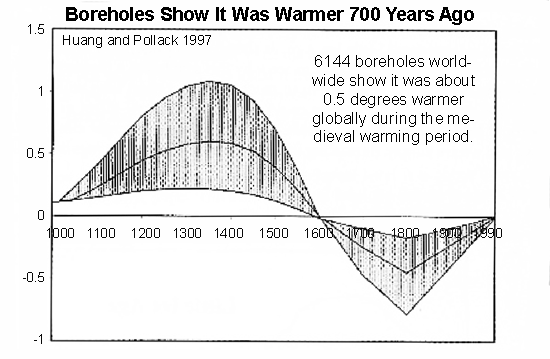
*UPDATE: This graph is from McKitrick & Essex based on data provided by Huang in 2002 from the 1997 paper. In 2008, HP published a different analysis, came to a similar curve, but cooler results, and belatedly said this graph above really ends in about 1900, not 1990. I’ll be updating on the complexity of boreholes and will post that link here soon (Nov 2012).
What follows is a sordid tale of a graph that overthrew decades of work, conveniently fitted the climate models, and was lauded triumphantly in glossy publication after publication. But then it was crushed when an unpaid analyst stripped it bare. It had been published in the highest most prestigious journal, Nature, but no one had checked it before or after it was spread far and wide. Not Nature, not the IPCC, not any other climate researcher.
In 1995 everyone agreed the world was warmer in medieval times, but CO2 was low then and that didn’t fit with climate models. In 1998, suddenly Michael Mann ignored the other studies and produced a graph that scared the world — tree rings show the “1990s was the hottest decade for a thousand years”. Now temperatures exactly “fit” the rise in carbon! The IPCC used the graph all over their 2001 report. Government departments copied it. The media told everyone.
But Steven McIntyre was suspicious. He wanted to verify it, yet Mann repeatedly refused to provide his data or methods — normally a basic requirement of any scientific paper. It took legal action to get the information that should have been freely available. Within days McIntyre showed that the statistics were so flawed that you could feed in random data, like stock prices, and still make the same hockey stick shape nine times out of ten. Mann had left out some tree rings he said he’d included. If someone did a graph like this in a stock prospectus, they would be jailed.
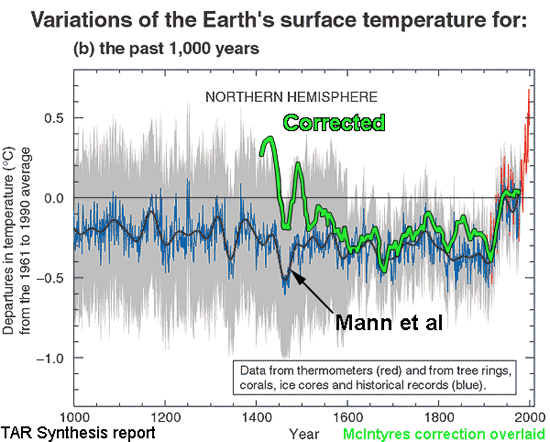
Astonishingly, Nature refused to publish the correction. The correction was published elsewhere, and backed up by the Wegman Report, an independent committee of statistical experts.
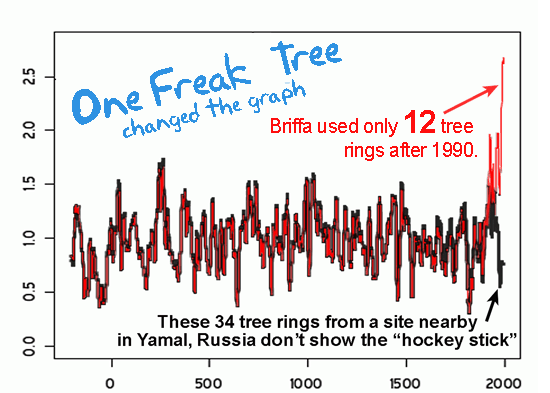
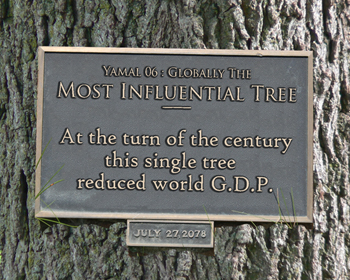
In 2009 McIntyre did it again with Briffa’s Hockey Stick. After asking and waiting three years for the data, it took just three days to expose it too as baseless. For nine years Briffa had concealed that he only had 12 trees in the sample from 1990 onwards, and that one freakish tree virtually transformed the graph. When McIntyre graphed another 34 trees from the same region of Russia, there was no Hockey Stick.
The sharp upward swing of the graph was due to one single tree in Yamal. Epic cherry-picking!
Skeptical scientists have literally hundreds of samples. Unskeptical scientists have one tree in Yamal, and a few flawed bristlecones…
It was a audaciously unscientific.
Climate models don’t know why it was as warm years ago.
The models are wrong.
The so-called “expert review” is meaningless. The IPCC say 2,500 experts review their reports, but those same “experts” made the baseless Hockey Stick graph their logo in 2001.

Craig Loehle used 18 other non-tree-ring proxies. Temperatures were higher 1000 years ago, and cooler 300 years ago. We started warming long before cars and powerstations were invented. There’s little correlation with CO2 levels.
UPDATE: Oct 26 2012 Craig Loehle published a newer version of this graph in 2008 which he noted at the time produced “little change in the results.”. In the interests of transparency, so people can judge for themselves, you can compare those two graphs above and below. A larger, longer more detailed study of the Northern Hemisphere was done by Ljundqvist in 2012. h/t to “NiceOne”. There is still clearly no correlation with CO2 levels, nor do the climate models reproduce the MWP.

Loehle 2008. Note the graph ends in 1935, not 1980.
…
Sources: Loehle 2007, Haung and Pollack 1997, See co2science.org for all the other peer reviewed studies to go with every orange dot on the map. McIntyre & McKitrick 2003 and 2005, and update, Mann et al 1998, Briffa 2006, read McIntyre at climateaudit.com, see “ClimateGate”, and Monckton “What Hockey Stick” (Science and Public Policy Institute paper)
TURN THE PAGES (Links in red will become active as pages are published). You are on the page in the Red Square.
| 1 | 2 | 3 | 4 | 5 | 6 | 7 | 8 + 9 | 10 | 11 | 12 | 13 | 14 | 15 | 16 | 17 | 18 | 19 | 20 |
This is Page 12 of The Skeptics Handbook II, a 20 page PDF.
I know a similar graph went up a couple of days ago around the web. The Skeptics Handbook II was published on Friday Nov 20.
ACKNOWLEDGEMENTS: Thanks to Craig Idso of CO2science.org for his fabulous collation of research and his Medieval Warming Project which is an excellent resource, try the animated map! A big thank you to John N for his work in helping to create the map.
—————————————————
UPDATE 5-Dec-2009: Information on the Map “dots”
The world map was created by looking at studies listed on Co2science.org. Craig Idso divided up studies into three different levels. Level 1 is the most useful, because they are able to tell us, not just whether the world is warming or not, but but also give a number. The level 2 studies just tell us whether things were warmer or cooler at that location, and with a specific timeframe. The level 3 studies are useful for pinpointing the time frame of the warming. All three levels are represented by orange dots. The numbers come from the level 1 studies. I did not put all the positive ones I could find because there were so many, but I included all the negatives I came across.
There are 57 studies of a level 1 category. There was clearly a warm period and it was clearly global.
This kills the line that the warm period was a “regional phenomenon”.
UPDATE: Information on Boreholes
Huang has published papers after 1997. Tellingly the one he published in 1998 (after Mann’s graph came out) dropped 95% of the data and only focused on the last 500 years. That’s one way to get yourself included in an IPCC report isn’t it? Ignore the other 95% of all your own work.
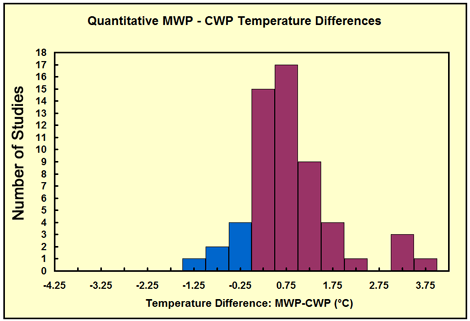
Huang published another in 2008 where he discounts the meaning of his earlier work. OK. So his opinion is worth considering. Lets consider how convincing his points are. Boreholes are supposed to be good because they are measurements of real temperatures rather than a “proxy”, but make no mistake, it takes a fair bit of interpretation to say exactly how hot it was in 1066 by digging a hole and taking the temperature a long way down. Huang had three different reconstructions for the medieval warm period in 1997: “a” was 0.2 degrees warmer, “b” was 0.5 degrees warmer, and “c” was 1.0 degrees warmer. Which one is more likely? How about the one closest to all the other types of proxies out there… Craig Idso writes that when they put all the level one studies together the number “most quoted” is 0.75 degrees above today (See the graphs below). He thinks the number is even higher (see his reasons below).
Boreholes on their own are not much good at telling us in absolute terms exactly how hot any era was, but they are good for giving us global century by century comparisons. Their big problem is that they can’t do the last century well, since the surface of the land is affected by shorter swings and by non-climatic effects.
Huang’s reasons for discounting his earlier work essentially say “my new graphs match the IPCC better”, but since ClimateGate blows away the pretense that the IPCC is a reasonable source of info, and that Mann, Briffa and all their derivatives are meaningful, I think we can “discount” Huang’s reasons.
Craig Idso emailed me about the question of the “average temperature” of the medieval warm period.
“As for the degree of warmth, we do not try to compute a grand mean for all level 1 studies. This is because of the different paleo proxies and methods used, and because not all the temperature values are for the calendar year. Many are for specific months, groups of months or seasons. So one can’t really compute a grand mean (and we don’t try to on the website). About as far as we go is to present a range distribution of all level 1 studies, which clearly demonstrates that no matter the method, the MWP was in nearly all instances, warmer. Bottom line, we feel the MWP project addresses the contention of (1) whether or not there was a MWP, (2) was it warmer (qualitative) than the current period, and (3) was it of a longer duration than the current warm period. To those issues, we feel the preponderance of evidence from the level 1, 2, and 3 studies indicates the answer to the question “Was there a Medieval Warm Period?” is a resounding YES.
With respect to the amount of warmth, again, I don’t think one can actually compute this due to the different period of time and proxies used, and the errors and calibrations associated with each study. But even if you took the apple-to-orange comparison and computed a grand mean of all the Level 1 studies, you presently get a value of about 0.8 to 0.9°C, which is not far off the 0.5°C in the borehole study. Personally, it is my belief that paleo proxies slightly dampen the highs and lows of the temperature record from what they truly are. Thus, the MWP was probably about 1 to 1.2 degrees warmer than present, which brings up the last issue, to what period of time are we comparing the MWP to the CWP. We try to be consistent, but cannot always be for one reason or another. Generally, we look for peak warmth in the MWP and compare that to peak warmth in the CWP (of the past three decades) from an author’s figure. Sometimes the authors do not provide a figure, but give us a number.”
Craig Idso
The bottom line is that there are a mass of studies that show it was warmer in medieval times, and that it was global. Yet there is a disinformation campaign out there by the IPCC and others to promote the idea that it was a local phenomenon and that the Hockey Stick Graph has not been resoundingly, completely shown to be scientifically baseless.
—————————–
UPDATED: The line “the world was warmer than 800 years ago” was changed to “the world was as warm years ago” to reflect updated results from boreholes that I was unaware of when this was posted. It makes little material difference to the arguments for or against CO2 whether the world was warmer or as warm 800 years ago, or 1000 years ago. We know it was warmer 5000 years ago in the holocene.
UPDATED: In light of current court cases the word “fraud” was replaced with “unscientific” pending the outcome of their decisions.


Beautifully done, Jo. As usual, you have managed to cut straight to the core, and lay it out in such plain view. I love the poignant illustrations.
Not questioning your conclusion, but I was interested to see the 0.5°C figure for the MWP. I thought it would have been more than that.
60
… Oh, and by the way, I also meant to say “thank you”. 🙂
50
The real world explanation seems simpler – the Team are doing pseudoscience.
This is when an initial belief is deemed correct by consensus and then followed by the scientific method to deduce tests.
As the initial assumption HAD to be correct, then any results which failed to support that assumption must be wrong, hence the Team’s effort to make the data fit the theory.
Put even more simply, the Team don’t seem to have ever understood the scientific method and its purpose in science which is to test hypotheses deduced from an “observation”.
AGW was never observed in the first place to require a theory for it.
The Team are a product of their post-modernist mindset and don’t understand the issue the sceptics have raised.
It’s that simple – no conspiracy, just bad education in the progressive manner.
70
There’s nothing high or prestigious about today’s editorial in Nature.
The whole editorial deserves a good fisking, But for me, the worst aspect of the article is the whole tone of the piece. The lesson to be learned from Climategate is that the scientific method has been corrupted. Lack of openness about the CRU’s work means that it can’t be tested by anyone else. The “peer review process” – which itself has clearly been bent to suit the Team’s aims – is not sufficient in itself to test the science. By constantly using the word “denier”, Nature is aligning itself with this corruption.
70
The map is just what we have needed. Thank you John N for producing it. A minor point, however. Would it be better to add on the map that all the data is published in peer-reviewed papers (I know ‘peer-reviewed’ is a somewhat tarnished product, but the general populace and politicos are comforted by peer-review and would use lack of peer-review as an excuse to ignore it)?
20
Thanks for the feedback! Let me know if anyone needs that map in a larger resolution file.
I can’t necessarily post every day so if you want to be notified of the more significant posts, don’t forget to register (top right column). Thanks! I hand write the emails that go out to the subscriber list, and there are no other emails than those I personally send (just in case you were wondering). 🙂
40
[…] This post was mentioned on Twitter by gibbomeister, gibbomeister. gibbomeister said: Yet more evidence of the great global warming fraud. http://bit.ly/70gNCv These people should go to jail! #agw #climategate […]
31
Joanne Nova wrote:
And what neat hand writing you have, Jo! 🙂
20
the significant message is that a climate model that is unable to model the past cannot be expected to generate credible forecasts of the future.
30
A quote I picked up recently:
“No model is a catalogue of ultimate realities, and none is a mere fantasy.
Each is a serious attempt to get in all the phenomena known in a given period,
and each succeeds in getting in a great many. But also, no less surely, each
reflects the prevalent psychology of its age almost as much as it reflects the
state of that age’s [scientific] knowledge.”
C.S. Lewis
20
Great work Joanne, excellent exposition. Well done.
In breaking news, BBC is now reporting that the email affair ‘will impact’ the Copenhagen summit.
[Well, this is unexpected news to the BBC! ]
The Saudi-Arabian lead climate negotiator Mohammad Al-Sabban told BBC the emails suggest that climate change may not have a human cause.
It will have a “huge impact”, he said and the UN summit should encourage a “full investigation” of the affair.
TIME magazine is also in denial, reporting “worrying signs” that skeptics are gaining traction.
LINKS TIME BBC
20
I guess C. S. Lewis never saw the inside of CRU.
I think that to make, “…and none is a mere fantasy,” believable you have to assume honesty on the part of the modeler. Today, as we now see, that’s not a good assumption to make and you have to look closely at everything.
Lewis lived in a different time and different academic world than today’s. His world was a very innocent one compared with ours.
20
The head of the CRU inquiry has been named.
See http://news.bbc.co.uk/1/hi/sci/tech/8393449.stm
http://www.heraldscotland.com/pound-23-000-pay-rise-for-university-principal-1.871413
20
Mann is trying to toss UAE under the bus.
http://wattsupwiththat.com/2009/12/03/mann-throws-jones-under-the-bus/#more-13652
I say Mann needs to take a time out and instead of digging his hole deeper, run to siberia and snag some more tree rings. The tree-ring circus is lacking in sample size.
20
The above link shows that a full third of Americans believe strongly that climate scientists are faking data.
The survey makes interesting reading.
20
Sorry, can’t get the link thingy to work.
Here it is again.
http://www.rasmussenreports.com/public_content/politics/current_events/environment_energy/americans_skeptical_of_science_behind_global_warming
20
You won’t hear Santer speak less than glowingly about EAU – he received his PhD at the CRU there (1987) (under Tom Wigley, I believe) – Wigley left for NCAR leaving his marionette Phil Jones in charge of the show at CRU
Wigley was brought to CRU by CRU founder Hubert Lamb (in 1973?) because Wigley “knew about computers and computing” – something that Lamb was not knowledgeable in, but something that Lamb believed would be useful to help him achieve his vision, “reconstruction of past climate and prediction of future clikmate from knowledge of the present.”
Bringing with it CRU undoing, I suppose, because Jones seemed to be a preety capable puppet but Jones didn’t seem to be aware of a fundamental theorem about computing: you can hit the “delete” key on emails you don’t want other people to see, but the emails are never actually “gone”
20
Hi Joanne,
The map image link are wrong, I notice it’s the adress: says http://joannenove instead of http:/joannenova
Thank you for a beatiful post.
20
Jo, in the last graphic where you use the phrase “tree rings” you should have “cores”.
Elephant seals used to breed on the Antarctic coast during the MWP, but now it’s too cold. I guess there’s no orange dot for that because no estimate of temperature was made by the researchers.
BTW, Mann has discovered the MWP [see November 27 issue of Science].
20
I read a US poll somewhere that more Americans believe in haunted houses than in AGW!
20
Jo,
Great Article! Yesterday I responded to your article about “The Tipping Point.” I said that somebody involved in the Climategate scandal would spill the beans to avoid prosecution. Well, it has already begun. Michael Mann is distancing himself from Phil Jones and is driving the bus right over the guy. See http://www.telegraph.co.uk/earth/copenhagen-climate-change-confe/6718183/Climategate-Phil-Jones-accused-of-making-error-of-judgment-by-colleague.html I predict Mikey Mann will wind up sticking his hockey stick in his mouth. The first thing an American police officer tells you when you are arrested or under suspicion is, “You have the right to remain silent, anything you say can and will be used against you in a court of law.” Coincidentally, Phil Jones was taken in for questioning by the police. He said he was being treated like a victim. The police are going to take his statement, compare it to the evidence and probably prosecute him. Anybody with a brain knows that it is more than a coincidence that Manns and Jone’s conclusions regarding past temperatures are almost identical. As your map and graphs in this article show, the medieval warm period was global and warmer then the current warming. There is a plethora of peer reviewed literature that the conspirators couldn’t prevent from being published that shows that the medieval warm period was warmer then the current warming period and it was global! These climate criminals (see Wegman Report) have been falsifying data for years. Not only is Mann’s MBH98 (Mann, Bradly and Hughes) hockey stick smashed to smithereens but so is Briiffa’s and the other ones (eight or nine) that were based on Mann and or Briffa’s [snip, “unscientific” is a better word] temperature reconstruction! These guys are going to turn on each other or wind up with a “Daddy” in prison who will offer protection in exchange for sex. I find it relatively easy to envision these “scientists” in the prison shower with a soap on a rope around their necks hoping that it will somehow save their asses (pun intended.)
During the Watergate Affair it wasn’t the burglaries that sent most of those involved to prison it was the attempt to cover the crime up that got them in legal hot water! Michael Man said in the above noted linked article that he didn’t delete any emails. Really? Well, it is a good thing he was not under oath as he
would[might] be liable for perjury charges. The following email exchange shows him to be a liar ” Jones, head of the Climatic Research Unit of the University of East Anglia, wrote Dr. Mann: “Mike: Can you delete any e-mails you may have had with Keith [Briffa] re [the IPCC’s Fourth Assessment Report]? Keith will do likewise. . . . Can you also e-mail Gene and get him to do the same? I don’t have his new e-mail address. We will be getting Caspar to do likewise.” Dr. Mann wrote back: “I’ll contact Gene about this ASAP. His new e-mail is: [email protected]. talk to you later, Mike.” Mann clearly contradicts himself.Many Americans think that FBI agents have the personality of a styrofoam cup but the fact is they are talented and relentless. Does anyone really think that Bradley or Hughes is gong to do time for Mann? They will sing like birds, as will the rest of those involved. When the FBI executes search warrants on these guys they will probably get a lot of evidence even if the criminals think that they had deleted all of the incriminating data. The raw data from the CRU that was “accidentally” erased will probably be “found”, as well. After the “squeeze from the bottom” process begins there will be an incredible number of scientists indicted or named as unindicted coconspirators. As I have written before, how high up the food chain will this go? I am going to sit back and enjoy the show not because I am sadistic but because I will have the peace of mind that comes from knowing that my children and my grandchildren will have been spared the experience of living under the tyranny of the ecofascists.
20
What a great post – I love it! Interesting to see that Southern Africa was 3 degrees warmer than today and yet there was no major catastrophe, huge sea level rise, mass extinctions, etc etc. Keep up the great work.
20
Joanne — A (partially) tongue-in-cheek suggestion:
Since the[y]
warming fraudscontend that Steve McIntyre is not “peer reviewed”, perhaps you should refer to him as “The peerless Steve McIntyre.”20
Excellent information Jo… Good stuff.
10
Pompous Git,
tree cores still show tree rings.
Now if there was an issue about how the rings are exposed as in slices as opposed to cores…
10
[…] Nova finds the Medieval Warm Period 4 12 2009 From Jo Nova a look at how the MWP looks when other data is used, not just a few trees in […]
10
Hi Joanne,
This is very interesting, but when you say “warmer than today”, what do you mean by “today”: does this mean “the period of the 1990s” or does it mean “the temperature of last decade” minus 0.6-0.8 C? Generally, climatologists consider the 0.6-0.8 C rise since whenever the “anomaly” and temperatures are usually given relative to this “anomaly”. So depending on what is meant here makes a huge difference.
Thanks,
Alex
10
http://www.co2science.org/subject/b/summaries/boreholes.php
This is what Craig Idso wrote on the link above about the big Borehole (Huang 1997) Study
“This effort revealed the existence of a global Medieval Warm Period that was as much as 0.5°C warmer than it was in the late 20th century, as well as a global Little Ice Age that was as much as 0.7°C cooler than it was in the early 1990s. “
Each of the other studies may have slightly different reference periods, so it’s very difficult to pin things down. The number of studies is truly extraordinary.
Criag Idso has told me he has another 500 or so he hasn’t put in the data base yet.
BTW – If anyone out there has a copy of a Scientific American article on boreholes and climate records from circa 1988-1993, I’d love a copy. I had one cut out a few months ago, but can’t put my finger on it. It described their hopes of how useful boreholes would be. I have a feeling it was 1989.
10
Prior to the first close up photos of Mars, there was a concensus amongst astronomers that Mars was cris-crossed by a network of canals, which many eminent astronomers mapped. Their maps were subjected to the normal peer review process, yet they were all a result of people forcing data to fit a pre-concieved theory and the reviewers also shared the desire to force facts to fit the same cherished theory. Instead of cherry picking data, as AGW supporters have done, surely the collection of data about global temperature and atmospheric CO2 over the earth’s history can be accomplished, with proponents and opponents of the theory debating their methodology in public. How accurate are earlier temperature readings? How were instruments calibrated? Were errors random or systematic? What constitutes a valid proxy measurement? Surely, if tree rings and stalactites are valid proxies for temperature, their validity must be time-independent. Why are tree rings considered valid as a proxy for temperature for years prior to 1960, but not subsequently? What variance is there between trees of the same species, at identical temperatures throughout their lives? Creation Scientists published material which puported to show that the gravitational constant had become smaller, since the 16th century. However, their material ignored the fact that the accuracy of measurement then was much less and the change was much smaller than the expected error of measurement. People are free to believe whatg they wish. A scientist must allow any theory to be subjected to rigorous investigation and criticism and political leaders should never be allowed to use corrupted pseudo-science to further a political agenda.
10
Check out the chart of the temperature cycle here:
http://www.climate-skeptic.com/2009/12/a-total-bluff.html
It supports the cyclical temperature graph shown above.
10
First visit, fabulous work! Should be on the front page of every paper in the world (ha).
10
[…] Nice graph shows how the Medieval Warming Period was much warmer than today […]
10
@ kuhnkat:December 4th, 2009 at 5:37 pm
“Pompous Git,
tree cores still show tree rings.
Now if there was an issue about how the rings are exposed as in slices as opposed to cores… ”
I never claimed that tree cores didn’t show tree rings. I merely pointed out an error in Jo’s graphic. It’s the kind of error that the Gullibles leap upon when referring to Sceptic writers’/thinkers’ [delete whichever is inapplicable] work/writing/thinking [delete whichever is inapplicable]. IMHO, the reduction of error is a Good Thing.
10
[…] http://joannenova.com.au/2009/12/fraudulent-hockey-sticks-and-hidden-data/ […]
10
The Loehle reconstruction only goes up to 1935 so why have you graphed it as if it goes up to 2000?
This smacks of “hiding the increase”. If the end point is indeed 1935 and not 2000 then the Loehle reconstruction and instrumental record actually suggest temperature is as high or higher than the medieval warm period, which is completely at odds at the conclusion you come to.
10
Please also provide me with a list of location names used on the map depicting temperatures at MWP along with the precise dates those figures are taken at.
10
Great article, Joanne! It’s good to see this issue when it’s put together like this! Something Alarmist’s and the Left don’t want to understand and of course “the Biased Media” to go with it…All of which is known by most of Us here….
Here’s William M. Briggs, a Statistician who puts out some great articles…This one especially! A Citizen’s Guide To Global Warming http://www.globalwarminghoax.com/e107_plugins/forum/forum_viewtopic.php?1377.last
Here’s the latest from Tony Hake about America’s Rassmusen Poll: American’s Belief In Global Warming Continues To Sag In Wake of ClimateGate but yet most of the Media and Democrats and Alarmists ignore what’s been happening!!
http://www.globalwarminghoax.com/e107_plugins/forum/forum_viewtopic.php?1375.last
Another great article to which Frank J. Fleming is copying from a movie! Very good though…. A Few Good Scientists http://www.globalwarminghoax.com/e107_plugins/forum/forum_viewtopic.php?1372.last
10
Ben Gardiner: Post 4,
Ben, It will catch up the the People at “Nature”! If this issue really tumbles, they will go along with it! And so be it!! They are not the only organization that deals with Climate Change reviews!
10
Hi Joanne,
I’d like some free graphs, cartoons and updates but your email address didn’t work.
10
We’re still playing catch-up. We’re looking back at what has been done, and we must turn and look ahead.
When the true agenda of this astonishinging fraud is achieved at Copenhagen, the instigators will simply shrug and ignore any debate about “the science”. Corrupt scientists have already served their purpose. Their time will come, but we must not be distracted by pursuing them when the prize is within sight.
It’s now time to focus on the underlying purpose: world currency and world governance.
We must hold the perpetrators accountable for what they are about to do. We must do this now.
10
Thanks Jo, valuable stuff. Nature’s editorial on ClimateGate could have come from Sir Humphrey Appleby and the topically-named Jim Hacker. A complete snow job. I intend to have a go at Nature via the Spectator which in contrast has covered the issue well – critical of ClimateGate but in a sober way. I am sick of Nature, Science and Scientific American engaging in blatant advocacy science. The most I would say for the greenhousers is that precautionary emission cuts are fine with me – so long as they are done sensibly and don’t put a lot of ordinary people out of work.
10
Hi Joanne,
Since you’re relying quite heavily on borehole reconstructions by the team of Huang, Pollack and Shen, I wonder if you’ve read their publication from 2008:
Huang, S. P., H. N. Pollack, and P.-Y. Shen (2008), A late Quaternary climate reconstruction based on borehole heat flux data, borehole temperature data, and the instrumental record, Geophys Res Lett, 35, L13703.
(http://www.agu.org/pubs/crossref/2008/2008GL034187.shtml)
In it they address their 1997 publication (referred to in the text as “HPS97”) as follows:
(My emphasis)
So, why can’t HPS97 be used to compare the MWP with the 20th century? Read on …
(again, my emphasis)
So, what does the reconstruction look like when you include borehole measurements relevant to the 20th century? To see the graph, you’ll have to download the paper and read it for yourself, but the authors summarise the results below:
(again, my emphasis)
Really, it’s a little ridiculous when scientists have to spell things out for a bunch of non-scientists who want to deliberately misconstrue data. But nonetheless, Huang, Pollack and Shen have done exactly that, and cleared up any misunderstanding over their 1997 publication and furthermore explained what the reconstruction looks like when temperatures are continued to the present day. It’s also worth noting that this is not some recent backflip: they have publications from 1998 (e.g. Science 282:279-282) showing exactly the same thing.
All of which makes me wonder, why can’t the self-designated “sceptics” actually be a little sceptical about the graphs they love to show? A little bit of research would go a long way in cases like these.
If you’d like to discuss this or any other matters further, please send me an email.
Regards,
Owen
20
Co2 science DOT org produced some videos related to Copenhagen and the evolving discussion of the effects of CO2 in the atmosphere
10
Light relief time-out:
http://smallestminority.blogspot.com/2009/12/zing.html
10
[…] This post was mentioned on Twitter by Sam Browning, Kathleen Camilleri. Kathleen Camilleri said: Fraudulent Hockey Sticks and hidden data http://joannenova.com.au/2009/12/fraudulent-hockey-sticks-and-hidden-data/#more-4660 […]
10
[…] […]
10
[…] a look at this post from JoNova which re-caps the work of Canadian statistician Steve […]
10
Owen:
” The reconstructions show the temperatures of the mid-Holocene warm period some 1–2 K above the reference level, ..and end-of-20th century temperatures about 0.5 K above the reference level”
Which tells us that according to these authors it was warmer in the mid-Holocene warm period than at present. So the revised data supports the view that the clain that current temperatures are unprecedented is false.
“Really, it’s a little ridiculous when scientists have to spell things out for a bunch of non-scientists who want to deliberately misconstrue data.” The arrogance! Translation: just keep giving us billions of dollars and ask no questions. And by the way, many of the people involved in this debate are scientists who are appalled at the way climate science is tainting science as a whole. Your post is a very good example of what we mean.
10
cthulhu #35 #36.
Loehle paper is here (at the bottom of the post). I merely copied it and added a few labels.
For the exact papers go to CO2science.org – look at the medieval warming period project data base. All the studies with numbers near them on the map come from the Level 1 studies on Craig Idso’s list. I did not include all the levels ones as numbers because there are too many, and my point was that the warming was global, so I didn’t need to repeat all the ones from europe.
I have a pdf list of 234 studies, but it doesn’t separate out the level 1 ones from the others. (Level 1 is Craig Idso’s classification and is the top ranking quantitative studies where we are able to estimate a temperature, rather than the less exact level 2 and 3, which can tell us warmer or cooler, but don’t provide numbers.
Jo
10
Hi All,
Major update added to this post (See the bottom of the post).
1. Craig Idso adds in more information.
2. I explain how I created the map above, and
3. I answer Owens claim that Huang et al have discounted their own work.
In short “Huangs reasons for discounting his earlier work essentially say “my new graphs match the IPCC better”, but since ClimateGate blows away the pretense that the IPCC is a reasonable source of info, and that Mann, Briffa and all their derivatives are meaningful, I think we can “discount” Huangs reasons for his post-hoc reinterpretation.”
Look at the graphs Idso provides.
The bottom line is that there are a mass of studies that show it was warmer in medieval times, and that it was global, yet there is a disinformation campaign out there by the IPCC and others to promote the idea that it was a local phenomenon and that the Hockey Stick Graph has not been resoundingly, completely shown to be a baseless fraud.
10
Hi Jo,
Thanks for the response. However, to suggest that Huang, Pollack and Shen deliberately fiddled their data to fit with the IPCC is just ludicrous!
[And I didn’t suggest that. I merely suggested that they “ignored” the inconvenient stuff that didn’t fit with the IPCC machine, and reinterpreted their results post hoc. They didn’t necessarily know that Mann and Briffas graphs were frauds. They may have honestly calibrated their work to fit with what they thought were other honest proxies. Since it is clear they should have calibrated their work with the mass of other studies by literally hundreds of other researchers here, why would we throw away 234 studies which say the world was warmer all because one or two researchers “reinterpreted their work” to fit it to a few frauds? – JN]
As they point out, their 1997 work explicitly stated that they can’t use borehole temperature analysis within 100m of the surface, which equates to the last hundred-odd years. There’s been no backflip, no being “brought into line” — it’s just correct science, and has been from the start. So to say as you do that
(my emphasis) is just plain wrong. Their 1997 publication only considered temperatures up to c.1900, and this was made plain at the time in the text. Their 2008 paper is simply pointing out what the reconstruction looks like if you take it all the way to the present day, since people had been using their work to suggest something which wasn’t true. Seeing bias in this is just paranoid!
[OK, so lacking a reasonable “borehole” for the 20th C, they added on the GISS record or some such, or the Hadley one, neither of which is openly available for sceptical scientists to check, and both of which use ground sensors that fail the siting standards 89% of the time. Thinking that we should just assume the surface record is correct, despite all the evidence that it isn’t, is delusional faith. – JN]
In any case, the only way you can use their work to suggest that the MWP was warmer than current temperatures is to suggest that the entire instrumental temperature collection data from weather stations is wrong! Do you honestly believe this to be true?
[Yes. See link above. Over 50% of world wide surface sensors are at airports next to 2 km2 tarmac.- JN]
Think about it: what does Occam’s Razor suggest is the most parsimonious explanation here? That this is all one big conspiracy in which data from numerous sources (weather stations and satellites) have been deliberately fudged? Or that data which happen to match predictions first made in the nineteenth century that increasing [CO2] would increase global temperatures might just be right?
[Occams razor suggests that when they have no evidence, their theory is wrong. Surprise, major money, fame, status and rewards have meant that mostly honest, but inept work, powered by a vested bureaucracy has stood long after it’s useby date. The simple explanation… people like money and fame. No one likes to say they were wrong. No committee votes itself out of existence. It’s not that complex is it? I can simplify it to six words if you want “Banks want us to trade carbon”– JN]
There’s two points to be made here. First, you really should have done your research before blindly parroting graphs that seem to suit your purposes.
[I did do my research. 54 peer reviewed studies say the world warmed. 2 say it didnt. The 1997 boreholes paper fits with all those. Huangs post hoc explanation doesn’t look convincing. Your apology is accepted. – JN]
I found Huang et al’s 2008 paper simply by looking at the papers that had cited HPS97; it was a logical step than any scientific researcher would do. Being a true sceptic means being sceptical, not bigoted. It means considering all possible explanations and coming to the most parsimonious conclusion, not cherry-picking data to fit the most implausible thesis available!
[Exactly why you shouldnt cherry pick. Well said – JN]
Secondly, all of this is rather beside the point because nobody (well, no scientists, at any rate) is claiming that current temperatures are the warmest they’ve ever been. They’re not — the earth has almost certainly been warmer in the past, and you don’t need borehole analysis to tell you that. The point is that it’s the magnitude and rate of recent warming that’s anomalous. And if you want to use boreholes for this, Huang et al’s 2008 paper illustrates this rather well (take a look at Fig. 2). Whatever you might like to think of the temperatures of the MWP, we’ve never seen a sudden increase like this before, at least for as far as the proxy data will take us.
[Actually we have, but I havent posted those excellent graphs yet, so you’ll have to wait and see the ice core analysis that I’ve been sent – JN ]
It’s all of fairly minor import since none of this impacts on the core science of the issue.
[No. To any rational mind, it blows their theory away. Their models are wrong. They’ve got no other evidence (and models aren’t evidence anyhow). – JN]
Namely, that it has long been predicted that increasing the concentration of greenhouse gasses would increase the world’s temperature. Arrhenius first proposed this in the 1890s (he thought that warming from CO2 emissions would offset the next ice age and be a good thing!) The instrumental data over the last century is simply a confirmation of all the theoretical physics that came before it. From this, as good scientists, we must deduce that in the absence of any evidence to the contrary (and since we’ve been measuring every other non-GHG forcing we can think of for some time now, we can exclude them with a fair amount of confidence), the most likely explanation is that increasing [CO2] increases warming. (And yes, this is a simplification of the science, which has been discussed in depth elsewhere, but the basic tenet stands.)
[No. The basic tenet – shown by all of Huangs papers is that the world has been warming since 1700 or so. Most human CO2 was put out since 1950. Ergo, most of the warming was natural, and we don’t know what caused it. – JN]
To suggest that this is wrong you would need to not only (a) disbelieve the instrumental temperature records over the last 150 years but also (b) disbelieve the basic physics behind the principles of a greenhouse effect. I hope (I really do hope) that you can see that, in all likelihood, whilst position (a) might be paranoid, position (b) is just plain wrong!
[Yes, I’ve answered this point many times, includingthe day before yesterday The greenhouse effect is real but only 1/3 of the projected warming. Go read chapter 8 of AR4. I have. – JN]
(Well, to be fair, there’s always a possibility that (b) isn’t wrong … but nobody’s come up with evidence against it yet and not for want of trying. It’s very difficult to explain how our planet has the hospitable temperature it does without a greenhouse effect (!) and major issues regarding the effects of increasing [CO2] such as the question of saturation (originally proposed in the early 1900s) were shown to be incorrect (from measuring spectra in the upper atmosphere) in the 1950s (see, e.g., Plass (1956) Quarterly J. Royal Meteorological Society, 82: 310-29))
[Read about Feedback.
20
Davidc: Whilst I am a scientist, I have a PhD in molecular biology not climatology, and am in no way involved in any climate science research. That hasn’t stopped me being interested and sceptical, reading up on the research (properly!) and understanding the science.
You should know, incidentally, that no researcher ever gets $Billions (if only we did!) and you should remember that this money is for research, not salaries (sadly!) Scientists truly get paid a pittance, and we do it for the love of working out what’s going on, not for monetary gain. (Of course, if one was to be a consultant for, say, a fossil fuel producer, one might supplement one’s income a fair amount … hmmm … but that would be wrong to suggest, wouldn’t it, since we don’t consider conspiracy theories here!)
[ Already answered this point. See Climate Money. Read the whole paper. I’m not suggesting scientists did anything dishonest, though obviously in the light of climategate, they did. A monopoly in science is itself a self fulfilling prophesy. They were paid to find a crisis. They found lost of connections, coincidental correlations, and “effects”. But they didn’t find empirical evidence related to the cause of major warming being carbon. – JN]
Anyway, I’m a scientist who’s not a climate scientist, and the only thing that appals me is the arrogance of the ignorant that’s displayed on sites like these. If you have valid, sound, scientific arguments as to why the current consensus is wrong, please present them. Scientists will listen, engage you in debate, test your theories and ultimately — if they pass all tests that can be thrown at them — accept them. This is what it truly means to be a sceptic, and that’s exactly what happened with the theory of AGW (which is why it took us until the 1980s to broadly accept it, rather than from the get-go when ol’ Arrhenius put it out there in 1896).
[ Owen, we have already produced such evidence. This is merely the icing on the cake. This is just one of 90 posts here, and I’ve produced two Skeptics Handbooks which are freely available, and any reasonable researcher (to use your own words) would have looked at what I wrote before “being appauled” and accusing me of not doing my research… but you are forgiven for not noticing the earlier posts on the missing hot spot and other related posts, or my graphs on the Vostok ice core, as far as I know I may have been the first to graph it in detail – at least for the public. It merely supports many uncontested peer reviewed papers. There are many other posts. – JN]
The problem — as nicely illustrated by the misuse of poor Huang et al’s 1997 data here — is that you and your kin aren’t indulging in scientific debate at all. There’s no scepticism here; there’s just a blind faith that (bizarrely!) the mainstream scientific consensus is wrong. As the comments above my original post show, not a single person even bothered to read the references themselves! Nobody troubled themselves to say, “Hmmm … now, I wonder why the climate scientists didn’t pick up on this before? Could it be that there’s actually a simple explanation for all this other than a world-wide conspiracy?”
[We don’t need a conspiracy. You’re making baseless allegations and if you had bothered to google and look at the mass of skeptical material, you wouldve known that hundreds of meterologists and climate scientists have picked holes in the theory of AGW – and for twenty years. But they don’t have budgets of $79 billion, crews of PR teams, whole ministry’s devoted to promoting their work, or dozens of major financial houses which are making billions in profits from a topic that depends on their research. What a surprise, they also don’t have an intergovernmental panel on natural climate factors either. You’d have to be crazy to think that these hundreds of other scientists have nothing valuable to say, yet you haven’t read any of it apparently? – JN]
If this was just a debate about whether or not the earth was flat it’d be comical. But this is a debate about something which — whilst it probably won’t affect my life very much — will probably affect the life of my daughter, and almost certainly her children. It matters.
[Exactly, so before you act as an apologist for giant bank profits, perhaps you could read both sides of the story instead of just realclimate and info from vested interests? – JN]
So tell me, Davidc, how many journal papers on climate science have you actually read? Or do you just blindly believe what the blogosphere tells you? (And didn’t anyone ever tell you that you can’t trust all that you read on the internet? Oh, but you’re a sceptic, of course, so you’d already know that. Silly me …)
[To state the obvious, you might have more chance of winning us over if you don’t start by throwing baseless insults. – JN]
10
Owen, thanks for your diligence in trying to defend the indefensible, but we’ve heard all these arguments before, and I’ve posted inline replies.
Jo
10
Owen,
I understand your position. Now will you understand mine?
I’m being asked to make rather draconian sacrifices to save the planet from impending disaster. CO2 is being blamed for that disaster. So for a long time I, along with others have been asking for evidence that CO2 is in fact warming the planet. No one has shown any such evidence. It’s all just theory and, “You better believe because we say it’s true.”
When you argue consensus you argue that the truth is a thing to be decided by majority opinion. If this were true you would have to admit that the much larger number of equally qualified scientists who disagree with the AGW theory decides the issue in their favor.
But let’s get back to reality. Climate science tells us nothing about the cause of the observed changes. Effect does not prove cause — doesn’t even show cause.
Our problem is simple. Something no one has shown to be true, something a secretive group of holier than thou experts is shoving down our throat, is being used as justification for forcing the human race back into the 19th century while outright thugs make money from it and the UN tries to become the world’s government. Unproven theory does not justify what’s being attempted by various governments and in Copenhagen.
We don’t like that. Nothing else really matters at this point.
What say you?
10
Here is the Abstract of an interesting January 2009 paper:
Abstract
The atmospheric greenhouse effect, an idea that many authors trace back to the traditional works of Fourier (1824), Tyndall (1861), and Arrhenius (1896), and which is still supported in global climatology, essentially describes a fictitious mechanism, in which a planetary atmosphere acts as a heat pump driven by an environment that is radiatively interacting with but radiatively equilibrated to the atmospheric system. According to the second law of thermodynamics such a planetary machine can never exist. Nevertheless, in almost all texts of global climatology and in a widespread secondary literature it is taken for granted that such mechanism is real and stands on a firm scientific foundation. In this paper the popular conjecture is analyzed and the underlying physical principles are clarified. By showing that (a) there are no common physical laws between the warming phenomenon in glass houses and the fictitious atmospheric green- house effects, (b) there are no calculations to determine an average surface temperature of a planet, (c) the frequently mentioned difference of 33 ◦C is a meaningless number calculated wrongly, (d) the formulas of cavity radiation are used inappropriately, (e) the assumption of a radiative balance is unphysical, (f) thermal conductivity and friction must not be set to zero, the atmospheric greenhouse conjecture is falsified.
Electronic version of an article published as International Journal of Modern Physics B, Vol. 23, No. 3 (2009) 275–364, DOI No: 10.1142/S021797920904984X, World Scientific Publishing Company, http://www.worldscinet.com/ijmpb
10
Rod,
The paper quoted can be downloaded from:
http://arxiv.org/PS_cache/arxiv/pdf/0707/0707.1161v4.pdf
10
Owen,
“So tell me, Davidc, how many journal papers on climate science have you actually read?”
My approach is to follow up on what seem to be key papers which have beeen presented in the mainstreammedia as clear signs of looming catastrophe.
The Vostok ice core data was the first of those for me (we no longer hear about that since it is now clear that temperature changes precede changes in CO2). Another key paper for me was Mann et al(1998) and the analysis by McIntyre and McKittrick (2003) which exposed the “hockey stick” as a statistical artifact. The Wegman report supported my own conclusion from reading Mann (1998) that this was an extremely poor piece of work at all levels. From the climategate emails you can see that this view was also held by some within the climate science community – but (key observation for me, not like the science I know) there was no public announcement that this widely known paper was deeply flawed. (Note in passing: the hockey stick graph appeared a number of times[from memory six] in IPPC report AR3 [before MM(2003) but not at all in IPCC AR4 (after MM(2003); no explanation was given for this; until a few weeks ago it was on the Department of Climate Change website).
Another key paper for me was Mann et al (2008), showing another hockey stick. After the extensive criticism of Mann et al(1998) I assumed that this paper would address the issues of data selection and analysis in an unusually rigorous manner. I found quite the opposite. The statistical method had changed (from PCA to multiple linear regression) but the effect was the same: data mining to find hockey stick shaped proxy time series. From this point I have had no doubt that this was blatant fraud, not just a different opinion on a complex issue. From the response from the climate science community (none that I could see) I concluded that the general contempt displayed by Mann et al (1998) was widely shared.
The next case was the Briffa papers recently discussed on climateaudit. Another method (again, data mining), same result: a hockey stick. And now the climategat emails showing that a sigificant group of insiders (the peer-reviewers) knew exactly what was going on.
You say “we” don’t get billions of dollars in grants, which I’m sure is correct. But “they” do (climategate emails: Jones has received 13 million pounds). Read what Joanne has written on this.
I think you are in the position I was in several years ago. Yes, fraud happens in science, but it is unusual and is quicky exposed. Well, that hasn’t happened. Unlikely as it seems, this is a conspiracy of quite alarming proportions.
10
Lionell # 56: You are absolutely correct about the link. I blew that one. Thanks for the correction.
10
Bravo Steven Mcintyre! You have my vote for man if the year.
10
Hi Jo,
Thanks for the detailed feedback. There’s a lot to respond to, but bear with me …
First off, let’s talk about the MWP. I initially responded about the Huang et al. borehole analysis because it seemed interesting and actually seemed to suggest that there really was a MWP (interesting in itself) and that it was warmer than current temperatures (also very interesting, considering the recent debate). This was unlike the claims of data supporting a MWP from CO2science.org, which are pretty horrendously bad (I’d previous seen the original “supporting data” at that site, and was horrified). But since you’re suggesting that by only talking about boreholes I’ve been cherry-picking the data, I guess I’d better cover CO2science.org’s little effort.
The best form of that “map-with-data” I’ve seen is here: http://pages.science-skeptical.de/MWP/MedievalWarmPeriod.html, so I’ll use that in the following discussion. And as a work of art it looks great — all these graphs, all labelled up with a nice “MWP” stamp over a point where the data peaks. One of the problems comes when you start clicking on the data and looking at the timeline under the graphs — the timepoints don’t match up. This difference in time scale is clearly seen between Greenland and England (and was, in fact, one of the points in one of the original papers — see the original http://www.nature.com/nature/journal/v255/n5503/pdf/255024a0.pdf). In fact, there are points labelled as “MWP” from about 500 AD (http://pages.science-skeptical.de/MWP/Rein-2005.html) to about 1500 AD (http://pages.science-skeptical.de/MWP/Khim-2002.html).
What’s worse is when you start noticing that often “MWP” is labelled above not signal, but random noise: e.g.
http://pages.science-skeptical.de/MWP/Zhang-2003.html
http://pages.science-skeptical.de/MWP/Holmgren-2001.html
http://pages.science-skeptical.de/MWP/Khim-2002.html
http://pages.science-skeptical.de/MWP/Linderholm-2005.html
http://pages.science-skeptical.de/MWP/Loso%202008.html
http://pages.science-skeptical.de/MWP/Cook-2009.html
None of this means that there wasn’t a period of slightly increased average warmth around 500 AD to 1500 AD (I find Huang’s work fairly convincing in this regard, given the accuracy constraints of borehole analyses). But this type of “research” presented by CO2science.org is just bad science — a clear case of believing what you want to believe, to the point of citing data which disproves your thesis! (I haven’t looked at the increase of temperatures that they claim yet … that’ll be fun, but I just don’t have the time right now.)
Anyway, as I’ve said before, this is a minor issue and has little bearing on the central issue of potential AGW. So let’s deal with that.
The instrumental record is clearly a major point of contention in your mind. Yes, there are some issues with met station sites (near air conditioners, etc) which may distort the record, and as far as I’m aware these issues are at least partially addressed in climate reconstructions. The first problem with using this argument to throw away *all* instrumental records is that comparisons of urban vs. rural temperature records have fail to show a significant change. The second issue is that the majority of temperature stations are rural, not urban, and probably won’t suffer from these problems (NASA’s GISTEMP data set is based on the recordings of 6257 weather stations, of which 3318 are sited in rural locations). Finally, the greatest problem of all with this argument is that most of the global warming we’ve seen so far has been around the Arctic, and I would imagine that there’d be very little air conditioning going on around the weather stations there! (Just to further discount potential urban heat island effects for this, there are 252 stations above lat. 60N (a conservative latitude for which I’d imagine little air conditioning is happening), of which 212 are rural stations).
(The analysis of GISTEMP stations is based on the listing of stations found here http://data.giss.nasa.gov/gistemp/station_data/station_list.txt and analysed with a simple script I wrote for the purpose. I’m not sure where you get your number of only 1079 stations from. The percentage of these that are airports is also lower, incidentally (GISTEMP doesn’t list airport status next to the stations they’ve used, but from the full GHCN network I get 2289 airports from 7384 stations) — although the assumption that all airport weather stations are going to be blasted by hot plane exhaust fumes doesn’t necessarily follow! And if this really were the case, one would expect to see discrepancies when both an airport station and an urban station operate (I’m not saying that these don’t exist, but rather that these would have been taken into account in the analysis). I think it’s a bit of a stretch to throw away all instrumental data because of these issues! And in any case, proxies such as glacier retreat would seem to back the recent warming temperature record rather strongly … plus there’s the warming of the lower troposphere observed by satellites.)
Moving on … feedbacks. Your willingness to ignore all potential feedbacks and say that everything’s going to be OK (because increasing [CO2] in a system where all feedbacks are nonexistent won’t cause temperature to rise as much) is somewhat paradoxical. I’m really not sure how you get any climate model to give a correct prediction of the last hundred odd years without feedbacks. (And similarly, the fact that climate models do correctly predict our observations with feedbacks in place must cause you some puzzlement!) (I *am* a little surprised by that figure of 1.2 degrees C for doubling [CO2] alone without feedbacks, since I’ve seen larger numbers than this, but to investigate that one I’ll need a bit more time. Interesting, though …)
Now, the “missing hotspot” problem is also interesting. But, as I know you’re aware (because you’ve posted on them elsewhere in your site), there’s been quite a lot of questions raised over the radiosonde data (you can hardly criticise the land-based temperature records and at the same time exonerate the radiosonde data, surely!) and Santer et al 2008’s analysis suggest that there’s no significant inconsistency based on the readings so far. This is, of course, not the equivalent of “finding” the hotspot, but it does mean that all we have at the moment is absence of evidence, not evidence of absence. Coupled with the fact that the lower troposphere is now quite clearly warming based on both major sets of data and the stratosphere is cooling (both predicted in a greenhouse scenario) it seems that the data rather more strongly support a greenhouse effect than deny it.
Given the above (which is actually interesting material) I’m a little disappointed that you then pointed to the Vostok ice core data and the CO2 lag behind temperature. I’m not really sure why this is such an issue, or such a surprise. Obviously CO2 is not the initial forcing for the ice age cycle! There’s other forcings that have caused this cycle — most notably orbital and solar variations. But as the oceans warm in response to this initial forcing, CO2 is released out of solution (as the solubility of a gas in liquid decreases with temperature) and hence the initial lag. Of course, once it comes out of solution, CO2 starts feeding back into the temperature of the planet, and it’s impossible to get the temperature rises that we see in the ice core data without including CO2 feedback. But this has all been discussed (to death!) elsewhere.
Finally, there’s the issue of funding. Your “Climate Money” article (which had very little to do with climate, incidentally) … I’m sorry, but this is where things go completely off the rails. Are you perhaps suggesting that the banks were considering an ETS when Hansen released his seminal 1981 paper? It’s a little difficult to see a link! (and if you’ll excuse me for saying it, the lag of interest in carbon trading behind AGW research is far more meaningful than the lag of [CO2] behind temperature in the ice cores!) It’s also a little odd in that most climate scientists aren’t pushing a cap-and-trade scheme (since it’s wide open to abuse.)
Likewise, considering that plenty of research funds were allocated to climate science by the anti-AGW Bush administration, it’s a little hard to see a link between grants and some grand government agenda. (The reason, of course, is that grant funding is not (yet) controlled by the government of the day, but by panels of scientists. Which is just as well for my own research, since it wouldn’t interest the government one bit!) If government ideology was really behind the climate science funding, you’d think those governments would have been a little more prone to action over the last ten years! And as for climate scientists having “whole PR departments” …!! I’m sorry, but this isn’t being sceptical, this is being paranoid.
10
(Just checking that I can still post — my last (very long) post seems to have gone missing …)
10
Strange, apparently I can post short posts, but not long ones. If there’s any way I can reply to your feedback, Jo, I’d be much obliged.
Cheers,
Owen
10
Owen – your post was caught in spam. There is no predicting how the algorithms in Askimet could have known that. I mean could have made that mistake…
Righto. so you found five papers out of 234 that might represent noise and not signal, and a couple that belong in a different era and possibly shouldn’t have been included.
You’ve provided no studies showing it was cooler during the said MWP, and you think we should take you with credibility when you throw accusations that we only see what we want to see?
Idso has done the job all the corrupt scientists in the IPCC machine should have done.
No I trumped all potential feedbacks, because Lindzen measured actual radiation going off the planet. Unless you’ve got a feedback in space that sends that radiation back to us, you got nothin’.
UFO’s Owen? And you think we are paranoid?
Are you perhaps pulling rabid sentences straight out the air?
Unless you can find radiosondes with their own airports, or airconditioners that were only installed recently, I sure can criticize the land based set vs the weather balloons.
Got any evidence of CO2 amplification in the ice cores? Didn’t think so.
Don’t bother quoting Caillon 2003 – we’ve already done that. He just asserts it happens, with no evidence.
Oh so you think Hansen at NASA doesn’t have a larger PR department than McIntyre at home?
Who are you calling delusional?
We’re still ten steps ahead of you. Yes, we agree there is a greenhouse effect. Read that in my feedbacks post? go read it again.
It’s only one degree. Even the IPCC say that. (Unless you get water vapor feedback – we dont).
20
First time on this site, very nice. I read the exchange between Owen and Joanne with interest, and it’s pretty clear that Owen loses. He appears a bit desperate and silly, and sure does type a lot for not really saying anything of note. Oh, well.
20
Hi Jo,
My examples from the MWP collective were merely that, examples (I haven’t had time to go through the full list, these were simply the first ones I clicked on!) I’m very glad you agree that the ones I’ve quoted disagree with the MWP thesis. However, you seem to have ignored the corollary to this, which is that these are showing cooling when other proxies are showing warming and that therefore the proxy record appears not to show a global MWP on the basis of the argument presented by CO2science.org! (That said, as I mentioned above, there probably was a slight warming between c.500 AD and c.1500 AD and a cooling thereafter. It doesn’t really matter either way.) As for showing you evidence that temperatures are warmer now, well … There’s all the proxy reconstructions that have already been calibrated to the instrumental record (see, for e.g. IPCC AR4 WG1 Chapter 6, Figure 6.10). And I’ve even tried using the work of a group of scientists who you approve of (Huang, Pollack and Shen) who unlike other groups looked at global temperatures using one proxy method in a global context. But when they correlate their data to the instrumental record, you suddenly choose to ignore their findings.
In short, I’m not sure what I can do here. I give you evidence, and yet you ignore it since apparently all evidence contrary to what you believe is ipso facto wrong! Once again, this isn’t scepticism …
As for Lindzen’s 2009 paper on feedbacks (or lack thereof) …! Perhaps it’s worth pointing out that even other “sceptics” have issues with that paper — see, for e.g., Roy Spencer’s comments on it here: http://www.drroyspencer.com/2009/11/some-comments-on-the-lindzen-and-choi-2009-feedback-study/ There’s no need for UFOs, Jo; what there is a need for in the case of Lindzen’s paper is well-conducted science. I think it’s also worth pointing out that considering the enormous body of evidence supporting what we know about climate feedbacks, no single paper could justify sweeping it all aside without extraordinary evidence to the contrary.
As for the ice core data and CO2 feedback, I’m not sure what you’re talking about — there’s plenty of modelling data to support it. It all dates back a bit, though, which may explain why you found it difficult to locate. A good review is in Raynaud et al (1993) Science 259:926-934, esp. pp. 932-3 (You’ll also note in that review from 16 years ago, incidentally, a good discussion of the lag of increasing [CO2] behind increasing temperature and what it means). More recently, there’s been a few papers looking at the specific effects of CO2 feedback in regard to glacial insolation. For example, von Deimling et al (2006) Climate Dynamics 27:149-163. For a different way of looking at the feedback problem, there’s also a rather interesting study by Scheffer et al (2006) Geophys Res Let 33:L10702. (I do agree that IPCC AR4 WG1 Chapter 6 does a lot of claiming in this regard without actually citing specific references, which is unfortunate … but it doesn’t mean the work isn’t there!)
I notice that you haven’t responded to either of my points regarding the number of weather stations used for the GISTEMP reconstructions, or the fact that most warming is observed in the Arctic where air conditioners near weather stations are unlikely to play a role! (I’ve been thinking a bit more about the “dodgy weather station” argument, though, and it occurs to me that if air conditioners had the influence you suggest then observed warming should be limited to summer only, with no warming observed during winter, especially if you first throw out all airport weather stations from the record as potentially biased. I have no idea whether or not this is the case, but it might be worth looking into — if you can prove that you’d actually have a case to throw out the instrumental temperature record! Although I’m not sure how you then account for warming of the lower troposphere and cooling of the stratosphere if the land-based instrumental record is wrong …)
(As regards the radiosonde data, I’m surprised I have to explain the problems with the data set, since they have been well documented for some time. Lanzante et al (2003) J. Climate 16:224-240 has a good summary in the introduction of that paper.)
Finally, I’m not sure why you suggest I’m “pulling rabid sentences out of the air”. If you assume that the driving force behind AGW climate research is a desire by banks for an ETS, then it must surely follow that research in the period of time when science came to a general consensus about AGW (the 1980s) was funded by the banks. On the other hand, if financial interests weren’t influencing grant-funded research, then it hardly impacts on the reliability of the science. I’m sorry, but I simply don’t follow your argument here — and how could the banks possibly influence grant-funded research in any case?
Cheers,
Owen
10
Owen,
You are missing the point about the MWP. The reason it is important is that we have been told countless times that the current temperatures are “unprecedented”. The existence of the MWP completely destroys that claim. It destroys the claim that we are at or near a tipping point, because we would have already tipped in the MWP. If the MWP happened at different times in different places is immaterial. Current conditions have happened before, not unprecedented.
And of course, the Roman warm period …
10
Owen wrote:
What Owen fails to mention is the reason why Santer et al is able to show that the models are “not inconsistant” with the troposphere data: The reason he is able to do this is because there is a very large range of results from these models!
So here is what happens.
Those models which project very little surface warming — and which are thus not in agreement with the current (questionable) surface record — show only a modest amount of tropospheric heating, not too different from the satellite and radiosonde data, and are thus cited as evidence that the models are “not inconsistent” with the troposphere results.
Likewise, those models which project far too much tropospheric warming — and which are thus not in agreement with the tropospheric record — show surface warming similar to the surface record, and are thus cited as evidence that the models are “not inconsistent” with the surface record.
Or to summarize: the models that are not consistent with the surface record are used to claim consistency with the tropospheric record — while the models that are not consistent with the tropospheric record are used to claim consistency with the surface record.
Thus, the great variation in projections from model to model — a variation which ordinarily would cast doubt on the models inasmuch as it is demonstrates that none of them agree with all of the data and, therefore, most MUST be wrong — that great variation instead becomes an asset, for it lets the AGW promoters cite whichever result they need to cover any case that is brought up!
10
“Peer review” is as irrelevant as “consensus” in science. As soon as there are two peer reviewed articles that contradict one another, the fact that they are peer reviewed is shown to be a useless fact. Peer Review is PR – nothing more – and becomes an issue only for those attempting to get away with the logical fallacy of claiming that the source or popularity of an idea is a guide to its validity. To even mention peer review is anti-science. Peer review is the politics of acadamia. It is epistemological silliness.
10
“We present a suite of new 20,000 year reconstructions that integrate the information in the heat flux database, the T-z database, and the 20th century instrumental record of temperature, all referenced to the 1961–1990 mean of the instrumental record.”
This statement bothers me. We see now that the instrumental data has been “fudged” yet we are supposed to accept the changes they made to their work as solid?
10
Davidc, I think I see your point about the MWP temperatures and tipping points. You’re saying, in other words, that if the MWP was warmer than current temperatures it’s unlikely that melting ice-sheets, etc, will be significant since we got past this temperature before in the past with no long-term ill-effects. And fair enough if so (although if we continue to increase the temperature past a putative MWP warm point, all bets are off …) But the problem I have with the CO2Science.org study is that it’s riddled with proxy data which don’t seem to support a global MWP thesis, and I don’t think it really helps your cause.
What I’d like to see is a calibrated overlaid graph of all those proxy data, so it’s possible to see a consensus (just as the IPCC AR4 WG1 Chap 6 did). It’s very easy to slap “MWP” over a high point in a graph; it’s another thing entirely to demonstrate that those high points overlap and that this overlap is signal, not noise.
I did try to overlay the graph images from the proxies above, but it got very messy and calibration is difficult. (I got up to an overlay of 34 randomly selected proxies before I gave up — there’s different scales, different measurements (not all are in degrees C) and working out the baseline for each graph isn’t trivial since they often use different ones). Eye-balling the partial result, there does seem to be a rise of 0.5 to maybe 1 degree C from about 0 AD to 1500 AD, with cooling from then until around 1800 AD, from whence it starts to rise again to about the level of the MWP high point. Noise levels are high, though (as you’d expect with proxies).
I think there’s definitely evidence to support a broad MWP at temperatures maybe as high as the middle of last century. I just don’t think there’s the evidence at this time to support the notion that the MWP was warmer than the present (and the evidence that does exist is more against than for).
10
Michael, I think that’s somewhat true about Santer et al 2008 and model variation. It’s worth noting, though, that Santer et al 2008 used the same modelling runs that Douglass et al 2007 (the paper they were rebutting) used, and the reason these model data were picked in the first place was because they were a set of modelling simulations conducted for the IPCC (using various models/parameters). If there’s variation in the modelling results then it’s best to consider it when judging the efficacy of those models to predict climate.
Despite this, if you look at Figure 6 from Santer et al 2008, it’s pretty clear that there’s an even greater variation in the radiosonde datasets than in the models (with data points falling on both sides of the expected modelling trend, with the exception of the very lower troposphere).
Whatever’s going on in the tropical troposphere, I don’t think at this point we can call it either way.
10
Owen;
“Whatever’s going on in the tropical troposphere, I don’t think at this point we can call it either way.”
This is not some academic disagreement about some minor aspect of atmospheric pysics. What’s at stake is our whole way of life. Just a few days ago Stearn was renewing his call for a 90% cut in emissions. This is not a few cents extra on a litre of petrol, or a few dollars a week on your electricity bill. It means that almost everything you currently take for granted will be unavailable.
The pathetic political debate we have had up to now has obscured the consequences of proposals such as CPRS. The general drift of this scheme is to give exemptions to nearly everybody and give back up to 120& of the extra charges to “poor” people (ie people earning less than $160k!). So the scheme that has just failed in the Senate involves essentially 0% emissions. This was the scheme costed by Treasury at 1% GDP (sounds about the right level to cover the cost of collecting the money and redistributing it) So why are they bothering. As Wong says, we need a “framework” in place to allow future action. All that would be needed would be to remove the exemptions and the handbacks and you’ve got a real scheme. Depending on how the final bill is drafted, those changes could be dealt with as “regulations” and don’t need to go back to parliament. I understand that the Senate has some review powers, but Green balance of power in the Senate will overcome that.
Given that so much is at stake it should be the case that the evidence in support of the underlying science should be compelling. Not merely plausible and not as you put it “we can call it either way.”
As far as I can see there is simply no serious evidence in support of significant AGW caused by CO2.
10
Grennland. See:http://sites.google.com/site/earthquakepredictionbyjac/Home/greenhouse-effect/SUN-EARTH.Energy.Greenhouseeffect-fiction3.Greenland.pdf?attredirects=0&d=1
Greenhouseeffect-fiction.
This is theoretical model.
10
Hi Joanne,
I have a question.
Let’s agree that most attempts to actually measure temperature for 1000 years ago are fraught with all sorts of difficulties. On the other hand, the historical evidence for a MWP in Europe is incontrovertible, and compelling.
So I’d like to know, if there was a world-wide MWP, as we seem to believe, why isn’t there similarly historical, written evidence of it, in China, in the Middle East, in Egypt, and so on, in the other countries that were writing stuff at 1000AD? Why isn’t there archaeological evidence of it at sites where there were people, but no writing? (Or is there?)
Thanks,
Alex
10
Good question. I’d like to know if there is. Do you have time to look for it? I suspect that no one has pursued it. (No grants for searching through egyptian archives to prove that they had an MWP.)
It would be interesting to know.
10
first time visitor, and really impressed – and great to see very little juvenile ‘name-calling’ (I get really bored of the comments like ‘taking us back to the 19th Century, because they are unfounded, baseless and unscientific).
I’m neither pro nor sceptic because I’ve read lots from both sides and see both often arguing their own points often without truly understanding the other’s frame of reference (‘one sees it as red, the other cherry’). I believe our pre-occupation with climate change is a red-herring, albeit one with a potentially valuable outcome if a move towards pCO2 reduction and mitigation comes to pass: I don’t see how the planet can cope with 6bn people (ignoring the equally spurious models of population increase) all trying to live like so-called developed nations. The answer to dealing with climate change is properly sustainable development.
We are destroying the planet’s natural resources in the relentless pursuit of growth, GDP and so-called standard of living. And at the same time increasing the divide between rich and poor. Standard is not the same as well-being: we don’t need high-def tvs, new cars, etc.; and many of the people I’ve worked with in the so-called ‘developing nations’ are happier than many of us (not chasing their watches for money to spend on throw-away products with limited shelf-life in the pursuit of happiness).
Let them get on with the debates in Copenhagen – and of course i understand the importnce of integrity of science – if AGW is proven in time to be a nonsense then so be it, if it isn’t then we still win. The result will still be based around measures which make the developed nations more environmentally-friendly in their ecomonic demands and the ‘poorer’ nations more capable (or required) to protect their natural resources. And this is not a call to go back to the 19th century!
10
Hi Joanne, you really think no one has pursued it…? A bit of quick googling, http://www.springerlink.com/content/gh98230822m7g01l/, “During the last 1000 years, the thirteenth-century boundary was the northernmost. This indicates that this was the warmest time in that period. On the basis of knowledge of the climatic conditions required for planting these species [Boehmeria nivea], it can be estimated that the annual mean temperature in south Henan Province in the thirteenth century was 0.9–1.0°C higher than at present.” There must be tons of evidence if it was real…
10
[…] […]
10
Davidc: I’m now feeling ashamed of myself for trying to talk about the tropical troposphere rationally as a point of academic interest. Let me put it in context: whilst we don’t know what’s happening for certain in the tropical upper troposphere, our best guess supports AGW modelling.
Have a look at fig. 6 in Santer et al 2008 — you’ll see that there’s a broad spread of radiosonde measurements, but the majority show clear warming and are in line with the models. It is impossible to suggest, on the basis of the evidence we have, that the tropical upper troposphere climate disproves AGW theory.
Now, despite this, if the temperature change in the tropical toposphere were the only evidence for or against AGW theory I’d understand your hesitancy. Thankfully, though, it’s just one tiny aspect of a much greater body of data. Let’s list some of the reasons why we know with extremely high probability that AGW is occurring:
* There is a “natural” greenhouse effect, without which our planet would be more than 30 degrees cooler (we can work this out with theoretical physics). This effect is caused by greenhouse gasses (GHGs) in the atmosphere absorbing and re-emitting radiation, which we have demonstrated by looking at absorption spectra from space.
* Human activity is causing the concentration of GHGs such as CO2, CH4, etc, to increase.
* Through a massive volume of research we know with certainty that increasing the concentration of these GHGs will warm the planet.
* From modelling past and current climate events, we know that feedbacks are present in the system and further contribute to the warming.
* Data from land-based weather stations, satellite measurements of sea surface temperatures and satellite measurements of the lower troposphere all show that the planet is warming. This warming is to the degree predicted by modelling (with all feedbacks in place). By way of corollary, satellite measurements also show that the stratosphere is cooling (also predicted in a forced greenhouse situation).
* Current proxies of temperature, such as glacier retreat, ice sheet melting, sea ice extent in the Arctic, all confirm warming is occurring.
In short, our experimental observations confirm the theoretical predictions. The fact that we do not have sound data from the tropical upper troposphere is neither here nor there — the data that we have from there certainly do not disprove AGW, and the volume of data from every other means all suggest that AGW is occurring. If all of this isn’t “compelling” evidence that the world is warming through human activity, then I really don’t know what is!
(Incidentally, I agree that Australia’s CPRS in particular, and ETSes in general, are a very poor solution to the problem. A much better solution is the carbon tax suggestion, in which all major GHG emitters are charged a carbon tax, which is then given directly to the population. Everyone still has the money to live the way they always have (since everyone has extra money to pay for the price rises), but people’s natural resistance to paying more for the same thing — combined with environmentally-friendly alternatives that pay no tax and are therefore cheaper — solves the problem with little inconvenience to anyone.)
10
Are you angry about this obvious fraud and the national media’s complicity in the cover-up, misinformation, reframing and misdirection of the issue? Take responsibility and take action. STOP all donations to the political party(s) responsible for this fraud. STOP donations to all environmental groups which funded this Global Warming propaganda campaign with our money, especially The Environmental Defense Fund. They have violated the public trust. KEEP donations local, close to home. MAKE donations to Oklahoma’s Senator Inhofe, the only politician to stand firmly against this obvious government/media coordinated information operation (propaganda) targeted at its own people. People that government leaders and employees are sworn to protect. WRITE your state and federal representatives demanding wall to wall investigations of government sponsored funding and coordination of this and related propaganda campaigns and demand indictments of those responsible. WRITE your state and federal Attorneys General demanding Al Gore and others conducting Global Warming/Climate Change racketeering and mail fraud operations be brought to justice, indicted, tried, convicted and jailed. Carbon is the stuff of life. He (Obama) who controls carbon, especially CO2, controls the world. Think of the consequences if you do nothing! For one, the UK is becoming the poster child for George Orwell’s “1984” and the US government’s sponsorship of this worldwide Global Warming propaganda campaign puts it in a class with the failed Soviet Union’s relentless violation of the basic human right to truthful government generated information. Given ClimateGate’s burgeoning revelations of outrageous government misconduct and massive covert misinformation, what are the chances that this Administration’s National Health Care sales campaign is anywhere near the truth?.
http://www.youtube.com/watch?v=6bdneX1djD0
10
Owen,
My BS meter is way over in the red zone again. But you do at least understand the mechanism by which so-called greenhouse gasses help to keep us warmer than we would otherwise be. One out of 6 ain’t too bad. Your other points are unsupportable. You simply accept what AGW theory says as a given.
But pay no attention to me; I’m just a poor dumb old computer programmer. And of course, an education in basic math, physics, chemistry and the scientific method of investigation count for nothing. Neither does 6 years of careful study of both sides of this non debate count for anything.
So all I can do is point out what others much more qualified than little ol’ me have been saying for years — and saying very convincingly. Then I’ll ask the million dollar question again — where is the evidence that CO2 is doing or even can do what you claim?
10
John Jauregui,
You omitted the UN which is at the top of the pyramid pulling the strings that ultimately move all the rest. The great travesty here is that we pay 25% of the UN’s annual budget every blasted year. So we are enablers of this nonsense on a global scale.
We should not only demand the heads of the players you mention, but demand that we get out of the UN.
10
[…] Medieval warm period Wait… were confused according to man made global warming isn’t it impossible for it to be cooler when less carbon dioxide was polluting the air from factories and cars and electrical appliances, maybe you should read this article […]
10
Google “carbon derivatives”. Interesting insight here. First it was ClimateGate, then NASAgate now it may be “carbon derivativesGate”. It’s like tracking terrorists, follow the money.
10
Carbon DerivativesGate is coming. Google: carbon derivatives …and follow the money
10
1. Cold War
2.Greenhouse effect
3. WHAT’S NEXT?
10
[…] They attack Christopher Monckton’s paper, not because they can summarize why it was in error, but because another group disagree, and there are some technicalities of whether it jumped through the right hoops to be called “peer review.” Attack the man and not the message eh? New Scientist stands up for the bureaucratic details of “peer review” (only some peers count), but they won’t stand up for the independent scientists, the whistleblowers who want access to data, just to check those “peer reviewed papers” didn’t turn out to be baseless frauds like the Hockey Stick. […]
10
[…] are today. This is, not to put too fine a point on it, a complete, bald-faced lie. As pointed out elsewhere, the same kinds of data that are used to support the claims of recent warming also show that the […]
10
CO2 Forecast- SEE:http://docs.google.com/viewer?a=v&pid=sites&srcid=ZGVmYXVsdGRvbWFpbnxlYXJ0aHF1YWtlcHJlZGljdGlvbmJ5amFjfGd4OjJjMWIxODBiMmRmMjFiZTk
and
http://sites.google.com/site/earthquakepredictionbyjac/Home/greenhouse-effect
10
They actually produced a third hockey-stick graph with samples taken from from mud in an Finnish lake. The Finnish TV-producer MOT has made an interesting movie about that. The graph has been shown at Copenhagen. The Finnish scientists were quite amazed. The IPPC graph was upside down.
Link to the movie: http://dotsub.com/view/19f9c335-b023-4a40-9453-a98477314bf2
10
Joanne (Response to post 75):
I believe someone has looked at the MWP from a global perspective and found ample evidence of it throughout the northern hemisphere. The link is below:
http://www.stanford.edu/~moore/Boon_To_Man.html
10
In the wake of the exoneration of Michael Mann by the Penn State enquiry
will you now apologize to Michael Mann for calling his hockey-stick “fraudulent”.
You are a disgrace to publish unsubstantiated allegations such as that.
10
Milankovitch,
Mann’s hockey stick was demolished by others, not by Joanne. And it’s not at all clear that Dr. Mann is exonerated just yet. He still faces what looks like a pretty serious charge that he violated the professional standards that he was expected to uphold at all times.
That Penn State could not get a handle on the fact that the hockey stick was based on doctored up data is very troubling. But the debunking of the thing is sound and has withstood a lot of criticism and outright attack.
I think Mann is not out of the woods just yet and you’re a bit premature.
10
Exonerated? What a joke! You call a whitewash “investigation” exoneration? They didn’t bother to question a single person from the skeptical side. It was clear that it was a whitewash from the start. The Pennsylvania legislature took note and will likely initiate their own investigation.
He’s not exonerated by a long shot.
20
Yes I will…
“I’m sorry Mr Mann for calling you a liar and a fraud. As recompense, may I offer you this 5×3 and your personal guard Big Bubba who will keep you safe under his “WING” every night, 2 or 3 times a night. Again, please accept my apologies and enjoy your new castle.”
10
Milankovitch:
February 7th, 2010 at 1:42 pm
I wrote this for you Milankovitch.
Rated R 18+
.
.
There was a proff named MANN,
Who was part of a devious CLANN.
He wiped out with GLEE,
The L.I.A and M.W.PEE.
But two Kanaks said “hey W.T.F”?
You can drive thru this a TRUCK.
Hence the infamous Hockey STICK,
Was busted by McIntyre and McINTRICK.
Now waits the Mann from PENN,
To do time in the State PENN.
There he will do new TRICKS,
With his cell mates …s. 🙂
10
Actually, there was no “consensus” on the Martian canals. Each observer that saw them (not “many”) drew different maps, and many observers didn’t see them at all. The maps were published, yes, but as personal observation.
Nor did it take “the first close up photos of Mars” to do them in. They were 1st seen in 1877, by 1894 there were serious doubts, and by 1909 they were falling out of favor. This was due to telescopic & spectroscopic observations from right here on Earth.
10
[…] they will be inconvenienced, the world would be a lot better off. I see your links and raise you this one. Experts looking for the same results peer reviewing data is not the scientific process. A theory […]
10
And the question remains, what will come back from that?
10
[…] combien le problème des falsifications était profond. Je ne copie colle que deux graphes, mais l’article de J. Nova en donne bien […]
10
I wonder why the ABC didn’t report this fraud?
10
[…] it seems hard to believe. Then again, the same team didn’t ask any hard questions when one study overturned hundreds of other studies that showed it was warmer 1000 years ago, they are the people who think it’s ok to hide […]
10
[…] data from 1960 forward … and then spliced on actual temperature data” | Deep Climate Fraudulent hockey sticks and hidden data « JoNova Richard Littlemore | A Review of Michael Mann's Exoneration Bluegrass Pundit: Mann's 'Hockey […]
10
LOl @ use of the Wegman Report!!
10
If only CO2Science could decide when the MWP was instead of moving their timeline around to fit the data.
10
Hi, This is a question I cannot get answered anywhere. On page 539 of the new Maquarie Encyclopedic Dictionary at the bottom right hand side it states ‘The natural greenhouse effect is thereby magnified leading to global warming” Could you tell me if this is true. I do not believe it. No one not even Wiltshire on 2gb has any idea. Are we being corrupted now by well known pulications or have I read this wrong. Please could you try to answer this question. Thank You John
10
[…] be completely false. He had no data to support his claims – he just made it up. Like the hockey stick, and ‘hide the […]
10
[…] which ‘facts’ to include and which to not include. Take a look at this excellent article that shows exactly what I mean. Then consider what it means. It means quite simply that […]
10
[…] the evidence began rolling in showing how the assumptions were wrong, the graphs were flawed, the thermometers were biased, and the “expert” scientists were behaving badly — who […]
10
[…] the evidence began rolling in showing how the assumptions were wrong, the graphs were flawed, the thermometers were biased, and the “expert” scientists were behaving badly — who exactly […]
10
[…] out this is just Tibet, not a global average. True. But the results agree reasonably well with hundreds of other studies from all around the world (from Medieval times, Roman times, the Greenland cores). Why can’t we do […]
10
[…] But the results agree reasonably well with hundreds of other studies from all around the world […]
10
[…] out this is just Tibet, not a global average. True. But the results agree reasonably well with hundreds of other studies from all around the world (from Midieval times, Roman times, the Greenland cores). Why can’t […]
10
[…] […]
11
…b…b….but
I was told that the Mannian “Hockey Stick” has been massively confirmed (sarcasm alert):
AGU blog by Dan Satterfield says this about the Hockey Stick today:
“…You may have heard about this image, it’s called the “Hockey Stick”, and let me say right here, that no matter what you may read on the internet, this image has stood the test of dozens of reviews and investigations. Every scientific peer group that has looked at it says it’s good science and if anyone tells you differently, they are giving you political propaganda.
To put it in plain words- the graph is correct, get over it.”
[his emphasis]
10
[…] Michael Mann apologists appear not to understand the issue. A brief summary of the historic background is thus helpful. Mann’s hockey stick graph first appeared to worldwide fanfare in 2001. It was a proxy (tree ring) reconstruction of past climates (proxies are used because thermometer records only go back 150 years). The controversy over Mann’s hockey stick graph is less a climatology question, but more a question of plain, black and white statistical analysis. Thus any claim that only climatologists are “qualified” to weigh the matter is bogus.JoNova has an excellent article addressing the basics of Mann’s original deception here. […]
10
According to the website (which you have banned linking to) CO2Science does not perform adequate science.
They then go on to demonstrate many examples of where CO2Science incorrectly label the MWP.
Can you justify why they do this?
20
James, you may wish I had banned itsnotnova, but there are many references or links to it in comments. CO2science lists hundreds of papers supporting the MWP. If someone found a few oddities, it hardly disputes the existence of the MWP. Co2science was only trying to get a Yes or No answer to the broad questions about whether the MWP was global. They succeeded. Since then bigger better proxies have supported the general conclusion.
11
CO2Science lists hundreds of papers, that is not the issue. As explained by itsnotnova, and others the problem is with their method.
This is a beautiful simple example of why the method is flawed.
http://itsnotnova.files.wordpress.com/2012/08/bad-analysis.png
As for your “bigger better proxies”, that’s still not answering the CO2Science question and from the reading some of the comments, it appears they don’t really support a warmer MWP either. You need to update the HP graph above as your claim that the boreholes show it was warmer is incorrect. You still have the old incorrect Loehle graph. Putting a dashed line at about the 1935 mark does not make this “right”.
20
James, this is a very old post, I’m not going to delete graphs now that have displayed and discussed there. I’ve added the new graph so readers can compare them. They will see that there isn’t much difference, and that the curves in the graph are nothing like the hockeystick graphs that this post is about. The first graph is also marked “corrected”. Loehle 2008 noted in the abstract that the corrections “made little difference”. This is nitpicking.
Where is the updated HP graph? As far as I know they have never corrected it? The 2008 study they did, used different data and different methods. I informed readers about the newer HP paper as soon as I knew there was one, and furthermore I explained why I didn’t find that graph convincing. Even the newer HP graph still shows the large pronounced curves that were hidden with the hockeystick.
The point of this post was to show that the hockeystick graphs are misleading because they don’t represent the masses of data out there. The MBH97 paper should not have passed publication. The IPCC should not have picked them up and held them over all other studies. The Idso compilation is limited in some ways, but it’s supported by the curves in the boreholes and the Loehle study and the recent Ljundqvist 2012 study which I’ve discussed recently. If Idso produced a spurious result and things were significantly globally cooler in the MWP it would be obvious from comparing it to studies like Loehle and Ljudqvist.
None of your points materially changes the central conclusion that the hockey stick graphs were horribly flawed, bad science, that did not represent the last millenia.
10
I don’t accept the “it’s old” argument.
With regards to Gergis, you’ve written “Perhaps commenters could get in touch with the news organisations and bloggers above and encourage them to correct the record? No doubt they will be racing to make sure Australians are not misinformed, or overly alarmed without reason.”
I agree it doesn’t make “much” difference, however it was enough to change Loehle’s wording from “the MWP being approximately 0.3°C warmer than 20th century values at these eighteen sites” to “The warmest tridecade of the MWP was warmer than the most recent tridecade, but not significantly so.”. The tridecade being from 1978 to 2006, not actually today’s temps.
As for the HP97 graph, it was never released with the words “Boreholes show it was warmer 700 years ago”.
Huang did explain the reason why your above graph is misleading – it doesn’t contain the data necessary to compare against today.
But you claim they did it because they are “group thinking” or want to bemore like other IPCC representations. If so, then you would be able to prove this by linking to the data they use and show how they are incorrect. You haven’t done that.
Christiansen & Ljungqvist say: “The level of warmth during the peak of the MWP in the second half of the 10th century, equalling or slightly exceeding the mid-20th century warming, is in agreement with the results from other more recent large-scale multi-proxy temperature reconstructions by Moberg et al. (2005), Mann et al. (2008, 2009), Ljungqvist (2010), and Ljungqvist et al. (2012).”
Ljungqvist agrees with Mann (and others) that the MWP was about the same as the 1950’s.
So yes I agree that there was a MWP, even Mann 2008 shows that. I don’t not agree that Co2science can show it was warmer than today, nor do the others if you look at them carefully enough.
People rely on good information to make decisions about what to do on climate. I think you should be responsible and correct your posts, just as I would want those citing Gergis to correct theirs.
50
Your graph of Huang and Pollack is not actually from their paper. The version you currently have is deceptively wrong.
42
[…] and FOI uncovered. If you are still in any doubt, review maps and graphs from Jo Nova’s Fraudulent hockey sticks and hidden data that make it clear ‘just how brazen the Hockey Stick fraud […]
10
[…] and FOI uncovered. If you are still in any doubt, review maps and graphs from Jo Nova’s Fraudulent hockey sticks and hidden data that make it clear ‘just how brazen the Hockey Stick fraud […]
10
[…] and FOI uncovered. If you are still in any doubt, review maps and graphs from Jo Nova’s Fraudulent hockey sticks and hidden data that make it clear ‘just how brazen the Hockey Stick fraud […]
10
[…] to make sure the latest data makes the past cooler and the present warmer, consistent with the ‘Hockey-Stick’ […]
11