Recent Posts
-
Lucky us, The UN deigns to not list the Great Barrier Reef as ‘in danger’ (yet again)
-
Wednesday
-
Blackouts and maintenance problems hit farmers forced onto solar and batteries in Western Australia
-
Tuesday
-
Monday
-
Sunday
-
One Nation are now the Party of the workers, and Labor the party of wealth and academics
-
Saturday
-
Net Zero anyone? USA bets big on coal and gas — overtakes China in spending.
-
Friday
-
Winning: Trump persuades The World Bank to drop its huge spending target on “climate”
-
Thursday
-
Bafflement?! Germany, a global leader in renewables but has one of the highest EU electricity prices
-
Wednesday
-
Horse-drawn carriages must have caused a Megadrought in Europe in 1540, right?
-
Tuesday
-
Monday
-
Sunday
-
UK facing devastating 36 degree heat — can’t decide whether to use air conditioners or rip them out
-
Saturday
-
Batteries failed on day One: A four day wind drought in South Australia wreaks havoc, high prices
-
Friday
-
The UN wants to be One World Government and it starts with a carbon tax on ships and planes
-
Thursday
-
What if Global Warming was just because something made the clouds go away…
-
Wednesday
-
Snowy 2.0 is the Trillion dollar Black Hole of Australia — sucking in energy, money, land, industrial relations, the dollar, our lifestyle
-
Tuesday
-
Monday
-
Winter Solstice
-
Saturday
-
We were throwing-renewable-energy away at record levels in 2025
-
Friday
-
Pauline Hanson, the centrist, just wants a free market in electricity, and an end to the renewable energy bribery
-
Thursday
-
Blame the Climate Yeti again for making your life more expensive! (It’s a smokescreen)
-
Wednesday
-
The Sunrise Project funneled $343 million from overseas to push net zero
-
Tuesday
-
Monday
-
Sunday
-
The US government has been secretly funding 120 dangerous biolabs around the world
-
Saturday
-
New report shows renewables are a drag on our national productivity
-
Friday
-
Thursday
-
Well, how convenient. AI data centers have arrived to be the fall guy for the Energy Minister
-
Wednesday
-
Billionaires are leaving the room with excuses — Bezos says “AI will solve climate crisis”
-
Tuesday
-
Monday
-
Sunday
|
Almost all the coverage of the Muller and BEST results confounds three different points, is poorly researched and mixes up cause and effect. Richard Muller is shamelessly promoting himself as something he is not, and his conclusions are nonsense on stilts that defy rational explanation.
Everyone knows hot air rises off concrete, yet scores of people get befuddled by statistics. The maths-talk is irrelevant. If your analysis tells you that thermometers next to combustion engines and industrial exhaust vents is recording global warming — your analysis is bunk, and we don’t need a peer reviewed paper to say so.
Muller’s three claims:

- He’s a converted skeptic. (Naked, demonstrably wrong, PR.)
- The world has warmed by 0.3C/decade. (He’s half right — he’s only exaggerating 100%.)
- That it’s mostly due to man-made emissions. (Baseless speculation.)
As far as public policies go the only point that matters is 3, but most of the conversation is about 1 and 2. Worse, most journalists and many so-called scientists think evidence for warming is the same as evidence that coal fired power stations did it. How unscientific.
We need to deal with each claim separately.
1. He’s a converted skeptic. No he’s a dishonest alarmist.
Thanks to PopTech for compiling the “Truth on Muller”.
No skeptic I’ve met said that “… carbon dioxide from burning of fossil fuels will prove to be the greatest pollutant of human history. It is likely to have severe and detrimental effects on global climate.” (Richard Muller, 2003). So perhaps he became a skeptic later? Not so much. Richard Muller, 2008: “There is a consensus that global warming is real. …it’s going to get much, much worse.”
The defining mark of a skeptic is that they never believe simply because there is a “consensus”.
That Muller allows himself to be referred to as a skeptic in publication after publication says it all really. He’s not concerned about accuracy, he’s in this for the PR. We can’t trust the man on anything. If he’ll lie to save the planet, he’ll lie to save the planet. Enough said. I have no respect for him.*
UPDATE: See my new post on how Impartial his daughter and co-founder of BEST is: Elizabeth Muller (Director of BEST) ran a “Green government” consultancy.
2. The world has warmed by 0.3°C/decade. “Half right”.
Keep reading →
9.3 out of 10 based on 83 ratings
It’s all up on Watts Up now.
What Anthony Watts and Evan Jones have revealed is breathtaking.

[Art thanks to: Cartoons by Josh]
This new pre-print paper by Anthony Watts accomplishes so much. Assuming that no major problems are found, the pieces of the jigsaw fit and pass the common sense test. Yes, hot air rises off concrete.
- There goes half the warming trend. The most accurate thermometers in the right places are not recording high trends. High estimates come from combining good records with poor ones then adjusting that up.
- They show Muller and BEST’s latest exaggerated claims of 1.5C are meaningless.
- They show that only class 1 and 2 stations (which are placed well, not next to concrete, car-parks, or air-conditioners) give reliable data and the warming trend from these stations is much lower than the warming trend from Class 3, 4 or 5 stations. It’s what we always knew — thermometers near artificial heat sources are measuring artificial warming, but it’s not the global kind.
- Mueller, BEST, GISS, Hadley and all the others should have removed the data from poor stations entirely. No amount of statistical chicanery can correct the artificial warming effect no matter how you adjust, blend, or homogenize the data.
- Worse, the adjusted data shows an even warmer trend than the warmest and worst stations. That casts a very dark shadow indeed. How honest or impartial are the scientists who adjust data from stations with thermometers near air-conditioners and create more warming? Bad stations have been adjusted up, instead of down, and then the good stations were adjusted up to match the now-really-awful-bad ones. The stench of failure and a lack of dedication to the truth in on show…
You don’t need a PhD to know that thermometers placed in car parks are not measuring global warming.
Only gullible fans of authority would believe the incredulous claim that statistics can correct for gross mismeasurements. Unless those researchers had details about when air-conditioners went on and off, when concrete was laid, relaid, changed to asphalt, when cars parked nearby, and how windspeed affected that warming on an hourly basis — they can’t correct for the errors introduced by those things. They don’t have that data, and even if they did it would be exceedingly unlikely it would be sufficient to extract the signal of regional warming from the noise of the artificial heat sources around the thermometer. It would be a whole PhD thesis just to accurately account for a single surface station, and that’s if they had the data on that minutae, and we know they don’t.
This is a paper that will be quoted and requoted. It’s five years worth of work, unpaid, done late at night, entirely redone in the last year. We all owe Anthony Watts and Evan Jones, plus Steve McIntyre and John Christie, plus many others (like all the volunteers who did site-surveys) more than a huge thank you. Watts has taken on giant institutes like NOAA, GISS, Hadley, East Anglia, they with billions at their disposal – and he’s won. Sure, this won’t be the last word on it, but where are the real climate scientists who say enough is enough and they want junk thermometer records deleted from “high quality” compilations and they want adjustments for artificial warming to cool the result, not exacerbate the error?
There’s a newer method to categorize stations into five classes and this makes all the difference.
Leroy’s 1999 classification system is out and Leroy 2010 is in. Menne 2010 and Muller et al 2012 both used the old system. Anthony Watts uses the new system and says it makes all the difference:
“Using the new Leroy 2010 classification system on the older siting metadata used by Fall et al. (2011), Menne et al. (2010), and Muller et al. (2012), yields dramatically different results.”
 The new Leroy 2010 classification system of surface weather stations shows that only 20% of stations are adequate (Class 1 plus Class 2). The trends as recorded by good thermometers are very different to the trends recorded by the bad ones. Class 1 & 2 show only 0.15C warming per decade (which is slightly less than what happened in the 1870’s). Class 3 – 5 (the badly sited thermometers) recorded 0.25C per decade. There goes nearly half of all the catastrophic warming. Worse though, is the miracle of modern adjistering – where two lower numbers are “averaged” up to an even higher one. Post-normal maths?
The new official adjusted result bears no resemblance to the observations. Why bother having thermometers?
..
 Figure 19 – Comparisons of regions and gridded values for all CONUS compliant stations, all CONUS non-compliant stations, and final USHCNv2 adjusted CONUS data Airports can make even a good thermometer useless
On a micrositing level some airport stations may appear to be ok. But on a mesositing level they affect the results, rather a lot and since about half of global stations are based at airports this is rather a killer point. Airports are excluded from this graph below. Compare it to the graph below that. The blue bars are the trends in the mean temperature for the best thermometers (class 1 & 2) in different US regions. The yellow bars are the class 3 – 5 stations — the badly sited ones — and obviously they are higher.
Ominously, the red bars are the adjusted combination of the two lower bars. Its what happens when you mix good data with bad data and then multiply the errors with statistics. It’s possible to turn out truly awful “results”.
 Figure 5 – Station Class comparisons of decadal trends by region with airport stations excluded …
When airports are included the raw readings in the well sited thermometers are much higher (below). The pilots all need to know the temperature of the airport, but as far as taxpayers are concerned, the airport does not represent the environment of the surrounding 100km (or 1200km give or take the smoothing techniques you care to use).
Keep reading →
9.1 out of 10 based on 120 ratings
What Anthony Watts and Evan Jones have revealed is breathtaking, a must see. Half of the warming trend has gone. 92% of the artificial rise was due to” erroneous adjustments of well sited stations”. Muller et al used an older siting classification system. The new classification system shows that siting does have a major impact on the data.
We always knew thermometers were never meant to be stuck next to air-conditioners. Now we know they shouldn’t be recording global warming near airports either.
[Art thanks to: Cartoons by Josh]
Go and Visit Watts Up and enjoy!
I’ll be posting my own analysis with graphs and information soon.
This is one of those blockbuster moments when the pieces come together. For Anthony it’s five years work, and overturns so many studies all at once. This graph rather sums it all up. Raw well placed thermometers recorded 0.15C per decade. Badly sited thermometers recorded 0.25C, and adjusted ones recorded 0.3C! Fully twice the warming trend.
 Figure 19 – Comparisons of regions and gridded values for all CONUS compliant stations, all CONUS non-compliant stations, and final USHCNv2 adjusted CONUS data —————————————————-
PRESS RELEASE – July 29th, 2012 12PM PDT – FOR IMMEDIATE RELEASE
A reanalysis of U.S. surface station temperatures has been performed using the recently WMO-approved Siting Classification System devised by METEO-France’s Michel Leroy. The new siting classification more accurately characterizes the quality of the location in terms of monitoring long-term spatially representative surface temperature trends. The new analysis demonstrates that reported 1979-2008 U.S. temperature trends are spuriously doubled, with 92% of that over-estimation resulting from erroneous NOAA adjustments of well-sited stations upward. The paper is the first to use the updated siting system which addresses USHCN siting issues and data adjustments.
Keep reading →
9.3 out of 10 based on 87 ratings
Müller lite: Why Every Scientist Needs a Classical Training
By Christopher Monckton of Brenchley
About 18 months ago, as soon as I heard of Dr. Richard Müller’s Berkeley Earth Temperature project, I sent an email to several skeptical scientists drawing their attention to his statement that he considered his team’s attempt to verify how much “global warming” had occurred since 1750 to be one of the most important pieces of research ever to be conducted in the history of science. This sounded too much like propaganda.
“…from 1695 – 1735 Central England warmed seven times faster than what Muller finds in the 262 years during which we are supposed to have influenced the weather.”
He was posing, I said, as a skeptical scientist; his results would broadly confirm the pre-existing temperature series; when his research ended, he would declare himself to have been converted from scepticism to the belief that merely because the world had warmed the warming must be our fault; and publication of his results would be exploited as a triumphant and final confirmation of the “global warming” orthodoxy.
 My doubts about Dr. Müller’s motivation intensified after I met him at the Los Alamos Climate Conference in Santa Fe, New Mexico, late last year. We lunched. He was visibly disappointed when I said that I was happy to accept the official temperature record, at least for the sake of argument. And he subsequently seemed uninterested in getting to grips with the real divide between skeptics and true-believers, which has little to do with the accuracy of the temperature record and much to do with climate sensitivity – the question how much warming we will cause. My doubts about Dr. Müller’s motivation intensified after I met him at the Los Alamos Climate Conference in Santa Fe, New Mexico, late last year. We lunched. He was visibly disappointed when I said that I was happy to accept the official temperature record, at least for the sake of argument. And he subsequently seemed uninterested in getting to grips with the real divide between skeptics and true-believers, which has little to do with the accuracy of the temperature record and much to do with climate sensitivity – the question how much warming we will cause.
In this reply to Dr. Müller’s much-touted editorials in the New York Times and the San Francisco Chronicle, I shall demonstrate by Classical methods that his principal conclusion “that global warming is real, that the prior estimates of the rate were correct, and that the cause is human” is incorrect a priori.
Yes, the world has warmed since 1750. However, even if one accepts Dr. Müller’s estimate of 1.5 C° warming since then, that rate is indeed well within the natural variability of the climate. Indeed, in the 40 years from 1695 to 1735, Central England (not a bad proxy for global temperature change) warmed naturally at 0.4 C° per decade, seven times faster than the 0.057 C° per decade he finds in the 262 years during which we are supposed to have influenced the weather.
Keep reading →
7.8 out of 10 based on 106 ratings
Watts Up Suspended
You know you’re going to speculate. The emails started coming in to me early this morning ten minutes after the unusual WUWT post was published. No — it’s not ClimateGate III, not FOIA. I have my theories. 🙂
Rereke calculates the release time for WUWT In New Zealand it will be 7.00 am.
Officially the release is listed for: “Sunday July 29th, around Noon PST in California”
Rereke notes: “Anthony Watt’s site does say PST, which would be 8.00am NZT. The question is, “Is that a typo?” I assumed that it was, because people just look at the clock. It is only people like me who are anal enough to worry.
By assuming that it should be PDT, I might be watching an hour early.”
So here are some other times (assuming it is PDT):
- California: Sunday 12:00 noon
- New Zealand: Monday 7 am
- Melbourne, Sydney, Brisbane Australia : Monday 5am
- Perth, Australia: Monday: 3am
- Delhi, India: Monday 12.30am
- Jerusalem Israel, Helsinki Finland: Sunday 10pm
- Paris , France; Berlin Germany; Rome, Italy: Sunday 9pm
- London, UK: Sunday 8pm
- New York, USA: Sunday 3pm
- Corresponding GMT Sunday 7pm
Times thanks to Timeanddate.com
So do tune in to WUWT… 🙂
9.3 out of 10 based on 42 ratings
With all the corruption and failures in climate science, sometimes it’s nice to read about how some areas of science are still working, and developing something that matters.
There are thousands of people working on a frontier of science that promises to revolutionize medicine. We are living in the last days of what we’ll come to know as the “old medicine” where surgeons do the unthinkable — cutting out healthy blood vessels to get spare parts for more important sites, or treating people with drugs that affect cells all over the body (with many unwanted side-effects) when what we need is a way to get the right molecules into a tiny percentage of cells. Then there is the devastating cost of using transplants from other people (deceased or not), and then having to use immune-suppressant drugs for life. Growing your own spare parts — customized and make to order — is the brilliant alternative.
Our lives would be so much better if the money used to install vast inefficient solar arrays, or bird-breaking windfarms was used instead on gene therapy. That doesn’t mean everything about this is unquestionably good, like any powerful tool, gene therapy can kill as well as save. That’s why we need to do the research, and the sooner the better.
Virtually all our cells contain all the genes that make us. So if we learn how to switch the right genes on and with the right timing, in theory, with the right scaffolding, we can build any body part. Growing a full liver is a long way off, but it’s coming. We are at the stage of building simple parts like bladders and blood vessels.
To give you some idea of how huge this field is, here are just a few stories released in the last week: Making new blood vessels from fat cells, turning skin cells into the neurons that are affected by Parkinsons, and figuring out which genes are involved in growing new teeth.
Keep reading →
9 out of 10 based on 26 ratings
For every three degrees F warmer (or cooler), about 1 % of respondents in surveys think there is more (or less) evidence that the Earth has been getting warmer (3 F = 1.6 C).
Alarmists will use this survey to tell us how dumb the punters are, but remember that even if temperatures are 10 degrees C hotter or colder than normal that still means 94% of people answering the survey have not changed their position, and that the question itself largely misses the point. The important factor is whether human emissions caused the warming, and if so, what percentage of the increase was due to man-made effects.
Local weather patterns temporarily influence people’s beliefs about evidence for global warming, according to research by political scientists at New York University and Temple University. Their study, which appears in the Journal of Politics, found that those living in places experiencing warmer-than-normal temperatures at the time they were surveyed were significantly more likely than others to say there is evidence for global warming.
Keep reading →
9.1 out of 10 based on 24 ratings
We know the answer is always that they are smart, and that if we don’t “get their vision” they just need to explain it better.
“Australians have limited understanding of climate change, Climate Institute finds”
A new survey by the Climate Institute on attitudes to climate change shows the majority are concerned for the environment, but confusion reigns supreme.
After years of vigorous and at times toxic debate, more than 1000 people surveyed gave an amazing array of answers …. Sixty-nine per cent thought humans were causing it. But when asked to explain the Gillard Government’s carbon pricing scheme, focus groups returned blank stares.
The reality is of course that climate scientists have a limited understanding of our climate, and that most Australians are suspicious that a tax can change the weather.
Try not to throw up reading the actual report: Climate of The Nation. For starters, the low contrast colors in baby blue and penitentiary-grey-brown are designed not to be read, but to be absorbed. The layout and feel is very much the style of a baby formula brochure. Bask in the “atmosphere” as you scan, but bring out your magnifying glass if you actually want to read it. The sickly sweet, staged photos announce that The Climate Institute has money to waste — your money. Only the most ultra trendoid marketing and PR agencies need apply for the job of selling The Carbon Pox to the nation.
What do these results mean? Who knows? I can’t find the actual survey questions, so at this stage: nothing. I mean “two thirds say climate change is occurring”. Really? (So 36% think Climate Sameness is a possibility?) The language and the mindless labels wait like trolls under the bridge to suck any sane analysis out of loaded questions on a road to nowhere.
Nearly all skeptics think the climate is changing, so when faced with an inanity like “do you believe in Climate Change?”, a skeptic can be either literal and straight, or play the game where they try to guess what the researchers were really attempting to find.
On the plus side, the way I read these results suggests:
- That 45% of the population is not concerned about climate change.
- Only 28% support the carbon pricing laws. (28%? that’s the number today of the ALP primary vote). The 28% rises when people are falsely told that all the money goes to households and the poor renewables lot. How many would support it if they knew 10% was feeding the UN bureaucrats, and another large slab would go to major financial brokers, auditors, lawyers, accountants, media, marketing and advertising campaigns? (Can we get some lawyers onto this point? Is this false advertising coming from The Climate Institute? Can they really claim that “all the revenue goes to support households, business and clean, renewable energy”?)
On the down side, we still have 20 years of propaganda to overcome and really only about 10% of the population are aware of just how scandalously vacant this issue and the Green NGO’s are. There is a lot of work to do.
Keep reading →
9.2 out of 10 based on 70 ratings
Believers really do have trouble with numbers. Today 400 is apparently a lot like zero.
Since when was 400 years a gap that anyone called “close”? Especially when we are talking about a molecular effect that works in microseconds (or hey, even less).
Newspapers today are full of the spin that an Antarctic survey by Pedro et al, that found CO2 only lagged temperature by a mere tiny 400 years ‘… “addressed the argument of “climate sceptics” that CO2 increases did not lead to temperature rises because the temperature rise must come first.’ [The Australian]. Didn’t the editor notice that a lag of 400 years is still a lag? Did the journalist (Rosanne Hunt) not realize that even if the lag was measured in hours it still means temperature drives carbon dioxide, and not the other way around? This is nonsense on stilts. The Australian only published 6 lines, and one of them is barking.
 The “lag” might be small on this scale, but it’s long compared to a taxpayers lifespan. Graph from the Australian Antarctic Division
The Australian Government (Antarctic Division) says it “closes the gap” and “Their findings suggest that feedbacks in the climate system – in which warming is linked to natural carbon dioxide increase, driving further warming – may operate faster than previously thought.”
But wait, if we only have to wait 400 years for this feedback to kick in, it won’t be disastrous in 2020, it will be 2345 before it starts (that’s the post WWII coal fired boom in emissions, plus 400). I just can’t see the electorate getting too worked up about it.
The gap was estimated to be 800 years previously.
Synchronous? Since when was 4 centuries “near-synchronous”?
Watch the language – they are so sloppy with it.
“The ice cores reveal a near-synchronous temperature and carbon dioxide increase. If there was a lag at all then it was likely no more than 400 years,” says Joel Pedro from the Antarctic Climate and Ecosystems CRC, in Hobart, who led the study.
[Aust Govt Antarctic Division site]
For alarmists, numbers are not important, it’s all in the “words”. Eric Steig can’t emphasize how important this is.
Keep reading →
8.3 out of 10 based on 63 ratings
Get ready — for all the fears of extreme weather coming our way — studies of Queensland, Victoria, the whole of SE Australia, New Zealand, and Perth show that either nothing is changing (there have always been bad storms) or possibly, the weather is better now than it used to be. Where is the evidence to support the claims by alarmists that increasing CO2 will make “extreme weather” more common?
It’s less windy now across South East Australia than it was in the 1920’s. It’s less stormy on the southern coast of Victoria, and records that go back 7000 years in New Zealand and 5000 years in Queensland show repeated examples of monster storms that — should they hit today, would be described as being “likely” due to coal fired power stations and excessive use of SUV’s.
The Science and Public Policy Institute published Historical storm trends in Australia and New Zealand in June. This post builds on that publication.
 … It’s less windy across South East Australia
Alexander et al 2011 looked at locations from Port Lincoln (SA) to Goondiwindi (QLD), to Hobart (Tas) which pretty much covers everything anyone could call South East Australia. They used wind speeds from as far back as records could go (1890 onwards) and the results showed the wind speeds have declined across the whole region. Furthermore it doesn’t matter what season you study. The trends are the same.
For those who are old enough to say so, “yes” it really was stormier and windier back in the 1920’s in Australia.
 Fig. 3 Southeast Australian region averages of seasonal P95 and P99 storm indices, along with Gaussian filtered curves and linear trends for the indicated seasons over the period of 1885–2008. (Alexander et al 2011) But what about the long long trend? Say 5000 years?
Hayne and Chappell (2001) looked at deposits left from storm surges on Curacoa Island (one of the Palm Islands of far north Queensland). They found that large cyclones have been hitting the coast at a statistically constant rate for 5000 years. This includes the earliest times when the sea surface temperature appear to have been about 1°C warmer (Gagan et al 1998). At Palm Island, sea levels were apparently 70cm higher back in that warm Holocene era (Chappell et al 1983). Somehow the Great Barrier Reef survived.
Haynes writes: ” This suggests that cyclone frequency may not have been affected by sea surface temperatures in the region.”
Keep reading →
8.9 out of 10 based on 38 ratings
Indur Goklany calculated that biofuels policies killed nearly 200,000 people in 2010 alone. That was before this study showed things may be worse than we suspected.
Brazil is the largest sugar cane ethanol producer in the world, but people are burning four times the area of sugar cane plantations than previously realized, and it’s producing far more pollution than they thought. For every unit of energy generated, the ethanol-biofuel use produces a lot less CO2 (plant fertilizer) but more volatile organic compounds (VOC’s), more carbon monoxide, more nitrous oxides, as well as more sulphur dioxides. (See Graph b below).
Compared to gasoline and diesel, over its whole life cycle, every unit of energy produced with sugar cane produces 10 times as much volatile organic compounds (VOC’s), carbon monoxide, and nitrous oxides. The amount PM10’s and PM2.5’s produced with ethanol fuels is even higher. Most of the pollution comes from burning fields of sugar cane (see graph a). Hence the people suffering the most from ethanol production will be villagers and rural farmers living near areas of sugar cane production. While there have been efforts to encourage farmers to produce cane without burning fields, over half of sugar-cane crop loads continue to be burned. Presumably there is a cost to producing sugar cane without burning. Perhaps sugar-cane production is viable and competitive without burning but this study does not discuss the reasons farmers prefer to burn fields.
If you care about pollution, and want less of it, and you care about the health of people in developing countries then clearly we should encourage gasoline and diesel use, and discourage production of ethanol that involves burning sugar cane-fields.
Likewise, to promote growth in the Amazon (by increasing CO2 levels), we ought to be burning fossil fuels and not fields of cane.
If global policies devalue concentrated energy underground and prize diffuse photosynthetic sources of energy above ground, will we protect and retain dirty rocks deep below the surface at the expense of biodiversity and health of plants and people? It seems so.
 Figure 1 Comparisons of life-cycle emissions for sugar-cane ethanol in Brazil and conventional liquid fuels. a, Life-cycle emissions per unit energy of sugar-cane ethanol produced within five life-cycle phases. Although our life-cycle emissions account for a mix of sugar-cane fields where the burning practice is used and not used, the burning-phase emissions shown here are for ethanol produced from croplands that are burned. T/D, transportation/distribution; BTU, British thermal units. b, Comparisons of life-cycle emissions for conventional gasoline, diesel and sugar-cane ethanol. Estimates from the GREET model include six air pollutants (VOC, CO, NOx, PM10, PM2:5, and SOx) and greenhouse gases (as CO2 equivalent, CO2e). Right axis is for greenhouse-gas emissions. The empirical evidence is consistent. Emissions of black carbon, organic carbon and carbonyl sulphide are rising rapidly over Brazil and the increase occurs during the months of peak sugar cane production.
Keep reading →
8.2 out of 10 based on 58 ratings
O woe betide those who are losing. Graham Readfearn moans and laments the Green-Labor losses that are likely to come nationally in the near future. Readfern packs the whole kit-and-kaboodle of fallacies, misnomers, and confounded reasoning into one article.
“Anyone who places any stock in safeguarding the current and future climate (and for that matter anyone who doesn’t) should prepare themselves for the risk that very soon, climate science deniers, contrarians and sceptics will be running the show.
But who are the deniers here? Readfearn fashions himself as a bit of an expert on deniers, so you’d think he’d be able to say what they deny. But Readfearn thinks skeptics deny that CO2 absorbs infra red:
“To Pearson and others, the experiments of John Tyndall in 1859 which established the warming properties of what we now know to be greenhouse gases just didn’t happen.
Dear Graham, if you bother to get accurate you’ll note that Spencer, Lindzen, Monckton, Michaels, Douglass, Singer, Idso, Knox, Soon, Svensmark, Christie, Watts, Carter, Giaever, Schmitt and I could go on (Evans, and dare I say Nova in that list) — all agree that CO2 is a greenhouse gas. It may come as a surprise to you — a shock by golly — but the debate (which you evidently aren’t aware of) is not about whether CO2 absorbs infra red, but whether that warming effect is significant.
It’s the feedbacks Graham. Feedbacks. It’s time to admit that the debate is about the amplifying feedbacks (present in simulations of the climate, but not so in the real climate). Graham, as long as you pretend that “Tyndall denial” is what the debate is about, you are misrepresenting the science. What can I say? You are in denial.
Readfearn can’t name any evidence to back his faith, or presumably he would have rushed to send me that mystery paper with evidence I’ve been asking for for 30 months. Yet despite his “scientific analysis” being nothing more than an obedient yes-man for committees and associations, he thinks people who disagree with him are deluded and taking science towards astrology.
9.1 out of 10 based on 149 ratings
Two major proxy studies, larger than ever, were released in April and June 2012. They show that the Medieval Warm Period (MWP) existed, and was similar to current temperatures. These comprehensive studies suggest current temperatures are not unusual, and that itself is not all that surprising — I’ve mentioned before how there are hundreds of proxy studies showing it was as warm or warmer back then. (CO2science has been documenting them.) But these studies are worth a mention because they are so large.
Climate models cannot explain what caused the warming 1000 years ago, nor the cooling 300 years ago, so they can’t rule out the same factors aren’t changing the climate today (though they claim they can). If climate models can’t explain the past, they can’t predict the future.
The last 12 Centuries
Ljungqvist used 120 proxy records — nearly 3 times as many proxies as previous studies and conclude: “during the 9th to 11th centuries there was widespread NH warmth comparable in both geographic extent and level to that of the 20th century”. Their proxies included ice-cores, pollen, marine sediments, lake sediments, tree-rings, speleothems and historical documentary data.
 Ljungqvistet al 2012 Fig. 4. Mean time-series of centennial proxy anomalies separated by: (A) data type, (B) continents, (C) latitude, (D) seasonality of signal. The curves in (B–D) show the mean and moving block bootstrap confidence intervals (±2 standard error) (Wilks, 1997).
The numbers in parentheses indicates the number of proxies in each category. The last 2000 years
In April 2012 Christiansen and Ljungqvist published a study of 32 proxies going back as far as 1AD for the extra-tropical Northern Hemisphere. They found the first millennium was warmer than the second, that the Little Ice Age (17th Century) was awfully cold and colder than the “Dark Ages” cooling (circa 300- 800AD), and about −1.0 °C below the 1880–1960AD level. It warmed a bit in the 1700’s then cooled again in the 1800’s almost back to where it was in the 1600’s. The Little Ice Age appears in records across vast areas, and the three century pattern of colder-warmer-and-almost-as-cold-again repeats all around the Northern Hemisphere. Things have warmed fast since the Little Ice Age but then, it was the coldest patch in the 2000 year record, so it’s not altogether surprising that it has rebounded quickly.
The MWP peaked from 950 to 1050AD at around 0.6°C warmer than the calibration period 1880–1960 AD: “Note that the extra-tropical NH mean temperature from HadCRUT3v in 1880–1960AD is 0.23 °C colder than in the often used standard climate period 1961–1990 AD.” That means the MWP was about 0.4 °C warmer than the 1961-1990 period.
Here’s is the long reconstruction of the last 2000 years (extra-tropical Northern Hemisphere). The “zer0” is set at the average for the 1880-1960 period. So Roman times were about as warm as the first half of the 1900’s. The MWP was hotter than that.
 … Past reconstructions are flatter…
Keep reading →
8.8 out of 10 based on 62 ratings
There are only hours to go before the three winning questions that Australian Prime Minister Julia Gillard must answer are decided. Andrew Bolt noticed that the author of one question got US voters involved. (From BOLT: It seems the author has got US Internet forums to help. Also here: not-so-pointless-poll-on-australian-chaplains / aggregator | AtheistAus | pzmyers. “Should blog readers fight fire with fire? It does seem odd having US readers demand answers from an Australian PM that they’ll almost certainly won’t hear about a program that doesn’t affect them in the slightest.”)
Those who log in can register 8 votes. But it closes very soon: Voting ends on July 19th at 5 PM.
At the moment:
Q1
7.8 out of 10 based on 47 ratings
So much for that global “free” market.
Scott the trader writes to explain that the EU “CER” credits are the ones people can buy and exchange for Australian Carbon Credit Units (ACCUs) but they have sunk to $4. The more expensive $9 EUA units that most commentators mention, are not exchangeable in the Australian market:
“The EU CER price is equivalent to about A$3.80 per tonne… Almost $20 below Australia’s fixed price. These are the products most comparable to Australia’s $23/Tonne as it will be CERs that we can surrender instead of Australian Carbon Credit Units (ACCUs) to satisfy an Australian Clean Energy Scheme liability. It is incorrect as most media commentators are doing in Australia to compare to EUAs which are at about $9 Australian. Australia cannot access EUA’s to satisfy our carbon liabilities. The only comparison is $3.80/T for a CER and $23/T for an ACCU.”
So most commentators are comparing the wrong type of carbon credits, and the Australian market is even more overpriced than people recognize. Australians will be paying 500% more than the largest carbon market in the world.
The Australian scheme is the most expensive, and most ambitious in the world. On top of that we are a distant market based heavily on fossil fuels.

[Source: eeX CER prices 2010 – Jul 2012]
LONDON, July 16 (Reuters Point Carbon) – CER prices sank to a new low on Monday within touching distance of 3 euros as traders continued to offload the offsets amid plentiful supply of cheaper ERUs, which can also be used for compliance in the EU’s Emissions Trading Scheme.
The benchmark December 2012 secondary CER contract closed at 3.18 euros, the day’s high, but down 2 percent on Friday’s close as traders continued to unwind long positions.
In afternoon trade the U.N. offset slid to a record low of 3.08 euros.
“The feeling is that with increased ERU supply coming into the market, there’s not much reason to hold onto CERs, particularly because of oversupply in the carbon market as a whole,” said one trader, adding that 3 euros was a critically- important support level.
(Paywall protected)
Natural gas prices are falling, so electricity producers are switching to the cheaper and lower emission fuel, which means they don’t need to buy as many carbon permits.
As I’ve said all along, those who call for a “free market” solution are the ones who don’t know what a real free market is.
H/t Scott the trader. 🙂
UPDATE: This AAP article July 1, 2012 explains that Australian’s who buy cheap CER units have to “top up” the amount to the government approved price of $15 per unit:
“Traders are also awaiting final rules on how to implement the floor price on international units. An Australian emitter that buys a foreign carbon offset, such as UN-backed Certified Emission Reductions (CER), below the floor price will have to pay money to the government to ensure it did not get the offset cheaper than $A15.”
The Climate Spectator confirms that it is the CER price that the Australian and New Zealand schemes are tied to.
“While the Australian Government will not recognise all types of CERs, for the most part these credits can be used as a one for one replacement with Australian permits. Therefore the price of Australian permits has the potential to be heavily tied to the price of CERs just as occurs under the New Zealand emissions trading scheme.”
8.7 out of 10 based on 52 ratings
Topher did the brilliant “Forbidden History” video, which has hit 50,000 views and he wants to make two more to remind people of the importance of free speech.
There are only hours to help him to reach the tally. Pledges are only processed if the total hits $35k and I hear that there is a big donor as yet unlisted, and the remaining gap is small, so those last promises today might make all the difference.
The post here last month on The Forbidden History of Unpopular People garnered a very enthusiastic response.
“It’s about arrogance, it’s about powerful people here in Australia who believe that they are smarter than you, that their opinion is worth more than your opinion, and that their thinking is better than your thinking, and if you think they’re wrong, you should just shut up.”
Help stop the News Media Gestapo
I’m sorry I wasn’t onto this earlier in the piece…
Keep reading →
8.8 out of 10 based on 33 ratings
When independent auditors found errors, gaps and deep questions about the HQ (High Quality) dataset for the official record of Australian temperatures, the BOM responded by producing a completely new set called ACORN in March 2012. But this set is also plagued with errors. One of the independent auditors, Ed Thurstan writes to me to explain that though the BOM says it aimed for the “best possible data set” and specified that they check internal consistency of data (one such check is to make sure that the maximum on any given day is larger than the minimum) when Thurstan double checked ACORN he found nearly 1000 instances where the max temperatures were lower than the minimums recorded the same day.
This raises serious questions about the quality control of the Australian data that are so serious, Thurstan asks whether the whole set should be withdrawn.
Why are basic checks like these left to unpaid volunteers, while Australian citizens pay $10 billion a year to reduce a warming trend recorded in a data set so poor that it’s not possible to draw any conclusions about the real current trend we are supposedly so concerned about. — Jo
 The BOM goes to great lengths to assure us it’s high quality, peer reviewed, and rigorously checked, but with a days work, independent audits find major flaws Anomalies Errors in ACORN_SAT Data
Ed Thurstan
July 14, 2012
Ever since the documentation for ACORN-SAT was released, I have had doubts about the ability of the Australian Bureau of Meteorology to honour their published intention to release all software that generated the ACORN-SAT data. ( I might amplify that thought later.)
In March 2012 the BOM released the report
“Techniques involved in developing the Australian Climate Observations Reference Network – Surface Air Temperature (ACORN-SAT) dataset CAWCR Technical Report No. 049 Blair Trewin
This specifies in great detail both the background to the development of the database, and the checks applied to the data. As Blair Trewin writes in the Abstract of this report:
“The purpose of this data set is to provide the best possible data set to underlie analyses of variability and change of temperature in Australia, including both analyses of annual and seasonal mean temperatures, and of extremes of temperature and other information derived from daily temperatures.”
I decided to take that document as a Program Specification, and write code to perform those data checks.
The very first check specified in section 6.1 of the above report is
“1. Internal consistency of daily maximum and minimum temperature
Keep reading →
8.6 out of 10 based on 80 ratings
Australia’s hottest day? Not 2010, but 1828 at a blistering 53.9 °C
Back before man-made climate change was frying Australia, when CO2 was around 300ppm, the continent savoured an ideal preindustrial climate, right? (This is the kind of climate we are spending $10bn per annum to get back too?)
We are told today’s climate has more records and more extremes than times gone by, but the few records we have from the early 1800’s are eye-popping. Things were not just hotter, but so wildly hot it burst thermometers. The earliest temperature records we have show that Australia was a land of shocking heatwaves and droughts, except for when it was bitterly cold or raging in flood.
In other words, nothing has changed, except possibly things might not be quite so hot now.
Silliggy (Lance Pidgeon) has been researching records from early explorers and from newspapers. What he has uncovered is fascinating. — Jo
——————————————————————————————————-
 Charles Sturt (1930 postage stamp) Wikimedia Lance Pidgeon writes:
“EXTENSIVE FLOOD”, “AWFUL BUSH FIRES”, “PROLONGED DROUGHT“ AND “CHANGES OF CLIMATE“.
These Australian headlines from the 1800’s above describe extremes the early colonists faced. At the time the European explorers who were instructed and equipped to map the country and record the climate were frustrated by the only constant …change.
The heat was extreme – often hotter than 127F!
Like the other explorers Sturt was asked to record everything and in detail:
“You are likewise to note the nature of the climate, as to heat, cold, moisture, winds, rains, &c, and to keep a register of the temperature from Fahrenheit’s thermometer, as observed at two or three periods of each day.”
[From “Letter of Instructions” for his earlier expeditions from “His Excellency Lieutenant General Ralph Darling” Here]

Captain Charles Sturt as he inspects the equipment provided for the 1844-46 expedition into central Australia. Cartoon from Josh of Cartoons by Josh
The equipment provided was not always up to the task. On the equipment provided for one of his later expeditions he remarks:
“The thermometers sent from England, graduated to 127 degrees only, were too low for the temperature into which I went, and consequently useless at times, when the temperature in the shade exceeded that number of degrees” Charles Sturt. [From here].
He was able to acquire and take brewers thermometers. Which were used to measure the “in the sun” temperature and the ‘in the shade” temperatures that were too high for the precision ones. They were also used to estimate height above sea level from the boiling point of water.
Sturt offered his own analysis of some of the typical daily conditions from records in the colony at the time and his own observations.
The periodicity of the weather cycles did not escape his attention.
“The thermometer ranges during the summer months, that is, from September to March, from 36 degrees to 106 degrees of Fahrenheit, but the mean of the temperature during the above period is 70 degrees.”
In degrees C that range equates to a minimum of 2.2 , a max of 41.1 with a mean of 21.1.
This average seems close to the current average but the lower and upper temperatures were both more extreme than they are now!
Keep reading →
9.4 out of 10 based on 75 ratings
Two biology and environmental academics from Schenactady and Rensselaer Polytech New York were apparently concerned that their young prodigy might be lost from the religion of global warming (and misled by “Deniers”) so they put together together a guide to help others facing the onslaught of common sense and reason. The piece titled “Effective Strategies to Counter Campus Presentations on Climate Denial” was published in Eos.
What they didn’t do, was put forward empirical evidence. (If only they’d thought of that?)
The source of their angst? Christopher Monckton (of course) who spoke at Union College (thanks to CFACT), with help simultaneously from none other than Ivar Giaever (the Nobel Prize winning physicist we saw yesterday) who spoke at Rensselaer. (Imagine the very idea of a Nobel prize winning physicist speaking on campus about uncertainties of predicting the weather?)
Eos , Vol. 93, No. 27, 3 July 2012
Effective Strategies to Counter Campus Presentations on Climate Denial
Jeffrey D. Corbin and and Miriam E. Katz [PDF]
Assuming the world copied the Australian Carbon Tax… it will cost $2,000 trillion to cool the planet by one degree.
Monckton send this reply (below) to Eos, but while the magazine will publish name-calling illogical pieces it does not always find the polite reply as appealing.
The cost of the Australian carbon “tax”
Christopher Monckton saute’s and dices the usual fallacies, but also calculates the cost-benefits of the Australia Carbon Tax, should it be reproduced on a global scale. He assumes that not only will the Carbon Tax achieve what Ms Gillard intended (emissions wise), but also that the exaggerated unvalidated climate models of IPCC fame are completely correct. With these cavernous caveats, he estimates it will cost $2,000 trillion to cool the planet by one degree, and that’s the best case scenario.
“…carbon trading in Australia will cost $10.1 bn/year, plus $1.6 bn/year for administration (Wong, 2010, p. 5), plus $1.2 bn/year for renewables and other costs, a total of $13 bn/year, rising at 5%/year, or $130 bn by 2020 at n.p.v., to abate 5% of current emissions, which represent 1.2% of world emissions (derived from Boden et al., 2010ab). Thus the Australian measure, if it succeeded as fully as its promoters intend, would abate 0.06% of global emissions over its 10-year term. CO2 concentration would fall from a business-as-usual 410 to 409.988 ppmv by the end of the term. Forcing abated is 0.0002 W m–2; warming consequently abated is 0.00006 K; mitigation cost-effectiveness, which is the cost of abating 1 K global warming by measures of equivalent cost-effectiveness, is $2,000 tr/K. On the same basis, the cost of abating all projected warming over the ten-year life of the policy is $300 trillion, or $44,000/head, or 58% of global GDP over the period. The cost of mitigation by such measures would exceed the cost of climate-related damage consequent upon inaction by a factor of approximately 50.”
There is an excellent write up of Moncktons original talk in Schenectady on Watts Up, which I enjoyed reading.
—————————————————————–
Christopher Monckton: Right of reply
We are grateful* to the editors of Eos for this right of reply to Corbin and Katz (Effective Strategies to Counter Campus Presentations on Climate Denial, Eos, 2012 July 3), a 1200-word melange or smørgasbord of the shop-worn logical fallacies of argument ad populum, ad verecundiam, and, above all, ad hominem.
The authors, arguing solely from consensus (ad pop.) among scientific experts (ad vcd.), say without evidence that speakers like us “intend to muddy the waters with respect to climate science” (ad hom.); they serially cite politicized websites and tendentious non-peer-reviewed presentations by non-climate-scientists against us as though they were authoritative (ad vcd.), while omitting to cite published rebuttals (e.g. Monckton of Brenchley, 2006, 2010) to these dubious sources (ad hom.); they accuse us of misrepresentation, distortion, and flawed analysis without adducing a single instance (ad hom.); and they four times brand us as “climate change deniers” (ad hom.) – a hate-speech comparison with Holocaust denial. Because these irrational allegations are so serious, we have insisted upon this right of reply.
Keep reading →
9.4 out of 10 based on 56 ratings
The NZ Herald reports a new study showing that since 1988 there has been a sudden increase in the absorption of CO2 over land. It’s in the order of a billion tons of CO2 a year and amounts to 10% of all human emissions. As usual, the spinmeisters frame it in terms of our guilt instead of their ignorance. “Look! Things would have been worse and even warmer if not for this new unknown factor.”
But globally plants already emit about 80Gt per year. Finding one extra Gt of absorption is both predictable and largely insignificant. What this episode really shows is just how far the alarmist PR departments will go to find any excuse to cover up for two decades of poor predictions.
Dr David Evans, formerly a carbon modeler for the Australian Greenhouse Office calls the new discovery “just noise”:
Sounds impressive, but it’s not significant. Rough numbers: there are currently 800GtC (gigatonnes, or billion tonnes) of CO2 carbon in the atmosphere, and each year: plants oceans absorb 80GtC and emit 80GtC, oceans plants absorb 120GtC and emit 120Gt, and human emissions are 8GtC. (Notice that the total turnover in CO2 carbon each year is about a quarter, which fits with the observed residence time in the atmosphere of an individual CO2 molecule of about 4 to 5 years — here are delays due to inadequate mixing). The atmospheric CO2 levels have been going up at about 2ppm (or 4GtC) per year for decades.
[Apologies for the mix up between C and CO2. Carbon accountants work in C but often report in CO2 because that is what many “clients” expect. Having seen umpteen sets of figures each way I have lost any sense of what is “normal”, and simply check context every time to see what is meant. The carbon accounting software I wrote, FullCAM, works in C internally, and converts to CO2 or CH4 or whatever as required. It is the C atoms that accountants track, because they combine and recombine with O (as CO2) and H (as CH4) and numerous organic compounds as they move from air to plants to soil to microbes and back to air, and so on. As for the ocean-plant mix up, it was late, oops. There is a good diagram in AR4 page 515, Figure 7.3, although for the 1990’s. The rough figures here are round numbers which will let you understand and check any of these global carbon flow discussions. – David]
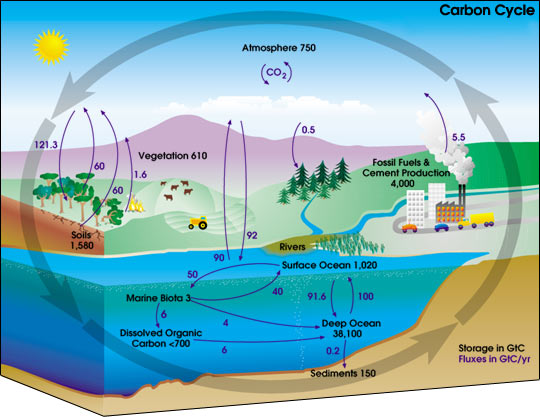 Each year humans emit about 8Gt of CO2. Plants emit and absorb about 80Gt. (This is an old chart with out of date numbers that don’t quite match. Oddly NOAA or ? haven’t updated it?) This study purports to find an extra 1Gt of CO2 absorbed by plants. That’s just noise, less than the uncertainty in the other figures, and makes no significant difference to anything. Their suggestion that the earth would have warmed faster without this absorption is true, but the extra warming is miniscule and unmeasurable. The unmistakable conclusion is this paper is transparently qualitative boasting to suck in those ignorant of carbon accounting (which is just about everyone), and simply distracts attention from the failure of their predictions that the world would warm quickly from 1990 on due to rising CO2 levels (awkward reminder: 0.30C per decade was the 1990 IPCC estimate).
On a side issue, there’s a bit of a red flag: one of the study’s authors, DrSara Mikaloff-Fletcher said “We applied some really exciting statistical techniques …”. Oh I hope you’re not overindulging in numerical wishful thinking like Dr Mann, of whose hockey stick Professor Wegman famously said: “It is important to note the isolation of the paleoclimate community; even though they rely heavily on statistical methods they do not seem to be interacting with the statistical community.”
Patrick Moore: (Greenpeace founder) says Long live plants and humans, increase CO2!
Climate Depot asked Patrick Moore to comment on the new results.
Ecologist Dr. Moore pulled no punches in commenting on the new study: “These people are either completely naive about the relationship between CO2 and plants or they are making this up as a way of deflecting attention from the lack of warming for the past 15 years.”
Moore told Climate Depot: “Plants grow much faster when CO2 is higher, the optimum concentration is between 1500-2000 ppm so there is a long way to go before plants are happy. CO2 levels in the atmosphere have continued to rise despite plants absorbing more CO2. So what is the ‘scientists’ point? It is to obfuscate, confuse, and otherwise muddy the waters with disinformation.
Keep reading →
9 out of 10 based on 49 ratings
|
JoNova A science presenter, writer, speaker & former TV host; author of The Skeptic's Handbook (over 200,000 copies distributed & available in 15 languages).

Jo appreciates your support to help her keep doing what she does. This blog is funded by donations. Thanks!


 Follow Jo's Tweets
 To report "lost" comments or defamatory and offensive remarks, email the moderators at: support.jonova AT proton.me
Statistics
The nerds have the numbers on precious metals investments on the ASX
|






Recent Comments