Ice cores reveal that CO2 levels rise and fall hundreds of years after temperatures change
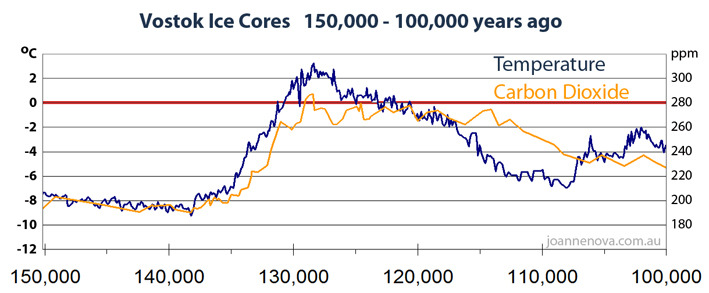
In 1985, ice cores extracted from Greenland revealed temperatures and CO2 levels going back 150,000 years. Temperature and CO2 seemed locked together. It was a turning point—the “greenhouse effect” captured attention. But, in 1999 it became clear that carbon dioxide rose and fell after temperatures did. By 2003, we had better data showing the lag was 800 ± 200 years. CO2 was in the back seat.
AGW replies: There is roughly an 800-year lag. But even if CO2 doesn’t start the warming trend, it amplifies it.
Skeptics say: If CO2 was a major driver, temperatures would rise indefinitely in a runaway greenhouse effect. This hasn’t happened in 500 million years, so either a mystery factor stops the runaway greenhouse effect, or CO2 is a minor force, and the models are missing the dominant driver.
Amplification is speculation. It’s a theory with no evidence that it matters in the real world.
Conclusion:
1. Ice cores don’t prove what caused past warming or cooling. The simplest explanation is that when temperatures rise, more carbon dioxide enters the atmosphere (because as oceans warm they release more CO2).
2. Something else is causing the warming.
Al Gore’s movie was made in 2005. His words about the ice cores were, “it’s complicated.” The lag calls everything about cause and effect into question. There is no way any honest investigation could ignore something so central.
Source: Carbon Dioxide Information Analysis Center http://cdiac.ornl.gov (See references at the bottom also).
A complete set of expanded full size graphs and print quality images is available from my Vostok Page.
Extra notes, references, and discussion about this page
The media blackout on “the lag” continues
The lag in the ice cores is old news to skeptics, but most people in the public still have no idea. This is page 5 of the HTML version of The Skeptics Handbook (the first booklet). I should have posted it long ago. The graph series and data are compelling. It’s one of the most basic features of climate science evidence, and yet it is so misused. Even tonight, I did a radio interview for NewstalkZB, New Zealand, and the pro-climate scare spokesman still referred to both the fraudulent Hockey Stick Graph and the Vostok Ice Cores as if they helped his case.
Between 1999 and 2003 a series of peer reviewed papers in the highest journals came out showing that carbon rises hundreds of years after temperature, and not before. What amazes me is that fully six years after Caillon et al in 2003 published their definitive paper, people still think the ice cores are evidence supporting the scare campaign. “The climate is the most important problem we face,” yet somehow not a single government department, popular science magazine or education department thought it was worth doing a close up of the graph and explaining to the public that there was a definitive, uncontested long lag, and that carbon always followed temperature.
The Al Gore style version (of which there are hundreds on-line, see below) hides the lag by compressing 420,000 years into one picture. If the public had known that temperatures lead carbon dioxide, Al Gore would not have been able to get away with using it they way he did.
In 2008, I marveled that with billions of dollars available to agencies and education campaigns, no one had graphed the lag as a close up. Why did it take an unfunded science communicator to get the data and graph it “as a hobby project”? I wanted to see that long lag; I wanted to be able to point at a graph and explain the lag to all the people who had no idea.
If you want to explore the thousands of years of those famous ice cores, the Vostok page has the full set of graphs, and this page right here is the place to comment and ask questions.
References
Petit et al 1999 — as the world cools into an ice age, the delay is several thousand years.
Fischer et al 1999 — described a lag of 600 ±400 years as the world warms.
Monnin et al 2001— Dome Concordia – found a delay on warming from the recent ice age 800 ± 600 years
Mudelsee 2001— over the full 420,000 year Vostok history, Co2 lags by 1,300 ± 1000 years.
Caillon et al 2003 — analysed the Vostok data and found a lag of 800 ± 200 years
UPDATED with full references
Petit, J.R., Jouzel, J., Raynaud, D., Barkov, N.I., Barnola, J.-M., Basile, I., Bender, M., Chappellaz, J., Davis, M., Delaygue, G., Delmotte, M., Kotlyakov, V.M., Legrand, M., Lipenkov, V.Y., Lorius, C., Pepin, L., Ritz, C., Saltzman, E., and Stievenard, M. 1999. Climate and atmospheric history of the past 420,000 years from the Vostok ice core, Antarctica. Nature 399: 429-436. [Discussion, CO2science]
Fischer, H., Wahlen, M., Smith, J., Mastroianni, D. and Deck B. 1999. Ice core records of atmospheric CO2 around the last three glacial terminations. Science 283: 1712-1714. [Discussion, CO2science]
Monnin, E., Indermühle, A., Dällenbach, A., Flückiger, J, Stauffer, B., Stocker, T.F., Raynaud, D. and Barnola, J.-M. 2001. Atmospheric CO2 concentrations over the last glacial termination. Science 291: 112-114. [Discussion, CO2science]
Mudelsee, M. 2001. The phase relations among atmospheric CO2 content, temperature and global ice volume over the past 420 ka. Quaternary Science Reviews 20: 583-589.
Caillon, N., Severinghaus, J.P., Jouzel, J., Barnola, J.-M., Kang, J. and Lipenkov, V.Y. 2003. Timing of atmospheric CO2 and Antarctic temperature changes across Termination III. Science 299: 1728-1731. [Discussion, CO2science]


[…] This post was mentioned on Twitter by Henrietta Hughes, johnnyA99. johnnyA99 said: CO2 rises 800 years after temperatures http://j.mp/5YPjOM via JoNova #COP15 #350ppm #StupidCo2BS #climate #ClimateGate […]
20
Meanwhile, in western Canada…
http://www.ottawacitizen.com/technology/Edmonton+breaks+weather+record/2336491/story.html
20
“ CO2 rises 800 years after temperatures”… Then it would be common sense to say that it would take 800 years to do the opposite.
27
Not necessarily. There may be a correlation in a rise, but not in the fall if the one is not causative of the other. “Correlation is not necessarily causation”.
40
Isn’t it amazing how the media fails to report on the evidence? I saw an IPCC hack on a youtube video from a biased Australian news/opinion TV show state that CO2 may not have preceded temperatures rising but that it was the equivalent of throwing gasoline on a fire. Why Professor Carter didn’t respond to the obvious illogic of his unworthy opponent is beyond me. There is no runaway effect because temperatures fall for 800 +/- 200 years before CO2 levels begin to also decline. As Jo mentioned the oceans take hundreds of years longer to warm and cool than the continents do. Also, as the oceans warm the emit CO2 and as they cool the absorb CO2. One of the big problems the Climate Cabal has to deal with now that the hockey sticks are broken is how to explain away the little ice age and the medieval warm period. Also , the Roman Warm period was warmer then the recent warm period and the Holocene maximum was much warmer. All these previous warm periods have one thing in common, they occurred when CO2 levels were lower. As I said in a previous comment to another of Jo’s insightful posts, the proponents of global warming are doing more damage to their cause in the cover up and the white washing than the actual scandal. The mainstream media is starting to cover the story. Nobody wants to be left out in the MSM. Just as these Lemmings followed the AGW fraudsters off the cliff of journalistic integrity they are now actually listening to the skeptics and they have placed the proponents of AGW on the defensive. The ice core data is just the tip of the iceberg of the wealth of data that falsifies the AGW greenhouse theory. What about the email Dr. David Deming received in the mid 1990’s stating that “we have to get rid of the medieval warm period”? How about the Wegman report totally debunking the MBH98 hockey stick graph? How about the debunking of Briffa, et al’s hockey sticks? These pillars of the scientific community committed outright fraud! And the brazen, shameless Mikey Mann recently published another hockey stick purportedly showing a link between a non existent increase in hurricane activity and non existent AGW! It flew in the face of empirical evidence which showed a decrease in hurricane activity over the last thirty years, not an increase. If the recent warming is so unprecedented why are they finding viking corpses below the permafrost in Greenland? As the ice recedes in the Alps why are they finding remnants of medieval civilization? How did Hannibal cross the Alps to attack Italy and yet today the route is impassible even when using modern mountaineering equipment? The Great Global Warming Swindle is so blatantly obvious that anyone with a brain stem should be able to see right through the BS. Also, as I have stated elsewhere on this site, these ‘scientists” would start to drive the bus over each other. Well, the destruction derby has already started. Mann has thrown Phil Jones under the bus and Pachuari is referring to the “few’ bad scientists as black sheep. It is obvious from the emails that Mann participated in the conspiracy to defeat FOI requests by deleting emails. He invented the “trick” to “hide the decline.” I do not think it is a coincidence that GISS/NOAA and the CRU data are in substantial agreement. Jimbo Hansen was forced to restate the list of the warmest years on record to reflect 1934 as the warmest year after he was caught in a Y2K “error.” Since then, he has once again “adjusted” the data to show 1998 and 2006 tied for the warmest year ever recorded. He has stalled Chris Horner’s FOI request for two years and Horner notified NASA of his intent to file a lawsuit if he doesn’t get the raw data before the beginning of the new year. This is the same Jim Hansen who verbally castigated Jones et al for not releasing their data. What a hypocrite! There are four major sources for temperature data. Two are land based, the CRU and GISS data. The other two are satellite data, RSS Santa Rosa, California (where I live in the “Green Zone”) and MSU. The satellite data measures the movement of oxygen molecules and is calibrated from the land based record. If the two land based sources are corrupt so are the satellite sources. The real problem faced by these charlatans “in hiding the decline” was how to account for the divergence and discrepency between fraudulently altered land based records and unreliable tree ring data (hokum + bunkum = climate science?) The same thing that started the conspiracy, greed for grant money, will also be their undoing as these worms struggle to survive and maintain their funding. Half of these criminals are on youtube foretelling the impending ice age in the 1970’s which never materialized. As Shakespeare said, “The truth will out.” The light of truth will shine through the fog of deceit and deception and the forces of good shall triumph. Let the climate scandal meltdown begin!
121
The tide is turning. For an interesting article that succinctly summarizes the climategate scandal and its repercussions see: http://www.independent.ie/world-news/tide-is-turning-on-climate-change-1973273.html. Keep up the good work Jo! If there is a God (I personally believe so) you shall merit a high place in heaven for having the intestinal fortitude to tell the truth even though the forces of evil have marshalled against you and those other brave souls who have the audacity to speak the truth.
71
This shows that Anthropogenic Global Warming is not a science, but science fiction.
Consider that real science is evidence based and is falsifiable.
If a scientific theory makes a prediction, and then that prediction is wrong, then the theory is false.
This is the whole basis of the scientific method.
Lets us see, cause must preceed effect, therefore if CO2 goes up after temperature rises, it cannot be the cause.
Therefore the AGW hypothesis is false. QED.
This is just elementary high school logic.
But AGW zealots ignore all contrary evidence, ignore logic itself, and insist on belief based on pure faith alone.
Skeptics are demonized as “Deniers”
Any contrary evidence is not considered, just ignored or rejected out of hand.
Robin Williams, ABC science journalist, states : what do these emails reveal? I have not read them.
He then claims that they prove nothing, by means of appeal to authority.
50
Before AGW became dogma, I was taught the 800-1000 year lag between temperature and CO2 level in the paleo record. As AGW became dogma, that always bothered me, but what bothered me most was that in the historical record temperatures would start declining before CO2 and the evil gas would often stay at a high level as temperatures plummeted. How could CO2 be driving temperature? However, during the 90’s temperatures did seem to be rising with CO2 and I more or less suspended disbelief. Besides, I lived in Brisbane and weather was the least of my worries. Now I live in Edmonton, Alberta, and not paying attention to the weather can be fatal. Weather isn’t climate, but my average weather seems to be becoming much colder and CO2 is still rising.
40
Dave, are you enjoying your record cold? I saw it was -46 degrees with wind chill of -58 on Sunday morning, breaking the old record by -10 degrees! It must be karma for Edmonton’s role in the tar sands development 🙂
41
So far we’ve lost the psychology battles. The images of Hockey Stick Graphs and drowning polar bears have stuck in peoples minds WHO ARE JUST NOT INTERESTED IN THE SCIENCE, they will not listen let alone actively seek alternative views. The warmaholics know this.
I believe we need to keep harping on about the MONEY MONEY MONEY. The cost to average mums and dads, supported by the amount of money Gore Pachuri Flannery et al are making (snouts in troughs always gains attention and has instant credibility) and the tax grab of govt.
Once people are “upset” about the money, their nature will kick in, i.e. whenever they see a correct graph or hear about increases in polar bear populations, they will say “see, it’s all for the money” in order to justify their anger. It’s just human nature.
The many skeptics websites I’ve visited are bogged down in the detail of the science (Im guilty of that too), we are talking amongst ourselves, the people that matter are not visiting these sites nor are they listening.
But they always listen when money is involved and they don’t need fine details, snouts in troughs is a given for many, bit like an urban legend.
40
Thank you Jo for another great read.
It’s amazing that those of us who have been following the science have known this for years.
Yet… when you discuss these things with people who like to call us “deniers”, they don’t actually know that CO2 LAGS Temperature. Not leads it as was implied by Gore.
They don’t understand anything about the UHI effect, Sattelite temps showing temperatures are cooling, Mann’s hockey stick being debunked or even know about the Little Ice Age or the Medieval Warming period.
They don’t understand what skeptics are arguing about and don’t even bother researching their our side of the argument.
Jo, could you PLEASE write an easy to read article (as you’re awesome at doing) about how much this movement is costing the world?
Warmists constantly talk about the “risks” of Climate Change and taking no action.
Warmists forget the fact that there are over 15 million children per year that die from starvation.
http://library.thinkquest.org/C002291/high/present/stats.htm
“Throughout the 1990’s more than 100 million children will die from illness and starvation…”
http://library.thinkquest.org/C002291/high/present/stats.htm
(bit of an old stat but still relevant)
But instead of dealing with the top risks to world health as defined by the World Health Organisation, (of which climate change ranks last and second last)
http://wattsupwiththat.com/2009/12/02/goklany-on-copenhagen-and-climate-change-health-risks/
We’re channeling ALL of our energies into stopping Carbon from being sent into the atmosphere… even though people in the world are dying of starvation and many other diseases.
Note from that article:
“Unfortunately, the United Nations family of agencies, aid agencies, and global “Humanitarian” agencies also subscribe to the notion that climate change should be given priority above other unsolved problems. Not surprisingly, therefore, at the World Food Summit earlier this month, about 60 heads of state and dozens of ministers rejected the U.N.’s call to commit $44 billion annually for agricultural development for developing nations.
According to the Associated Press, the UN Food and Agricultural Organization’s Assistant Director-General Alexander Mueller said that governments kept away from firm commitments to reduce hunger, “due to the economic crisis and because they expect they will need to channel money to the developing world at next month’s summit on climate change in Copenhagen.””
21
If the reaction here in the states to the current administration’s reckless spending habits is any indication, then you’re right on the mark.
However I don’t think it can hurt to talk about the science as well. Spending too much money on bad science will be even better received than spending too much money on what is otherwise believed to be good science.
20
This in particular is a total smokescreen issue. Why would you bother if you have your hotspots and your CRU emails trot out the 800 year lag issue. Surely no-one here is in doubt there are many many factors that have an impact on climate and have done so in the past? These cycles are completely acknowledged by climate scientists.
To someone like me, it is stuff like this that certainly makes me very sceptical of any arguments put up by the contrarian side of the AGW debate.
22
What a vacuous nothing of a remark.
Since you have not used the terms “cause” or “effect” in your response you have not even remotely addressed the issue.
You are skeptical of the contrarian view of AGW?
Haha what an ingenious use of a doublethink double negative.
20
I like playing “What-If”
What if supporters of AGW are right? What if they win their argument?
What if they ban anything that produces CO2 (apart from people – I don’t suspect many of them are ready for martyrdom, just yet)?
What if the energy industry, and the industrial complex was to be dismantled as a result?
What if the temperatures do decrease? What if we can’t stop the decline in temperatures? What do we do then?
Most people who have served in the military will know that higher temperatures are extremely uncomfortable, but survivable. They also know that prolonged exposure to freezing temperatures shuts down your metabolism and you die.
In the paleoclimatic frequency of such things, the world is slightly overdue for another ice age. It could even have started already with the drop in temperatures over the last decade or so, your guess is as good as mine, and both are probably better than the CRU and Penn State climate scientists could manage.
At the moment we have some of the technology and infrastructure that we would need to survive a prolonged cold period, but if all of this is dismantled for fear of warming the temperature …?
Just idle thinking …
30
Baa Humbug,
Your point about “follow the money”, as a psychological tool in countering AGW hysteria, is a good one but I think the punch line from the Climate Skpetics Party’s TV ads for the recent byelections, “You have been conned!”,is even better.
There is room for nuance!
20
@Mattb Your logic doesn’t make sense.
Your first assumption is of course that Jo only writes to people who have read all of the science out there and have been on top of what’s going on for the last 10+ years.
You: “Surely no-one here is in doubt there are many many factors that have an impact on climate and have done so in the past? These cycles are completely acknowledged by climate scientists.”
Jo’s article:
“The lag in the ice cores is old news to skeptics, but most people in the public still have no idea.”
“Even tonight, I did a radio interview for NewstalkZB, New Zealand, and the pro-climate scare spokesman still referred to both the fraudulent Hockey Stick Graph and the Vostok Ice Cores as if they helped his case.”
Obviously acknowledged by climate scientists right? except for the guy above of course.
Jo’s site isn’t just for people that troll her site and other scientific debate sites constantly. It’s for people who want to easily view and read the science of the skeptical catastrophic agw side of the argument… in very laymen’s terms. And a lot of people have only recently started to read all about it which means that the way Jo’s delivering her work is fantastic!
I even have a Catastrophic AGW believer friend who didn’t know that the Ice Cores data showed that CO2 lagged temperatures. He was under the assumption that it was a leading indicator.
And he claimed that he’d researched both sides.
And again you: “This in particular is a total smokescreen issue”
Not a smokescreen at all. It disproves most common people’s assumptions that CO2 is a leading indicator of Temperature, implied by Gore. Like I said, most people haven’t started to really dig around the climate science properly till recently.
Jo publishing articles such as this also reminds EVERYONE of what’s “consensus” and what’s not. Especially what’s been put out into the public forum, accepted, swept under the rug and out of peoples sight and mind.
And it sure helps skeptics like myself in arguments when I can link great articles like this to those that argue the catastrophic agw side, especially when they misquote studies into ice cores.
Some also have such short attention spans they don’t bother to read my links unless they’re in easy to read formats such as Jo’s site 🙂
20
Due to the 800+/-200 year lag, seems that some of today’s increase in CO2 levels today could come from hotter Medievil Warm Period (~600 years ago and now manifesting the rise).
What about that?
20
@MATTB
Dude,
Put down the Koolaid. Although you have never demonstrated the ability to make an intelligent argument I will, as the kind hearted person that I am, try to help you. If CO2 caused temperatures to rise CO2 would rise first and temperatures would follow, get it? Instead, it is the opposite. Saying that CO2 causes temperatures to rise is analogous to saying that cancer causes smoking. I believe that your obtuseness is feigned. Try therapy. Being a fair minded guy I am giving you an opportunity in front of God and the entire world, to cite one piece of empirical evidence that man has caused temperatures to rise. Please go to http://www.nizkor.org/features/fallacies/ and learn about logic and deductive reasoning. After that, please reply and try to avoid fallacious reasoning.
Examples of smokescreen would be the criminals at the CRU obstructing FOI requests, altering data, acquiring taxpayer funds through fraudulent inducements, corrupting the peer review process and conspiring to prevent other scientists from making their case. There never has been a debate on national TV in the entire world. However, the one hosted by IQ2 in New York and the one held at St. Andrews College in Edinburgh, Scotland were won by the skeptics. No wonder they keep saying the debate is over! Do not disappoint me, Matt. After all, I have just spent two minutes of my valuable time trying to help you see the light. Approach the light of deductive reasoning with confidence. Remember, when the blind (the IPCC) lead the blind (you, of course) both shall fall into a ditch. I will keep you in my prayers. BTW, the hotspot posited by global warming says that the upper troposphere should warm at a faster rate than the surface temperatures, but it hasn’t happened. Another nail in the AGW coffin, RIP!
40
Need a laugh? The late George Carlin sticking it to the GREENIES. I split my sides. Comedy yes, but the underlying message is soooo true
http://www.youtube.com/watch?v=eScDfYzMEEw&feature=player_embedded
20
G’day there Eddy,
Don’t waste time trying to convince MattB.
Watch this vid of Monckton talking to a ‘greenie’. He even tells her not to believe even him, rather to check the unadulterated data.
She’s drunk so much of the ‘Kool-ade’ though, she’s probably beyond redemption. Nothing would change her mind, same as mattb.
http://eclipptv.com/viewVideo.php?video_id=8907&title=Lord_Monckton_adresses_a_Greenpeace_campaigner_on_global_warming
40
@mark
Thank you for your kind words. Although you are probably right I had to try. I believe there is always hope. Sometimes, miracles happen!
30
@Mark
Thank you for the link. I wish I had Viscount Monckton’s patience. He is a class act all the way!
30
Eddy in 18… how disingeneous of you… you give me the chance to cite evidence in front of a non-existing entity?
Surely if the hotspot was there to your satisfaction you’d still not take it as evidence… just corrolation with a model?
Now to your 1st point… “If CO2 caused temperatures to rise CO2 would rise first and temperatures would follow, get it?” – well no, as you are hopefully well aware there are many things that cause temperatures to rise and fall, none of which relate to CO2, so there is no reason to believe that the AGW theory would require that all temperature increases in history have been preceded by or caused by increased concentrations of GHGs in the atmosphere. geddit?
“Sir no! not at all – being buried alive will not kill you. Look at everyone in this graveyard – for them being dead preceded being buried, so why would you think that my burying you would kill you?”
21
Hi folks
Can anyone point me to evidence of someone who was either a warmist or agnostic who has then read this blog and become a skeptic?
20
Me.
30
and me.
30
Yes me. And I have the evidence and data to prove it but will not share it with you because you only want to prove me wrong. A FOI request will not work either, I will destroy the data. So it’s over to you to prove it yourself and don’t think you’ll be able to publish your results in any of the well respected peer reviewed journals either. I know the editors quite well. Say no more…wink, wink…nudge, nudge.
30
Someone (who I shall keep anonymous) sent me this direct a few days ago (I do love getting these kinds of emails!):
Hello Ms Nova,
Thank you for producing your Skeptic Handbooks 1 & 2 …you changed my mind about AGW .
Check out this site
http://scienceandpublicpolicy.org/commentaries_essays/copenhagen_climate_concerns.html
Explore this site to understand the forces behind the IPCC and the COP15
There is another meeting going on at Copenhagen…and they are not discussing climate change …but world order .
The bulk of the article is a sales pitch but enough is being told of a meeting that I have not heard reported …but then again if its secret then why would we ?
Could be that Global Warming is the “Trojan Horse ”
Yours Sincerely, Geoff
30
MattB – you don’t get it do you? The hotspot – if it was there, would make me concerned about carbon emissions.
It would show that there was a booster effect from water vapor which would feedback and increase the warming.
I don’t need a model to tell me that the hot spot matters.
But it would lend credibility to the models. They would not be instantly disproved by that one flaw.
30
Phagor – while not this blog in recent times I have been convinced of the merits of nuclear power and high-rise/skyscraper residential development through interaction on blogs.
21
Also Jo – no I don’t get it, and I’m not alone. Maybe I’m crazy but I find it difficult to believe that mainstream science is just pretending it (hotspot or lack thereof) doesn’t matter and hoping it goes away (or turns up as the case may be).
21
@mattb
You said: Eddy in 18… how disingeneous of you… you give me the chance to cite evidence in front of a non-existing entity?
Surely if the hotspot was there to your satisfaction you’d still not take it as evidence… just corrolation with a model?
Now to your 1st point… “If CO2 caused temperatures to rise CO2 would rise first and temperatures would follow, get it?” – well no, as you are hopefully well aware there are many things that cause temperatures to rise and fall, none of which relate to CO2, so there is no reason to believe that the AGW theory would require that all temperature increases in history have been preceded by or caused by increased concentrations of GHGs in the atmosphere. geddit?
“Sir no! not at all – being buried alive will not kill you. Look at everyone in this graveyard – for them being dead preceded being buried, so why would you think that my burying you would kill you?”
Matt, obviously you didn’t go to the website I suggested to learn about deductive reasoning. Lets take your comments point by point. You said that I was “disingeneous.” Maybe they spell it different in Australia but I always spelled it disingenuous. Actually, I was being sincere. You were vague and didn’t specify what the “non existent entity” was. If you are saying that temperatures did not rise before CO2 then you are ignorant. Don’t worry, ignorance is vincible. Every ice core, not just the Vostok data, show that temperatures rise before CO2 levels. Since CO2 levels do not rise first they cannot cause temperatures to rise. Since the “entity” exists you are in error. You said, “as you are hopefully well aware there are many things that cause temperatures to rise and fall, none of which relate to CO2, so there is no reason to believe that the AGW theory would require that all temperature increases in history have been preceded by or caused by increased concentrations of GHGs in the atmosphere. geddit?” True, there are many reasons for temperatures to rise and fall. You said “none of which relate to CO2.” As Al Gore showed so brilliantly in his propaganda movie “An Inconvenient Truth” there is a correlation between CO2 and temperatures. But Al Gore lied by omission. Again, temperatures rise first and CO2 follows by 800 +/- 200 years and the temperatures drop 800 +/- 200 years before CO2 levels decline. If it rained tomorrow when the sun rose that does not mean that the sun rising caused it to rain. However, EVERY ice core shows that CO2 lags temperature movements by 800 +/- 200 years. You are correct when you state “as you are hopefully well aware there are many things that cause temperatures to rise and fall, none of which relate to CO2″. The only reason CO2 goes up AFTER temperatures rise is that the oceans, the largest carbon sinks by far on the planet, outgas CO2 as ocean temperatures rise and the oceans absorb more CO2 as ocean temperatures decline. The reason for the 800 year lag is that oceans take much longer to warm or cool than the atmosphere. So you are correct, there is no relationship between CO2 and temperatures. Perhaps you should write the IPCC and reveal your discovery to them? Do not be surprised if they disagree with you. The current atmospheric CO2 levels, with the exception of the Carboniferous Period, are extremely low. During the late Ordovician period approximately 350 million years ago CO2 levels were 4,400 parts per million, more than an order of magnitude greater than current CO2 levels and we were in the grips of one of the worst ice ages the world has ever seen. According to the AGW theory every bit of ice on the planet should have melted, but it didn’t. In fact, the geological record shows that CO2 levels do not cause an effect on temperatures. This is true because the effects of CO2 are logarithmic. The per unit effect declines with every CO2 molecule emitted into the atmosphere. In fact, the first 20 ppm of CO2 has more of an effect on temperatures than the rest combined. Do they have a science channel that you can watch in the land down under? You are also correct in assuming that if you buried me it would not necessarily kill me. However, your full statement, “Sir no! not at all – being buried alive will not kill you. Look at everyone in this graveyard – for them being dead preceded being buried, so why would you think that my burying you would kill you?” You used quotation marks, who were you quoting? The statement is fallacious and therefore illogical because it is a deductive fallacy. You said “for them being dead precedes being buried.” You assumed that the person buried was dead. Although this is true in most cases some people have been, either intentionally or accidentally, buried alive. Then you said ” so why would you think that my burying you would kill you?” You didn’t bury me as I am still quite alive as my response shows. You do, however, keeping digging yourself in deeper and deeper(pun intended.) Do you see why you need to go to the website I so graciously recommended to you and learn to reason deductively? Oh, and where is that empirical proof that man is causing most if not all of the recent warming? By recent I mean the warming that ended a decade ago. It is amazing that not one model forecast the lack of a rise in temperatures which has occurred recently. But then again, none of the models agree with each other. Again, using logic that means that at most one might be correct. However, since the models have made erroneous projections and forecasts they cannot be used as objective empirical evidence. You also said, “Surely if the hotspot was there to your satisfaction you’d still not take it as evidence… just corrolation with a model?” That is fallacious because I never said that. It is called a straw man. Now Matt, learn how to reason deductively and then you may be able to say something intelligent. Lenin use to refer to those who blindly believed as useful idiots. I am sure you are smarter than that, aren’t you?
40
Mattb – you’re still fooled by the PR that says “there is a consensus”?
There’s only 60 scientists in the IPCC AR4, many turned out to be cheats and frauds. Most of the rest have a vested interest.
We can name 31,000 scientists who stake their name on the theory being wrong including 9000 PhDs.
We can point to evidence of major errors.
and points of their own documents that show they are wrong.
We can point to evidence of collusion and fraud, falsification of data.
So what you need is a Media Release from the IPCC saying “Oops, we promoted and lauded a small cabal of dishonest guys who liked the fame and money but who falsified results and hid inconvenient data. Our mistake. We obviously didn’t check their science well, and have been caught out as a self promoting bureaucracy. I rajendra pachuri promise to donate all my profits from my own carbon investments to the new “committee for scientific ethics” that independent blogger scientists have formed.”
Matt can you at least admit that there is no information we could give you that would change your mind, since you need to hear an admission of guilt from one of the corrupt organizations themselves?
40
MattB:
Joanne likes people to be polite, so this statement replaces some comments that would likely have brought a frown to her brow. But you will understand the underlying message from this disclaimer, even if you publicly wish to deny it.
Simplifying things a bit, the scientific method call for observation, hypothesis, experimentation, and prediction. The green house hypothesis (Hansen, et al) underpins the AGW hypothesis. It predicts a warming of water vapor in the upper troposphere from CO2 re-radiation, causing an observable hot spot.
Now, the “hot spot” prediction might be fulfilled at some time in the future, but to date, there has been no evidence of a hot spot forming, and thus, the AGW hypothesis is not supported.
So, right now, the science is far from being proven, and will remain so until such time as a hot spot appears.
I simplified the scientific method, by the way, by leaving out considerations of empirical evidence; release of both raw data and “value added” data (whatever that means); open publication of methods, calculations, and analysis; and independent peer review comments. I left them out because this branch of science seems to rely on consensus (via a ballot?) rather than a process of critical debate, based on demonstrable facts.
How is your brow, Joanne?
20
Mattb #23 you said
“well no, as you are hopefully well aware there are many things that cause temperatures to rise and fall, none of which relate to CO2, so there is no reason to believe that the AGW theory would require that all temperature increases in history have been preceded by or caused by increased concentrations of GHGs in the atmosphere. geddit?”
I’m afraid the IPCC will disagree with you on that one.
I posted about this before. In the 4th assessment report, summary for policy makers (you can download at the IPCC site) page 4. You will see a figure spm2.
This figure lists all the radiative forcing components. But most importantly, they RATE each forcing in the last column as Level Of Scientific Understanding (LOSU)
The NITTY GRITTY…Of the 11 forcings listed, 4 are rated HIGH LOSU. Unsurprisingly they are GHG’s. 1 is rated as MEDIUM LOSU and 6 are rated as LOW or medium LOW.
The most important external forcing, the SUN is rated low understanding.
Unsurprisingly then, the 18 plus climate models used ONLY PREDICT RISING TEMPS when GHG’s are included. (IPCC’s own comment)
So, according to the IPCC, AGW theory DOES INDEED REQUIRE CO2 to DEMONSTRATE TEMP. INCREASES.
I hope you will contact the IPCC and tell them how wrong they are Mattb, coz according to you (correctly) not all temp. increases are caused by GHG’s. Good luck in convincing them.
p.s. Eddy #30 I’m also an Aussie, so go easy on the negative nationality generalisations pls
10
@ Baa Humbug,
I meant no disrespect to Australians. I am unaware of any negative generalizations in my comments. My comments were addressed to a particular individual and not to “Aussies” as a whole. As a matter of fact, Australia and its people have always fascinated me. It is both a country and a continent that I have wanted to visit for sometime. Well, it is getting late here in California and I need to get some sleep. Good night everyone!
20
Things are really hotting-up (pun) in Copenhagen. If I was a fly on the wall, here is what I might hear.
Bzzzzzzzz into the DEVELOPING world meeting room.
“Now if we hold out a little longer, we’ll get quite a bit more billions out of those smug rich ba*#ards, and we got those dirty filthy flea riddled greenies on side. Haha ha did you see them riot out there? the bloody westerners hate that. I reckon we hold out some more and threaten to walk out. They’ll cough up, they seem to be happy to hand out money willy nilly”.
Bzzzzzzz into the developed world meeting room.
Mate when it comes to getting this carbon trading going, we don’t have much time. Our friends at the CRU have been able to bump up the temperatures for now (G Brown interrupts “I told them to make it the hottest decade ever haha ha) thanks Gordon, anyhow, they can’t hold out much longer, those bloggers are on to the data. I think it’s great those ba*%ards are rioting, it’ll legitimise our rush into an agreement.
How much more do we have to promise the greedy despots?
Brown: “Ohh I think the start up capital is the key, say another 10 Billion totalling 20, we can delay the rest of the payments at least untill 2025, we should have a nice little earner by then.”
“OK then, when it comes to announcements, we’ll say it’s encumbent on us to help developing nations yada yada yada and refer everything else to the next meeting in Mexico, all agreed?
“areeba areeba” “yippa yippa” “You’re so funny Gordon. Couldn’t we hold it somewhere with better food, that Mexican sh#t goes right through me”
Brown: “Count your lucky stars, India wanted the next one”. A chorus of them “no stuff that” “oh god no” “oh the smell”
bzzzzzzz out I fly
10
Hi Jo,
There is a more subtle point that I’d like to make about the Ice Core data that is usually overlooked. This point is also independent of what came first CO2 or temperature change.
From your first graph there is a period between 140,000 and 125,000 years ago where CO2 increases from (roughly) 190 PPM to (roughly) 290 PPM and temperatures increase from around -9C to about 3C. About a 12C change in Greenland temperatures.
P Chylek in “Ratio of the Greenland to global temperature change : Comparison of observations and climate modeling results” Finds a ratio of 2.2 of Greenland warming to global warming. So our best estimate would be the world warmed 12/2.2 = 5.45C.
Now, according to the IPCC’s best estimate, a doubling of CO2 should lead to a increase of 3C in the global mean temperature anomaly. Or mathematically the temperature forcing from the increased CO2 could be expressed as T = (3.0/log(2))*(log(C))-9.39. The 9.39 just “normalises” the earth’s temperature to 15C at pre-industrial CO2 concentration (280 ppm).
Now from the ice core data we have a change of 100 PPM which, according to our formula, should lead (roughly as this was eyeballed) to a 1.83C rise in temperatures. Yet we had a 5.45C change! So even if we assume that the IPCC’s best estimate is accurate (of which I have my doubts) there was something else out there that caused the other 2/3rd’s of the warming. If we use Lindzen’s value of 0.5C for climate sensitivity then it only accounted for 0.3C of the 5.45C warming.
Either way CO2 was not the main driver of the interglacial temperature changes. Something else was.
20
Baa Humbug #33
I am glad you made that point about the LOSU in AR4.
Of course. The ratings are totally correct! The Team have been focusing on GHGs so they assume that they have a high understanding of them.
But they know diddle-swat about the sun, so they ignore it as a potential forcing. And they have even been honest enough to admit it by hiding it in the numbers.
I wonder how many governmental policy units around the world missed the subtlety, and assumed that the numbers showed a relative level of importance?
20
Eddy Aruda #34
Can we please cut with the Australia is a continent stuff? The continent is Australasia. It includes Australia, New Zealand, and Norfolk Island.
/rant
10
Eddie,
If it makes you feel better, I didn’t take offence at your post, you simply made points that are perfectly apparent to all here except mattb.
I asked him in another thread some time ago if there was anything that would cause him to change his mind and he still hasn’t responded. Therefore, he’s just a troll.
He comes here because, in spite of the opinion gap, he finds us much more interesting and better to converse with than his own band of Taliban zealots!
20
Hi Rereke
I’m quite certain the government wags didn’t bother reading anything other than the first 2 pages. Once data and figures start as of the last paragraph of page 2, they would have tossed it over to their aids. Here in Oz, our Climate Change Minister (man I h8 that title) Penny ( Calamity Jane ) Wong was questioned at length in the senate about the details of IPCC reports but continually obfuscated (spell?)
Must shut p shop and go home, back later 🙂
20
Whats happened to the troll Marion whatisname? I was enjoying her Dr.Evil style sneering comments.
20
Money is a good angle indeed, but funny how it was already an issue. In Australia when the ets was blocked, PM Rudd would have noticed that not many people got too upset. It was strangely silent, even ets barrackers in the media were a bit muted-shocked. Where were the condemning howls from the public over the immoral behaviour of the opposition? Why did so may hold their fire? It seems ets has very few friends in reality, or the business end of carbon reduction was always going to be the hard part. It was easy politics up until now and Copenhagen illustrates it, and Rudd will be feeling that – I think he has a tiger by the tail.
Post Copenhagen what will the big traders do? At what point down the track do those carbon credits become a bad investment. If I had bought some I would be twitchy right now with an ear to negotiations in Denmark, so maybe we might see a bit of SELL SELL SELL at some stage. If a market based soultion turned out to be the death of it…….. would be fitting.
10
Absolutely Mark in 39 – I certainly learn plenty here, it is why I come. I enjoy the conversation and like the personalities. Sorry if I missed that question… there are lots of things going on. I honestly can’t tell you what would convince me, no. If you had asked me a year or two ago what would convince me nuclear power was a safe and cheap option to power the planet I would not have been able to tell you yet here I am converted on that front. I honestly don’t think I could be convinced that CO2 is not a bit issue, unless it was a pretty clear cut science breakthrough. I have faith enough in the system that such a breakthrough could not be suppressed. Maybe the answer to your question is I would be swayed by something that I could not find a satisfactory counter argument for – something that has not happened yet re: GHGs even the hotspot. The “just one paper” thing is interesting, but it requires dismissal of any evidence as being “not-evidence” and then I guess as I;ve explained before no I have nothing that is not in the real of freely available published science – I’ve got nothing up my sleeves.
For example, We know we were lied to about WMDs in Iraq, that charade didn’t last long, I don’t see how this one would be any different. WMDs only needed to last long enough to go to war… but this one would need years and years of successful deceit on a much larger scale, I don;t think even the UN is capable or competent enough to manage that.
You call me a troll but my public identity is available for all on this website (although my name reverted to Mattb when I reverted to an old computer my name is Matt Buckels).
11
Hey Rereke:
“Australia is the smallest of the geographic continents, though not of geological continents.[1] There is no universally accepted definition of the word “continent”; the lay definition is “One of the main continuous bodies of land on the earth’s surface.” (Oxford English Dictionary). By that definition, the continent of Australia includes only the Australian mainland, and not nearby islands such as Tasmania or New Guinea. From the perspective of geology or physical geography, however, a “continent” may be understood to include the continental shelf (the submerged adjacent area) and the islands on the shelf, which are taken to be structurally part of the continent. By that definition Tasmania, New Guinea and other nearby islands such as (Aru Islands and Raja Ampat Islands) are part of the Australian continent, also known as Sahul, since they are part of the same geological landmass. These islands are separated by seas overlying the continental shelf — the Arafura Sea and Torres Strait between Australia and New Guinea, and Bass Strait between mainland Australia and Tasmania.
When sea levels were lower during the Pleistocene ice age, including the last glacial maximum about 18,000 BC, the lands formed a single, continuous landmass. During the past ten thousand years, rising sea levels overflowed the lowlands and separated the continent into today’s low-lying semi-arid mainland and the two mountainous islands of New Guinea and Tasmania.
Geologically, the continent extends to the edge of the continental shelf, so the now-separate lands can still be considered a continent.[2] Due to the spread of flora and fauna across the single Pleistocene landmass, the separate lands have a related biota.
New Zealand is not on the same continental shelf and so is not part of the continent of Australia but is part of the submerged continent Zealandia. Zealandia and Australia together are part of the wider region known as Oceania or Australasia.”
10
by the way guys this is my current preferred myth debunking site: http://www.skepticalscience.com/ I note they don;t cover “breaks the basic laws of thermodynamics” and have asked them to look in to it for Lionell and me.
here is there take on the lag: http://www.skepticalscience.com/co2-lags-temperature.htm
and here is the take on the hotspot: http://www.skepticalscience.com/tropospheric-hot-spot.htm
and empirical evidence: http://www.skepticalscience.com/empirical-evidence-for-global-warming.htm
10
Hi Jo, I was looking at the GATA Global Average Temperature Anomaly plot shown on the IPCC AR4 reports – the one that shows the increase in temperature of 0.8C from 1850 to recent. Apart from the issues with the adjusted data they use, I also noticed that they include what I assume is a blue shaded error margin around the plot. The point is that back in 1850 the IPCC are suggesting that they could measure the GATA to an accuracy of +/- 0.1C. I’ve been thinking about the errors involved and think this is very unlikey. Apart from the issues of Urban Heat Island (UHI) discussed here http://www.surfacestations.org/ there are a number of other errors inherent in the measurement, such as:
1. Calibration error – if temperatures are read to the nearest 0.1C then the error has to be at least +/- 0.05C;
2. Averaging error – today automatic weather stations take measurements every minute or so, so the daily average is pretty accurate, but back in 1850 the measurements were manually read and may have been as little as the minimum and maximum temperature for the day. Using only these two points for an average can misrepresent the average temperature.
3. Point readings – the GATA is calculated by dividing the earths surface into a grid of squares of equal area. There is error introduced in using one or several point temperatures to represent the whole area. There were also a large number of the squares that had no temperature measurments e.g. the oceans and Antarctica.
4. Equipment variation errors – variations in the thermometers and Stevenson screens used would also introduce errors.
When you combine all these errors, along with the UHI effect, the error margin for the early 19th century readings may be greater than the recorded increase of 0.8C over the past 150 years. If this is the case then we really can’t draw any conclusions from the temperature records, and other proxies may provide a better indication. Just because it’s a number we seem to afford it greater accuracy, when it may not be accurate at all. Another example is on the ABC graphic shown at
http://www.abc.net.au/innovation/environment/cc_timeline.html
If you click on the year 2000 thermometer symbol it gives an average temperature of 14.53C, which erroneously implies an accuracy to the 100th of a degree.
Do you know of a reference or source where this is discussed in more detail?
10
Hi Leigh #46
May I suggest this site
http://www.john-daly.com/ges/surftmp/surftemp.htm
Very very detailed and a must read I believe.
Also on the site are numerous articles and papers. Weeks of happy knowledge gathering 🙂
10
To all,
The name Marion makes him male not female. I can assert this with great confidence since Marion was my grandfather’s given name.
As to whether Marion Morrison is his true name or not we can’t know and so must take it at face value.
I will also suggest that it’s pointless to make fun of anyone’s name, whatever it may be. We should operate on a higher level than that. I took issue with what he said and responded with my opinion of what his contribution was worth. But his name should be off limits. I didn’t miss the connection with John Wayne but would never say it.
10
Oh Matt Matt Matt, your preferred myth debunking site has a hockey stick. Hasn’t the whole world been told for years now NOT TO PLAY WITH HOCKEY STICKS.
But seriously Matt, if you are really serious about CO2 and wish to get some info from a man who has studied ice cores for 40yrs I suggest this paper (written for the US Senate)
http://www.john-daly.com/zjiceco2.htm
10
Totally agree Roy
10
Oh boy, Matt you got2 give up on your preferred myth busting site, it’s going to corrupt your brain. I just read the article “Was there a Medieval Warm Period” and guess who is sited as the expert??? MICHAEL MANN (as I try not to fall of chair laughing)
And look at the graphs, they are depicted as soooo accurate, he can pinpoint temps. in any corner of the world (as he picks himself up after falling off the chair) OH OH and look, both the MWP and LIA maps show Nth Atlantic just south of Greenland as the warmest of all by a stunningly accurate 0.8c.
The mann (pun) must be given a Nobel of some sort, heck, give him ALL the Nobels, this stuff isn’t just science, it’s frigging poetry, it’s art, there’s chemistry between the MWP and LIA, give him the peace Nobel as well coz anybody can win that nowadays.
Matt us Aussies are always good humoured, thankyou for the laugh.(oh my sides hurt) 🙂
20
[…] link to whole article December 15th, 2009 | Tags: c02, climate change, global warming, Ice core, science | Category: science […]
10
Leigh #46, Wow, I had no idea the ABC had so much money to spend on creating PR for the UN, but no money to pay one investigative reporter. That link is really too much.
Global ave temp in 1820 was 13.72!!
There wasn’t even a global thermometer system in operation, and not too many satellites either, how do tehy know it wasn’t 13.73?
http://www.abc.net.au/innovation/environment/cc_timeline.html
11
I just asked my cat about that and he said the actual global average temperature in 1820 was 13.1998!!
10
MattB:
The more you spout, the more your credibility diminishes. On ANY subject.
Aside from being an apparent shill for the LapDog media, you’re a good proof of Eric Hoffer’s “True Believer”, – one cockamamie fad after another.
You’re much,much closer to Richelieu than to Einstein.
20
@ Roy Hogue
Marion Robert Morrison was actor John Wayne’s real name.
10
Eddy,
Thanks for that bit of information. If it matters, my full name is Roy Willis Hogue. I have my paternal grandfather’s first name — Roy Virgil Hogue — and my maternal grandfather’s middle name — Marion Willis Mills.
But my point is that a name is not ours to make fun of. It’s a means of identifying and addressing an individual. Aside from the value family places on names — and I wear my grandfathers’ names proudly — they have no particular significance. To you my name has no meaning other than to identify me. But to me and my family it has a real significance and a connection to our past that means a lot. So it is with Marion Morrison who posts here. It behooves us to realize that and not make fun of his or anyone’s name.
I rest my case. Please, no more on the subject.
10
Joanne,
I’m very glad your efforts have finally taken on. Visiting your site and seeing all those comments makes me so glad. You must have thousands of visits now. I bet that’s twice as last year’s, at least.
I’ll give a small conference about global warming in school. What they don’t know is I’ll rather tell everyone it’s a fiasco. After reading the manual again and again, I’ve turned into a great skeptic!
My kindest regards,
Víctor González
20
@ Roy Hogue
In America, most of us are of mixed decent (Irish, English, French, Italian, etc.) My posted name is my real name. Now with the advent of software that helps you trace your ancestry many Americans are researching their past.
10
Eddy,
Absolutely correct. We are a mixture of just about the whole world.
But this gets farther and farther from the topic here. Hence my plea, no more on the subject. It’s not personal at all, just a reality check.
Thanks
10
Scientists now out to squash suggestions that our climate is affected by the sun’s cycles…
Boy, do I feel silly or what! The sun??? Affects climate??? Pffftttt!!!
Now, if they can only explain what’s causing the rest of the solar system to warm up, too…
20
Ooops, wrong link! My bad!
Mars heating up, too…
10
MattB #45
I love the comment about the (non-existent) hotspot:
“Satellite measurements match model results apart from in the tropics. There is uncertainty with the tropic data due to how various teams correct for satellite drift. The U.S. Climate Change Science Program conclude the discrepancy is most likely due to data errors.”
Translation: “OMG the satellite data does not match the models over the tropics – we must adjust the satellite data so it does”.
I wonder how the satellite knows when it is over the tropics?
10
Juliet:
“What’s in a name? That which we call a rose
By any other name would smell as sweet.”
Romeo and Juliet (II, ii, 1-2)
Attributed to William Shakespeare 1564 to 1616
10
Thanks Baa Humbug #49, and Joanne #53 for the feedback and reference to John Daly’s Web site
10
Springer: #61
I take it your comment was made around a tongue that was firmly in your cheek?
MattB: #45
In regard to the solar cycles, the work of Henrik Svensmark has produced some real empirical evidence. He has physically demonstrated the formation of clouds by cosmic energy in the laboratory. A real, old-fashioned experiment!
Compare that with this logically flawed statement you referenced in #45, in regard to empirical evidence:
“Direct observations find that CO2 is rising sharply due to human activity.” [Two assertions here: CO2 is rising, and human activity is the cause; but there is no suggestion of how these two things might be connected – it is begging the question.]
“Satellite measurements find less energy is escaping to space at CO2 absorption wavelengths.” [So is the level of energy being retained increasing, or remaining constant? Curious people would like to know. You see, the green house hypothesis assumes that each CO2 molecule will re-radiate its heat when it gets to the upper troposphere (positive forcing). But, of course that re-radiation will be in all directions, so we would expect to see an increase in energy being radiated into space, in the presence of the greenhouse effect, not less]
Ocean and surface temperature measurements find the planet is steadily accumulating heat. [Yes, the world has been naturally getting warmer – we are still coming out of the Little Ice Age – this is an inconvenient truth that Mann et al have worked hard to hide.]
There is direct empirical evidence that human CO2 emissions are causing global warming. [This is an assertion that cannot be drawn as a conclusion from the preceding statements – again, it is begging the question.]
10
Thanks for bring this up Joanne.
I have been meaning to ask – What do the alarmist say about this? Well Bob Ward on http://www.climateofdenial.net/?q=node/7
wrote this (and a lot more) in response to the film The Great Global Warming Swindle.
“The paper by Caillon and co-authors examined the timing of changes in atmospheric carbon dioxide and temperatures during the Termination III deglaciation event about 240,000 years ago. The main finding of the paper was that “[t]he sequence of events during Termination III suggests that the CO2 increase lagged Antarctic deglacial warming by 800+/-200 years and preceded the Northern Hemisphere deglaciation”.
In fact, the paper by Caillon and his co-authors concluded that a fluctuation in the Earth’s orbit (and hence its distance from the Sun) initiated the increase in surface temperatures in Antarctica, and was followed by a gradual warming of the oceans, which released substantial volumes of carbon dioxide that was dissolved in the sea water. The paper also indicated that the carbon dioxide released by the oceans added to the warming of the atmosphere, and contributed to the deglaciation of the Northern Hemisphere. It stated that the sequence of events during the Termination III deglaciation is “still in full agreement with the idea that CO2 plays, through its greenhouse effect, a key role in amplifying the initial orbital forcing”.”
He also argues the science against the Medieval Warm Period, the missing hot spot. It is the first rebuttal of the arguments you raise that I have seen. I dont really want to place another mountain on your back, but arguing the science is what we really need to see. Are you familiar with his reasoning?
10
Hi Jayson.
I won’t get into any lengthy detail of the science but I will offer some food for reasoned logical thought.
If CO2 helps raise temps. which in turn releases more CO2 from the oceans which then raises temps. more, on and on ad infinitum, when does it stop?
This is called a “positive” feedback. Mankind is only aware of just one positive feedback in the universe, nuclear fusion (and not too sure bout that either)
If positive feedback existed, this planet would have been doomed billions of years ago.
The reason why we (all life forms) are able to survive on this planet is because it has many self correcting mechanisms, most of which we don’t fully understand.
Hence “modelling” any future climate predictions is no better than astrology or carnival side show tricks.
Hope this helps
10
I bought a seltzer maker which allows you to pump CO2 into a bottle of water to carbonate it. In the instructions they point out that the colder the water that is carbonated, the more CO2 it will hold, i.e. the more bubbly the seltzer. That little lesson taught me that water temperature change comes before CO2 is dissolved or released. Cold water absorbs more Co2; warm water releases more CO2.
Who needs ice cores?
10
Wayne (#17):
Your excellent observation should be devoted a lot more attention: maybe this is why the Team is so scared of admitting the existence of the MWP: not only has the climate been as warm (and warmer) before but the current level of CO2 is actually caused by the MWP affecting the ability of the oceans to store CO2!
10
Andy,
I suggested a simple experiment that requires no special equipment to a believer I’ve been trying to convince: put a cold bottle of 7-Up from the refrigerator next to a warm one and then just open them both. I suggested 7-Up only because it’s a clear liquid in which the bubbles can easily be observed. But any soft drink will demonstrate the point.
10
Three years ago, in response to the obvious crap in Gore’s AIT movie, I decided to immerse myself in the subject. At that time, the ice core lag was a hot button issue. What sealed my mind into becoming an affirmed skeptic was Gavin Schmidt’s lame post on RC, something along the lines of “Al Gore was Right!” Gavin went on to proclaim that while CO2 may lag in the early stages of a warming, that magically one day, poof!, it was suddenly the driver of warming. He then claimed this thereby debunked another skeptical argument, declaring it time to move on.
Particularly on this weekend, I have to say that I want to thank Gavin for a series of those lame, lazy and circular postings that convinced me that the RC crowd was only filling a propoganda niche. Thanks, Gavin.
10
Joanne, what do you think of this site;
Looks pretty convincing to me?
http://www.geocraft.com/WVFossils/greenhouse_data.html
10
Is the airborne fraction of anthropogenic CO2 emissions increasing? – 40% of CO2 stays in the atmosphere. C02 emissions from land use should be scaled to 82% or less of their original estimates.
http://www.agu.org/pubs/crossref/2009/2009GL040613.shtml
10
Arn Riewe:
December 20th, 2009 at 8:45
Yes Arn, there is a big problem for the Warmers; They try to explain the lag by saying that CO2
is “delayed forcing” or something along those lines. But that brings a big dilemma for them;
The lag is there when temperature decrease too. First temperature decrease, then 6-800 years,
then CO2 decrease too……In such a situation, if the forcing argument was true, what stopped
temperature from going up, CO2 going up, temperature going up, and so on? The runaway effect
they are so afraid of?
That didnt happen. A good proof for me, they are wrong.
10
I just ran across this research and thought I’d add it to your great article on CO2 and Temp from ice-cores. Its a shame the ice-core data is in 2-6ka increments. A record of volcanic activity would be helpful.
Its also odd that ice-cores haven’t been taken from the glaciers in Alaska. Why do they assume global conditions are the same in a glacial when they clearly aren’t due to the jet stream and currents?
Earth climate system results from integration and coupling of processes with various time scales.
http://www.scichina.com:8080/sciDe/fileup/PDF/01yd0926.pdf
10
[…] Ice core samples show atmospheric C02 lags behind temperature. […]
10
[…] about, there is indeed a link between carbon dioxide in the atmosphere and temperature…the opposite of the one he claims that everyone not paid to lie by oil companies knows to be the case). The media haven’t said […]
10
[…] years of “records” is not long. It was warmer 1000 years ago, 2000 years ago, 5000 years ago and 130,000 years ago. In fact its been warmer for most of the last 10,000 years than it is today, and it’s been warmer […]
10
I undoubtedly did not know that. Learnt some thing new today! Thanks for that
10
The most recent sustained warming is shown in the Vostock graphs section, as starting just over ~17,000 years ago, following a rise in CO2 which begsn ~18,000 yrs ago.
If this is true, it doesn’t follow the suggestion that CO2 rise lags temperature rise ?
10
Joe V: #81
So, If I understand this correctly, you are saying that 18,000 years ago, CO2 started rising, and this was followed, 1000 years later by an increase in temperature. What you do not mention, is that this rise in temperature has often been followed by a further increase in the rate of CO2 rise in the atmosphere, about 600 to 700 years later.
Both temperature and the level of CO2 in the atmosphere are cyclic phenomena, and although in engineering terms, the signals are very noisy, they do appear to follow a fundamental frequency where the two signals have a phase shift of around 600 to 700 years, where the level of CO2 lags the rise in temperature.
I have always wanted to do a Fourier analysis on the Vostok time series, but unfortunately I no longer have access to the sort of computing power necessary to cope with all of the distortions in the signal. I think that much could be learnt about the physical world if all of the constituent signals could be extracted and correlated with observations from nature.
10
Yes Rereke, @#82
Here’s the one that’s troubling me from Vostok page. That sharp upturn in temp commencing @~18,000 years ago.
It tends to defeat the argument when directing prospective converts to Jo’s Vostok pages & they look for the most recent example, this one.
10
CORRECTION
Yes Rereke, @#82
Here’s the one that’s troubling me from Vostok page. That sharp upturn in —
tempCO2 commencing @~18,000 years ago.It tends to defeat the argument when directing prospective converts to Jo’s Vostok pages & they look for the most recent example, this one.
10
Ah yes, now looking at source data , can see there are no data points between 17,700 and 14,000 years ago, so we cann’t actually tell when it turned. Pity.
10
Joe V.: #84
Yes, I see your point. Although, you have to admit that the correlation between the temperature and CO2 (even allowing for all the signal noise) is still pretty obvious. I think that the “problem” you identify is more a matter of scale than anything else. What we are seeing is the 8deg rise in temperature as we come out of the Little Ice Age, followed by a fairly consistent +/- 2deg fluctuation for the last 10,000 years. But on these sort of timeframes, and looking at the data on this scale, the thickness of the drawn line can be more than the signal variation.
Yes, there is an apparent up-tick in the CO2 level, and what appears to be missing is an equivalent up-tick in temperature either before or after the change in CO2.
But looking at the graph from an engineering perspective, what I see over the last 10,000 years or so is the “ringing” associated with some naturally limiting factor. If you are an audio buff, you will know the phenomena as “signal clipping”. You can turn the volume up as much as you like, but you won’t get more sound energy, only increased distortion.
The interesting thing to me is that the CO2 just keeps on going up, in spite of that limitation. And now it appears to be decreasing again, also in spite of the limitation. This implies that temperature and CO2 levels do not have any direct causation on each other, but rather both respond (in different ways) to a third external factor. The sun perhaps?
10
[…] JoNova.com Gunman in Arapahoe School Shooting …Duck Billed Dinosaurs Had Combs Like …Nokia and Guerrilla Marketing TacticsPokémon Bank Explanation Trailer …Instagram Direct: Send Photos & …Share this:PrintLinkedInPinterestStumbleUponGoogleFacebookTwitterPocketRedditEmailTumblrDiggLike this:Like Loading… […]
10