Four Corners has become TwoCorners — it represents both sides of politics — Green AndLeft
Brissenden has done no research, interviewed no critics, and asked no hard questions. When it comes to serving the Australian people, protecting them, and holding our government to account, he’s AWOL — promoting his own pet interests instead, hiding the scandals and critics. What do we pay him for?
The iconic show on the ABC won’t interview skeptics that walked on the moon or won Nobel and NASA prizes, but if a cherry farmer feels the climate is changing, send in the film squad!
After years of telling skeptics that you don’t ask a plumber to do heart surgery, the ABC “Weather Alert! last Monday was 90% plumbers.
The formerly iconic FourCorners “public affairs” show crafted a 43 minute advertisement for the Renewables Industry and Carbon Trading Bankers and the Green Blob. And we taxpayers paid for it all. As usual, most of their facts were correct, but only because they barely had any. The facts apparently are that at least four farmers across Australia have the feeling that their climate has changed and are “doing something”. Yeah. Plus a whole bunch of consultants paid to solve a crisis say there is a crisis to solve.
…
Witchdoctors from neolithic tribes used similar techniques to the ABC so-called journalists Sarah Ferguson and Michael Brissenden. In the stone-age, a Voodoo Chief would chant a list of recent weather porn (like Al Gore does now), then loosely connect it all with the evil new type of, say, cooking pot, (brought from his competitor). He’d follow it up with some Yes-Men “witnesses” who’d nod solemnly and declare they have seen the weather change since the new pot arrived. Voila, blame the pot for the storms, “see the light” and give the man some more conch shells.
…
Keep your eye on the pea. All the farmers are probably right about recent changes to the weather patterns, but like the cooking pot, there’s no cause and effect link between your air conditioner and earlier grape harvests. How do we know it’s not natural? Answer, broken “climate models”.
The ABC also gave time to APRA and the RBA — both notable climate science authorities (not) — who agreed with the IPCC. They interviewed (or rather, promoted) someone from a left wing think tank, the Special Counsel for Climate Risk from Minter Ellison, a consultant from “ClimateRisk” and a spokesperson from the industry body for insurance companies. All four of these specialists, predictably, were happy to help sell the topic that brings them more business. Could we imagine an insurance agent telling us that things are not going to be worse than we expect? Or how about a Special Counsel for Climate Risk that said the risk was inconsequential and her job was irrelevant? It’s a bit rich to call these “interviews” — no hard questions were asked. Much was made of the farmers historic weather books, but Brissenden didn’t ask to see their records from, say, Jan 1896 when a long heatwave killed hundreds across Australia and temperatures hit 50C in four states. He travelled around the country “over four months”, but didn’t find half an hour to phone one skeptical scientist, businessman, or lowly blogger who could have saved him from looking like a gullible patsy.
All the alpha-plumbers, I mean “experts” in something else, were followed by a yes-man who told the audience that the APRA or RBA “don’t make these decisions lightly” as if those organisations had done what even the peer review journals never did — check the actual data, replicate the method, get the same result. Did APRA or the RBA interview any skeptics? Don’t expect the ABC to ask.
We got the reverse osmosis version of the truth…
All up, this was the Agitprop star-list of filtered factoids. We got the reverse osmosis version of the truth — where 80% of the information goes down the drain, and the mineral-free-story gets presented to at least twenty or thirty Australians, or whomever is left that still watches this Pravda type predictable stuff. No wonder few commentators cite TwoCorners anymore. Everyone knows what every show will explain before it goes to air.
But wait, I hear you say, they interviewed a real climate scientist — Karl Braganza, the visionary modeler who can “see a direct link to extreme weather” through his crystal ball, I mean climate model. With his psychic gift he can see the real pattern hidden under error bars two miles wide with a skillless model (see the refs at the end). Sure, let him speak, but a real journalist might be able to find another expert modeler who can point out the dismal failure rate of the IPCC approved models, the inconsistencies and the fact that none of the models include any solar magnetic effect, solar wind, or changes in solar spectra. They might also mention that sun spots actually correlate with our climate — with the raw measurements — and on both the “up” bits and the “down” bits for the last 5,000 years. A real journalist might have asked Braganza how well his models predict all those past turning points? Australian voters who pay something like $600 a year per household for Renewable Targets might like to know that from the dawn-of-civilization up until 1979 his climate model’s success rate is “zero”.
The show opened by blaming the intransigence of the political system, which translated, is the ABC confession that after all these years of propaganda, the voters still picked the wrong people.
Rob Rogers, Deputy Fire NSW Fire service, conveniently said that modern records are so unprecedented there are “no records” of weather existing on that scale. Which — as we have seen from hundreds of historic weather reports is false — see the drought and death in 1896, and 1878, 1939 the fires of 1851 and the news of “Australia cooling” that came out in the 1950s...
Only a few weeks ago the BOM said the same thing about warming in Sydney and scored a lot of headlines, but had to retract it the same day when they realized it had still been hotter in Richmond in 1939. Not so unprecedented.
Braganza [BOM] explained that it is really only since the 1990s that we have started to see the extreme heat. What he didn’t mention is that a totally new method of measurement came into effect on 1 November 1996 – with the transition continuing, so each new year, additional weather stations have their mercury thermometer replaced with an electronic probe taking one-second spot readings.
Brissenden has done no research, interviewed no critics, and asked no hard questions. When it comes to serving the Australian people, protecting them, and holding our government to account, he’s AWOL — promoting his own pet interests instead, hiding the scandals and critics. What do we pay him for?
See the worst place on Earth for global warming — but hide bumper crops, cool summers and good rain
South West WA and Perth was made out to be the global posterchild for climate panic — “the changes here have happened faster and earlier than anywhere else on the planet”. ABC viewers won’t know though that the horrors of climate change mean we’ve had one of the coldest summers in two decades, a record surplus on a bumper grain harvest, and that our dams are fuller than they’ve been for years. These things are just “weather”, but so are most of the heatwaves and the storm surges that the ABC is pretending are prophetic “signs” of our guilt. Why is it OK to mention one kind of weather but hide the other kind?
” what a pageant of old wives tales mixed with assorted lies and exaggerations.”
Starting with the “Braidwood drought” was a dud move due to rain and floods a week or so ago in the region – so that should have been cut. Surely the show has staff that are half awake?? I mean Canberra flooded!!
ABC enables virtue signaling “free advertising” for companies that say the right message:
Mark Valencia, sustainable growing blogger at SelfSufficientMe was scathing:
One of the farmer interviewees, the multimillion-dollar corporate winemaking dynasty Brown Brothers, cited climate change as the reason for its decision to buy into Tasmania in order to “climate-proof” their business. …
I guess spending 32 million acquiring vineyards in Tassy had nothing to do with this “poor Aussie battler” expanding their business hey… wink wink. Sorry, but call me cynical if I think their appearance on Four Corners was nothing more than a publicity stunt aimed at toffee nosed left wing wine guzzlers residing in inner-city Melbourne.
Another farmer (I heard speaking on the ABC Radio promo) said climate change has made him “change” his farming method drastically! For example, he now rotates crops and cattle on his property… well, duh… shouldn’t you be doing that anyway? You are a farmer, for goodness sake, crop rotation and moving your cattle to prevent scorched earth makes sense, doesn’t it!?
Four Corners then introduces its resident scientific talking head, Karl Braganza from the BoM. Braganza wastes no time in saying things are going to get worse, temperature, storms, the lot. Braganza is amazing. Here he is back in 2016 claiming storms will decrease, albeit become more powerful in the future. That claim about storms becoming worse, albeit less frequent, is thoroughly rebutted here. In fact, all extreme weather is reducing: droughts, storms, rainfall, as even the IPCC and other prominent alarmists like Professor Muller concede.
UPDATE #2: Reader Peter P writes that the farmer’s numbers don’t make sense:
MARTIN ROYDS: Yes we have 130 years of rainfall and temperature graphs
Since 1985 to now, the temperatures have been increasing .8 of a degree per decade.
So, in that thirty year period, it’s gone up 2.4 degrees, maximum temperature. [my bold]
I was interested in this quoted rapid temperature increase, so I checked out the temperature figures for Braidwood on the BOM site. It appears that you can get an average max temp for the period 1907-1975 from a recording station in one of the main streets of Braidwood – my reading of the data shows the average annual maximum for that period to be 19.0C. After that period there are the records from an AWS at Braidwood Racecourse for 1985 – 2018. They show an average annual maximum of 19.2C, barely changed from the earlier period. And this is (roughly) the 30 year period of rapid temperature increase claimed by Martin Royds in the program. – -Peter
UPDATE #3: The great Ruairi
Many media, duped and misguided,
Have on climate-change, long since decided,
To report with great zeal,
The fake climate spiel,
From the Left and keep it one-sided.
–Ruairi
This is the ABC speaking to the fence sitting and ignorant, and the 2% of the population who need affirmation that they are smart, caring, and deserve their junkets, jobs or solar subsidized electricity bills.
If FourCorners wants to represent the four corners, and get some relevancy back, it needs to generate actual controversy by interviewing the best of both sides of this debate.
*Regarding the ABC interviewing those “paid to find a crisis” — the ABC should interview them — along with the skeptics who question them. And may the best argument win.
REFERENCES
[1^] Anagnostopoulos, G. G., D. Koutsoyiannis, A. Christofides, A. Efstratiadis, and N. Mamassis, (2010). A comparison of local and aggregated climate model outputs with observed data’, Hydrological Sciences Journal, 55: 7, 1094 — 1110 [PDF]
[2^] Koutsoyiannis, D., Efstratiadis, A., Mamassis, N. & Christofides, A.(2008) On the credibility of climate predictions. Hydrol. Sci. J. 53(4), 671–684. changes [PDF]
[3^] Previdi, M. and Polvani, L. M. (2014), Climate system response to stratospheric ozone depletion and recovery. Q.J.R. Meteorol. Soc.. doi: 10.1002/qj.233
[4^] Christy J.R., Herman, B., Pielke, Sr., R, 3, Klotzbach, P., McNide, R.T., Hnilo J.J., Spencer R.W., Chase, T. and Douglass, D: (2010) What Do Observational Datasets Say about Modeled Tropospheric Temperature Trends since 1979? Remote Sensing 2010, 2, 2148-2169; doi:10.3390/rs2092148 [PDF]
[5^] Fu, Q, Manabe, S., and Johanson, C. (2011) On the warming in the tropical upper troposphere: Models vs observations, Geophysical Research Letters, Vol. 38, L15704, doi:10.1029/2011GL048101, 2011 [PDF] [Discussion]
[6^] Paltridge, G., Arking, A., Pook, M., 2009. Trends in middle- and upper-level tropospheric humidity from NCEP reanalysis data. Theoretical and Applied Climatology, Volume 98, Numbers 3-4, pp. 351-35). [PDF]
[7^] Anagnostopoulos, G. G., D. Koutsoyiannis, A. Christofides, A. Efstratiadis, and N. Mamassis, (2010). A comparison of local and aggregated climate model outputs with observed data’, Hydrological Sciences Journal, 55: 7, 1094 — 1110 [PDF]
[8^] Sheffield, Wood & Roderick (2012) Little change in global drought over the past 60 years, Letter Nature, vol 491, 437
[9^] Miller, M., Ghate, V., Zahn, R., (2012) The Radiation Budget of the West African Sahel 1 and its Controls: A Perspective from 2 Observations and Global Climate Models. in pressJournal of Climate [abstract] [PDF]
Belated H/t to Robert Rosicka, DonS, MurrayShaw, Tony Thomas, toorightmate, Pat, Dave B, Original Steve, Another Ian, el gordo, Chris G
BBVA, the second largest bank in Spain, has launched a major new financing initiative to support sustainable development and combat climate change in the coming years.
Only gas and oil companies are “vested interests” seeking to profiteer from our demise. Banks are charities:
BBVA Group Executive Chairman Francisco González said, “At BBVA, we want to play a key role in mobilizing resources to halt climate change and promote sustainable development. It is an ambitious, long-term goal in line with our purpose of ‘bringing the age of opportunity to everyone.’”
Apparently, the bank’s role is to change Earth’s climate, and “bring the age of opportunity to everyone”.
Do their shareholders know, I wonder?
Can anyone see an elephant?
Warning — Meaningless acronym coming — SBTI:
BBVA has also become the first Spanish bank to commit to the Science Based Targets Initiative. The campaign helps major corporates work out how they have to cut emissions to prevent the impacts of climate change.
If you wanted to dress up a neolithic druid program to use windmills to slow storms, you’d call it “Science Based” too.
Right now Exxon are on trial even though they “believe in climate change” because they spent $23 million or so on skeptics over ten years, and a long time ago. Yet, here’s a bank offering one hundred thousand million… it’s 4,347 times as much.
Plenty more money where that came from.
Does anyone doubt that a river of money and power flows through this science debate?
Much of this “$100 billion” will be rebadged bragging money — money that would have been spent anyway but a change of label makes it “good for advertising greenness”. It’s also good for whipping up momentum in a struggling market.
The implications are staggering, half the population fail at blink tests, and can’t see newspaper headlines about “climate change”. If only we could make them see by using rhetorical and psychological trickery to get past their faulty filters, the world would be saved. Please send us another grant!
Naturally, this self-serving, circular, and poorly researched piece is brought to you by The Conversation. Where else?
The big insight looks like pattern seeking and confirmation bias to me:
When we modified the test to measure people’s attention to climate change, we found people who are concerned about climate change are better at seeing climate-related words, such as carbon, right after the first target than those who are less concerned.
When we analyzed the data, we found a pattern: Conservatives who were less concerned about climate change were less likely to see climate-related words than liberals who were worried about the issue.
Or in another hypothesis, conservatives had better filters for pointless news stories with a prediction success rate lower than random chance. From experience, conservatives have figured out that these news stories are a waste of time.
Wrong with their first fact. Please, someone teach these Profs to use a search engine
The real problem with this study is that it starts from flawed assumptions, and everything “builds” on that. Apparently they only get their news from the BBC, or possibly 350.org flyers:
So the three authors based their entire research on untested assumptions that they may have sourced in a Greenpeace seminar (which is what the BBC did). Perhaps they formed their opinions surrounded by young left-wing lecturers and then went on to become three of the same.
A professor or bright undergrad,
Can easily be duped and be had,
By those who hoodwink,
Through consensus group-think,
To fall for the climate-change fad.
–Ruairi
The way to (Not) win over skeptics
Genius advice in communication apparently starts with calling people demeaning names:
We can do this by using messages that align with people’s political ideologies and personal values.
For example, we can frame climate change action as protecting our nation against climate catastrophes, advancing economic and technological development and creating a more caring and considerate society, which is an effective message to engage climate deniers.
Good luck with this theory:
Framing environmentalism as a form of patriotism can be successful, particularly if the appeal is seen as coming from one’s in-group.
It’s always hard to get someone’s attention, but if the messaging is in line with their personal values and motivations, they will take notice.
Messaging can be “in line” with personal values, but junk-in-line is still junk. Unproven half-truths and wild extrapolations won’t convince anyone bar the gullible groupthinkers.
Paul Homewood has either caught a Met Office prof rewriting history (the politest way I can put it) or Homewood has caught him issuing deliberately incorrect forecasts. Which is it — deception about the past, or deception about the future? Apparently he thought no one would check his past statements? (And as far as journalists go, he’s almost spot on.)
Ministers were warned about the Beast from the East a month ago by a Met Office forecaster who stockpiled provisions in preparation for the weather bomb.
Professor Adam Schaife, head of long-range forecasting at the Met Office, alerted the Cabinet Office to the incoming weather bomb four weeks ago.
He told them that they should expect Britain to be battered by a deep freeze.
In preparation for the polar vortex he stocked up on essentials.
‘I got extra oil, food and logs in, knowing this was coming,’ he said last week.
But Paul Homewood checked the past Met Office Forecasts. The Sudden Stratospheric Warming (SSW) was key to the Beast, but when the BOM issued the 3 monthly forecast on the 26th of January they said:
…”there is little likelihood of a SSW, and an increased likelihood of milder-than-usual conditions at least in the first half of the 3 month period.”
Perhaps this was code for Ministers to buy tuna tins? By the 9th of Feb, Homewood says they had an “inkling” of the SSW, which was already happening by the 12th. Then they said it was ” too soon to determine exactly what impacts it could have on our weather in the UK.”
It was only by the 18th of Feb that the Met Office warned it: could lead to prolonged cold conditions over the UK, increasing the risk of easterly wind and significant snow”.
But wait! “Signs” appeared:
Prof Adam Scaife, head of monthly to decadal prediction work at the Met Office Hadley Centre, said “Signs of this event appeared in forecasts from late January”[2].
These mysterious “signs” apparently were signish enough for him to order logs and oil, but not spell that out for the public.
What were the “signs”:
a/ it’s winter
b/ tea leaves spelled “SSW. “
c/ a dream about the Dalai Lama.
The Met Office has some story about the weather patterns repeating from 2009 and 2013, and “starting over India”. Welcome to climate science where forecasts are post hoc but not predictive.
Paul Homewood:
Scaife has serious questions to answer.
If he really did give the Cabinet Office detailed advice about the severe freeze up at the beginning of February, then why did the Met Office not include the warning in their news releases until just over a week before?
On the other hand, if what the Met Office has said is correct, then Scaife is guilty of misrepresenting his advice to the Cabinet Office. He may well have said that there was a chance of some cold weather arriving, but to pretend he warned them about “the beast from the east”, as The Times claims, is clearly deeply misleading.
Perhaps the Met office are feeling a bit insecure?
Commenter RAH: Joe Bastardi was forecasting this Artic blast hitting western Europe a month ago just as he forecast the Nor Easter that is going to strike the East Coast here in the US over a week ago and has said it’s just the first of several that will hit the coast. It is all just WEATHER and Joe was telling people it was coming. — Read more here.
PS: Had a blackout last night, and no internet coverage most of today. I’ll get to the 4Corners report tomorrow.
Jon Erdman argues that March in the US is notorious for storms due to jet streams and a mix of warmer humid air paired with cold winter air. His impressive list of previous March extreme weather is a good antidote to the “Climate Change” claims coming in 3, 2, 1 ….
The deadliest March snowstorm was the infamous Blizzard of 1888, which dumped 40 to 60 inches of snow in New York, Connecticut and New Jersey, wind-whipped into drifts which topped some homes. Four hundred were killed in the storm and its cold aftermath.
Here are a sampling of other notable March snowstorms:
Late March 1987: Three-day blizzard produced gusts to 78 mph at Dodge City, Kansas and Altus, Oklahoma. Pampa, Texas, picked up 20 inches of snow. Forty-six Kansas counties declared disaster areas.
Early March 1966: Blizzard across North Dakota, Minnesota produced wind gusts to 100 mph, whipping snow into drifts 30 to 40 feet high, paralyzing travel for three days.
Early March 1717: Four separate snowstorms hit the East in nine days, with up to 4 feet of snow in Boston and drifts to 25 feet in Dorchester, Massachusetts.
Here are some other notable severe weather and tornado events in March:
March 28, 2000: Back-to-back tornadoes struck Ft. Worth, then Arlington, Texas, shattering windows, killing three.
March 25, 1992: Hail up to 4 inches in diameter pelted the Orlando metro area, virtually shutting down the area’s nursery industry due to broken glass.
March 28, 1984: At least 22 tornadoes tore through the Carolinas, including a 2.5-mile wide F4 near Tatum, South Carolina
March 25, 1952: Deadliest outbreak in Arkansas history, with 111 dead. In all, tornadoes claimed 343 lives in the South. One F4 tornado leveled the town of Judsonia, Arkansas.
March 20-22, 1932: One of the worst outbreaks in U.S. history from Mississippi to South Carolina to Indiana. Ten F4 tornadoes tore through Alabama, Georgia and Tennessee on March 21 alone.
Best wishes for those in the path of weather like this in the North Eastern US and in Europe too.
PS: I’m looking for jet-stream predictions from the IPCC and climate models — especially old forgotten ones.
In the climate debate, few men are more central, more loathed and feared than Marc Morano. In the flesh, few men are more warm, witty and polished — an absolute gentleman and a delight to be around. He’s so effective he’s been rated one of the top 17 “planet killers”, and according to the Daily Kos, “Evil Personified”. Thank goodness he’s on our side.
Not surprisingly, with so much going for him, he was the villain of the Merchants of Doubt documentary. Newsweek called him “King of the Skeptics” and Esquire Magazine devoted six thousand words to trying to unpack and investigate his key role in climate politics.
For a few years Morano worked for Senator Inhofe, who at the time was virtually the only Republican standing up to the media, academia and the UN on climate change. When Leonardo DiCaprio and National Geographic released their top ten list of climate deniers, Inhofe was number one, and Morano, number two.
Like a bullet it is now the #1 New Release in Environmental Science books. Let’s help keep it there. Right now, Leonardo’s worst fear is that you will buy this book and give it to people on the fence, impressionable teens, and any decent, deplorable teachers. Ask your local library to get a copy.
With his book “Politically Incorrect Guide to Climate Change”, Marc Morano vies to be the Thomas Paine of the movement to save the world from the tyranny of climate catastrophists. He exposes the seemingly infinite number of absurd claims, and the almost unbounded hypocrisy and venality of the proponents of this clearly inhuman and scientifically implausible attempt to control mankind by controlling and, more importantly, restricting access to energy. This book is an unrelenting polemic of the best kind.
— Emeritus MIT climate scientist Dr. Richard Lindzen
The book has been endorsed by Nobel Prize Winning scientist Dr. Ivar Giaever. (see below)
Rush Limbaugh praised Climate Depot’s Morano in 2009:
“Morano’s probably single-handedly, in a civilian sense, the guy (other than me, of course) doing a better job of ringing the bells alarming people of what’s going on here.” – November 20, 2009
This book is the ultimate reference guide to climate change and no parent should be without a copy as their kids under climate education at school from elementary through college!
“…today anybody who defies the prevailing “climate change” scare puts his career and his reputation into extreme danger. That is where we find Marc. He is living life behind the eight ball. He has been there for decades. But whatever you may hear from his enemies in the climate change establishment, he is no crazy denier or shill for Big Oil. The explanation is simple. He is so certain of his data that he is quite comfy there…
This book is exactly what parents need to counter the indoctrination our children are now being subjected to…
Read this book and Marc will become your hero.”
— John Coleman.
Marc discovers he is Wanted in Paris, 2015
The book synopsis:
Less freedom. More regulation. Higher costs. Make no mistake: those are the surefire consequences of the modern global warming campaign waged by political and cultural elites, who have long ago abandoned fact-based science for dramatic fearmongering in order to push increased central planning. The Politically Incorrect Guide to Climate Change gives a voice — backed by statistics, real-life stories, and incontrovertible evidence — to the millions of “deplorable” Americans skeptical about the multibillion dollar “climate change” complex, whose claims have time and time again been proven wrong.
Russian trolls used Facebook, Instagram and Twitter to inflame U.S. political debate over energy policy and climate change…
The committee’s report found that between 2015 and 2017, more than 9,000 posts and tweets dealt with U.S. energy policy produced by 4,334 Facebook, Twitter and Instagram accounts controlled by the Internet Research Agency.
Twitter told the committee that more than 4 percent of tweets produced by the Russians dealt with energy and climate issues.
…
Keep your eye on the numbers — 96% of their effort was not about energy and climate, and presumably we’re talking about 400 posts and tweets? Drop in the ocean…
Max says that IRA staff were tasked with monitoring tens of thousands of comments on major U.S. media outlets, in order to grasp the general trends of American Internet users. Once employees got a sense of what Americans naturally discussed in comment forums and on social media, their job was to incite them further and try to “rock the boat.”
When the U.S. presidential race was just starting, the IRA supposedly conducted classes on which of the early candidates were best for Russian interests. Max says the IRA even maintained a “secret department” that sent staff to the United States for certain undisclosed tasks.
Max says the international desk had about 200 employees, each earning 50,000 rubles ($870) a month. Staff would work two days, then have two days off, before repeating the schedule. People worked 12-hour shifts, he says.
But in the last 70 years could anyone name a year when there was no Russian effort to covertly undermine US leaders or institutions via propaganda? Isn’t this business as usual, but via VPN?
The Russians were true trolls. The main agenda was polarisation, inflammation, doubt:
The trolls worked both sides of the fence on many topics. You might think (it’s obvious) that it would suit Russians very well for the West to be fooled into giving up coal and nukes and handicap themselves with sacrificial windmills and solar panels. For sure, but the bigger goal here is to foment division, dissent and distrust. In a high trust society — losing trust in our government, our election process, and our markets eats away at the things that make us great, like acid. And it becomes self fulfilling. Once enough people assume the other players are acting in an untrustworthy manner (even if they are not) the good people tend to adopt the self-serving behaviours they imagine others are adopting.
In January 2017, a report from the U.S. intelligence community said Russian president Vladimir Putin had “ordered an influence campaign in 2016 aimed at the U.S. presidential election.” The goals, the analysis revealed, were to undermine faith in U.S. democracy and harm the “potential presidency” of rival candidate Clinton.
Remembering that in Jan 2016, almost no one in the US outside of Donald Trump and Scott Adams thought Trump was going to win. So being anti-Hillary was not to be pro-Trump, it was anti-the-next-likely-POTUS. The real goal it appears, was to undermine US confidence in itself, and undermine the ability of the next leader to get things done.
Big-government fans at Grist don’t know what to make of it.
“Russian trolls shared some truly terrible climate change memes”
Terrible, I tell you! Or not…
…
This wouldn’t have been my first choice for “terror”. But it might win a primary school art contest.
This one is much better:
Grist author, Kate Yoder, totally misses the point: “And here are two anti-environmental memes that highlight the apparent beauty of tar-sands oil.”
Or maybe they highlight the ugliness of electric cars and (above) environmental activists?
But seriously, 9,000 likes and 250 comments? It’s a great tweet, but in a great nation, how much damage can it do? (Not as much as George Soros.)
The news that there are fake “activists” on both sides of the debate is far more threatening to the believers. Skeptics know why we are skeptics. Believers are following a group, so it’s much more unnerving to find that some members of the herd are there to guide the pack.
A 2C rise – which some climate scientists say is inevitable by the end of the century – would see the South East of England experiencing conditions similar to south west France, while a 4C rise would expose gardens to conditions seen in south-west Portugal, the Trust said.
Herbaceous borders and water-loving English country garden plants from foxgloves to delphiniums could struggle in hotter drier summers, while milder, wetter winters could threaten spring bulbs such as tulips and hyacinths.
But plants from hotter climates such as passion flowers and cacti will thrive in warmer temperatures.
These of course are just predictions by mere plant experts, not climate scientists — who always knew that extreme snow was coming, but didn’t think to mention it to their plant science colleagues:
Mike Calnan, the National Trust’s head of gardens and parks, said the predictions were based on computer models generated by the Met Office Hadley Centre.
Oh.
No wonder the punters are confused. The Guardian now has to do articles to help them make sense of the snow:
Q: Snow in winter. That feels reassuringly normal. Does this mean the climate has fixed itself?
Who but a Global Warming Devotee would describe extreme red alert snow dumps as “reassuringly normal”?
There are 60 million people in the UK — how many of them are asking “Has the climate fixed itself”? How about “three” and they all work at The Guardian.
Having served up a hand-ball Dorothy-dixer, the answer converts calm to impending panic:
A: Unfortunately not. In fact, many scientists are concerned this is a prelude to more extreme and less predictable weather.
Perhaps those scientists could’ve told the Brits they’d need more gas instead of solar panels?
Best wishes to all our British and EU friends faced with too much “global warming”.
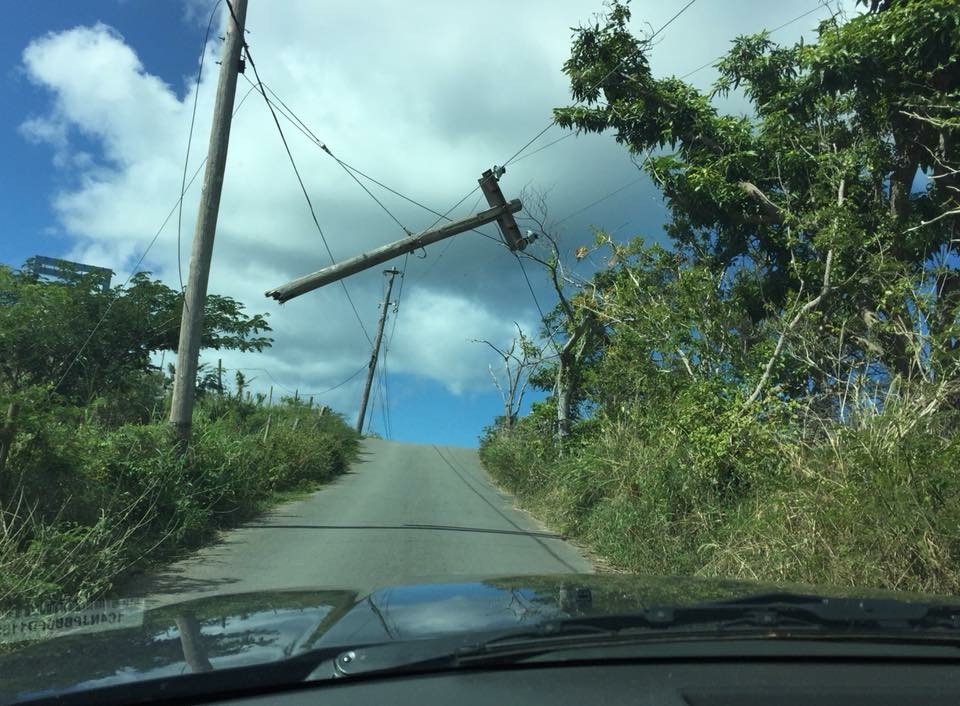
In South Australia, when the lights went out, Olympic Dam took two entire weeks to get operational again. Spare a thought for those in Puerto Rico. Right now, five months later, and one in 6 still don’t have electricity. That’s five full months of blackout — surviving off candles, car batteries, small diesels and whatever anyone can get. Some people will be waiting til May. Though that’s “95%” connected, so still no joy or lights, for one in 20 people. How do you put a roof back on your house when you can’t even power up your drill? (See The Atlantics photo montage from January 27th to get some idea of what life is like, months after the storm).
Puerto Rico has 3.6 million people, was poor and corrupt, with failing infrastructure and huge debts before Hurricane Maria hit on Sept 20th. The government has a budget of $10b per year, but owes more than $70b. The hurricane wiped out 80% of the infrastructure, completely trashing some of the solar and wind “farms”, and bringing down transmission lines.
One wind farm that survived the hurricane sat idle for weeks because there was no grid running and a wind farm can’t start a grid up (so much for microgrid resilience). Puerto Rico Electric Power Authority, or PREPA had oil powered generation plants which were 44 years old on average, and not surprisingly (with no access to coal or nuclear power) the people paid very high electricity rates. Government entities and a few chosen private industries got it for free though.
Puerto Rico in the Caribbean was right in the path.
There also isn’t any noise. The turbines are in perfect working order and could be a vital source of energy for the power-starved island. Except that they can’t actually be turned on without a small amount of electricity from the grid — which, of course, isn’t currently capable of providing it.
When the grid eventually comes back online, the wind farm will be able to provide power to about 35,000 homes. Until then, the blades aren’t turning.
The island’s grid is antiquated and hasn’t received any major upgrades in years. Power outages were a regular part of daily life on the island even before the storm
…when the hurricane made landfall on September 20th, Puerto Rico was already an accident waiting to happen. Unfortunately, like so many of our ailing cities – run by Democrats for decades – it was a victim of irresponsible progressive policies long before it was a victim of Maria.
The government has funneled public money to state-owned enterprises that are supposed to be financially independent. Worse, the report said, many workers no longer even look for jobs, since welfare benefits pay more than actual work.
In fact, the (island’s power authority, Prepa) has been giving free power to all 78 of Puerto Rico’s municipalities, to many of its government-owned enterprises, even to some for-profit businesses — although not to its citizens. It has done so for decades, even as it has sunk deeper and deeper in debt, borrowing billions just to stay afloat.
Now, however, the island’s government is running out of cash, facing a total debt of $72 billion and already defaulting on some bonds…
A 2016 report on PREPA commissioned by the Puerto Rican government is scathing. In the latter months of that year, for example, Puerto Ricans experienced four to five times the number of service outages as U.S. customers on average, though they pay the second-highest rates in the U.S. after Hawaii. Instead of investing in preventive maintenance, PREPA operates in a permanent state of triage. Its budget is “opaque and discretionary.” Record keeping is “subpar.” A third of the capital budget is spend on discretionary administrative expenses, hinting at a slush fund. Thirty percent of PREPA’s employees have retired or migrated to the mainland since 2012, the Washington Post reports—especially its skilled workers. Money is short, the report concludes, but so is human and intellectual capital.
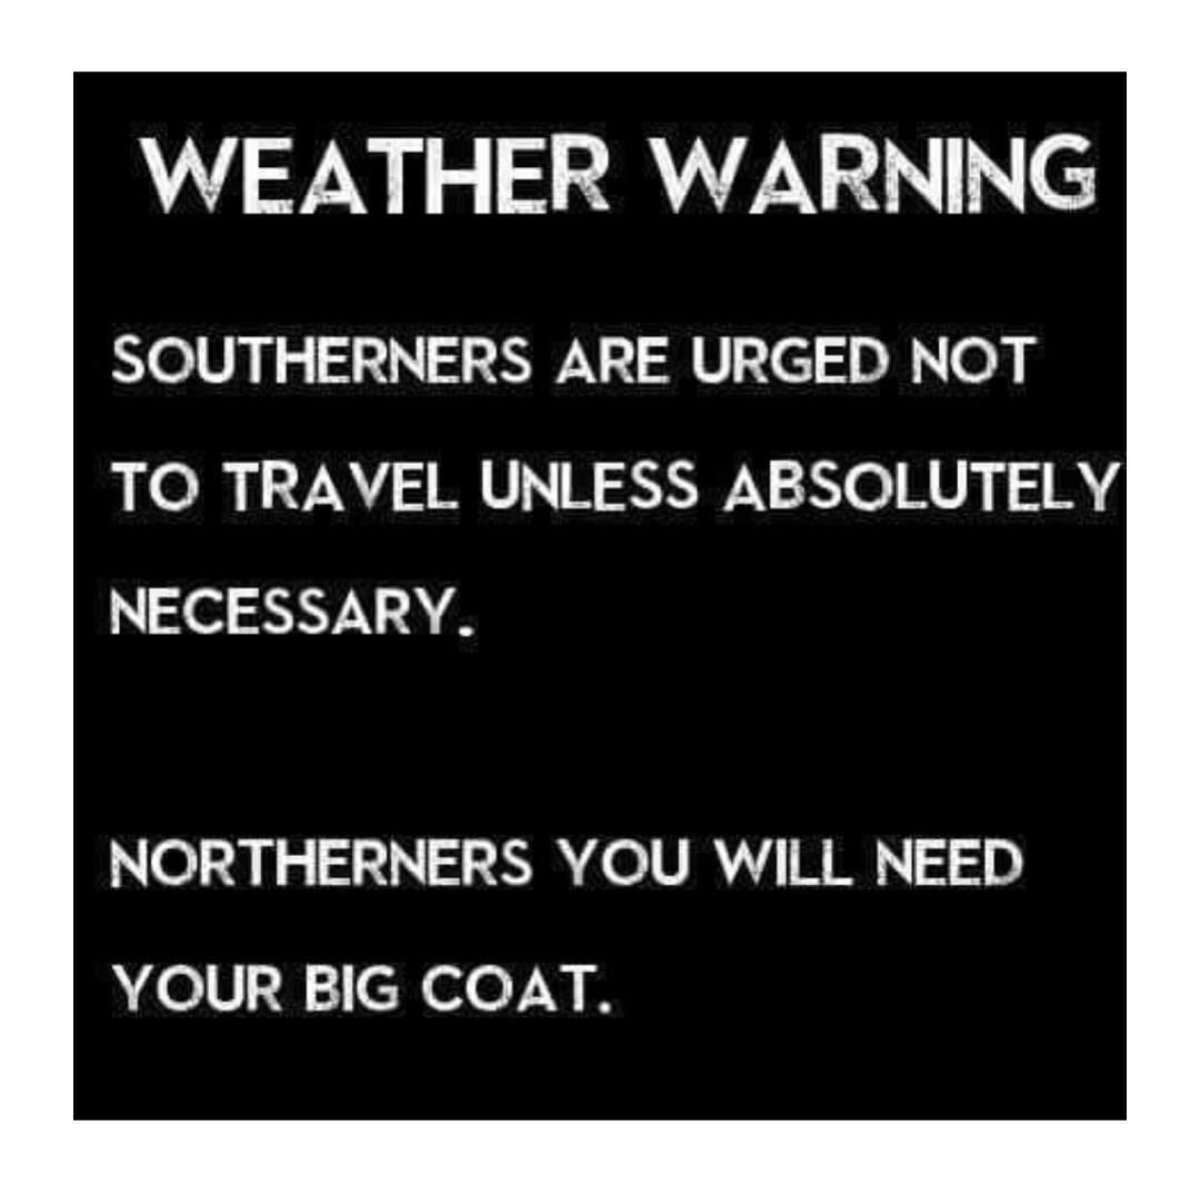
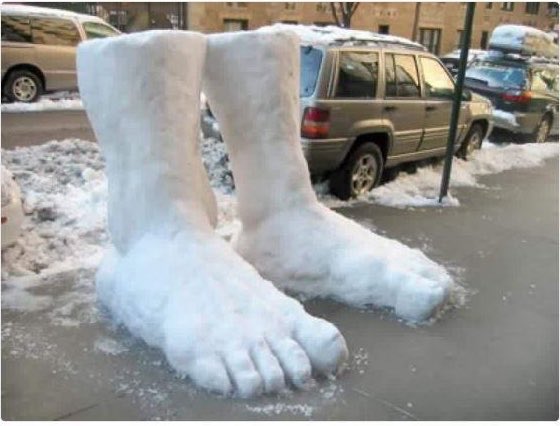
In Europe we’re awaiting the Beast,
A Siberian blast from the East,
Where the warmists foretold,
No snow and no cold,
But more often where snowfall increased.
Yet again, we have to ask: does the Bureau of Meteorology care about Australia’s long term climate trend? Are they even trying?
Bourke could be one of the top ten most influential temperature sites in the world, mostly by virtue of being miles from anywhere, and used to homogenize a large slab of the land mass of Australia. Bill Johnston documents how changes to the site create most of the temperature trend.
The Bureau of Meteorology’s fancy magical and secret homogenization protocol does not detect changes that obviously affect the temperature (like the clearing in the photo below). But sometimes the BoM make “corrections” because of site changes that don’t appear to have mattered. Is it conveniently selective or just inept?
The BoM don’t even document major site changes a lot of the time. Even iconic sites that affect huge areas are badly managed. Someone got the tractor and plough and cleared the vegetation. As usual, a citizen scientist, a volunteer, documents it (along with a suite of other site changes).
In the last ten years land was cleared around the thermometer. This denuded area has a lower humidity, and higher volatility of temperatures. The data from this thermometer may be used to “correct” thermometers 1,400 km away.
Bourke Australia, Satellite view. “Back of Bourke”.
The town is the last outpost of civilization, so infamous it has it’s own cliche: “The back of Bourke”. If there was a perfect thermometer in Australia, this place would vie for the top spot with records going back to 1871, on the crossroads to nowhere and one of the last almost untouched towns –historic, but not urbanized enmasse. And it is an official ACORN site, considered one of the best quality records in Australia. Bourke is at the crossroads to Australia’s outback and is one of the last almost untouched towns –historic, but not urbanized enmasse.
But thanks to Bill Johnston, we now know that even out here the long hand of incompetence and bias has romped through the data. Again, Bill documents a site that has been watered, moved, gone electronic, had a new screen, shifted to the airport, and then just in the last few peak years — as climate change became “life or death” — someone cleared the ground all around it and no one at the BOM noticed.
In a Bermuda-triangly type mystery, the station went “electric” but instead of getting better data, for a few years the temperature was only recorded in whole rounded integers. (So much for the tenth of a degree of accuracy, eh?) Plus two or three weeks of data went missing each year, and the site failed performance checks twice.
The wonderbar Technical Advisory Forum set up to boost confidence in the expertise of the BoM didn’t investigate this in 2015. Being consistently irrelevant, they also didn’t investigate in 2016 or 2017 either. What looks like a whitewash, smells like a whitewash…
Likewise, two-rounds of expert peer-review fail to address such obvious problems in the Bureau’s homogenisation methods?
Bourke is so hot it was the place they sent trains to in 1896 to rescue people from a monster heatwave. Bourke is used to homogenise stations like Alice Springs which is 1,400km (860 miles) away. Does this little clearing “heat” a million square kilometers of records? It’s possible.
As usual, Johnston’s short post here is backed up by a longer PDF file which outlines his detailed years of research.
One Nation’s Senator Brian Burston is presenting this information and the paper to the Senate Estimates on Monday morning. Questions need to be answered.
— Jo
_________________________________________
Welcome to the back of Bourke where they make the weather warmer
The climate at Bourke and surrounding sites hasn’t changed. There is no temperature trend, no increased frequency of extremes and no trend in extremes.
As no sites have stayed the same, Australia’s long-term weather records are not useful for tracking trends in the climate.
Arbitrary homogenisation adjustments coerce data to agree with models. Comparative homogenisation is biased and should be abandoned.
Introduction
Bourke in northwestern New South Wales is synonymous with ‘the bush’; Clancy of the overflow; crows flying backwards to keep dust out of their eyes and mozzies big as chooks…. While caravans and mobile-vans roll-in during winter when its cool and dry they stay away in droves in summer. Rainfall is a low 336 mm/yr; the driest was 86 mm in 2002 and the wettest, 854 mm in 1950. Runs-of-months with zero rain are common and the drier it is the hotter it gets. Irrigation along the Darling River and dryland grazing of cattle, sheep and goats (and tourism) supports the town’s 2,000 people.
The history of the place
Starting in 1871 Bourke ranks with Sydney Observatory (from 1859), Melbourne (1856), Perth Observatory (1897), Hobart (1882) and some lighthouses (Cape Otway (1865), Yamba Pilot Station (1877) and Nobbys Head (1867)) as one of the longest continuous weather records in Australia and one of the longer datasets in the Southern Hemisphere. It is also one of 104 non-urban ACORN-SAT sites (Australian Climate Observations Reference Network – Surface Air Temperature) used to calculate Australia’s warming.
Site and instrument changes effect measurements. The environment surrounding the site has not remained consistent; the Stevenson screen has not stayed in the same place and equipment used to measure temperature has changed also.
Observations were first reported from the telegraph office and after it burnt down on 8 November 1874 the office moved to another building, which it shared with the post office. A new post office (with residence) was built in 1880 in Oxley Street several allotments east of the courthouse, which is on the Richards Street corner (Figure 1). The second storey was added in 1889 and modifications continued until telegraph and postal services merged to form the Post Master Generals Department in 1901.
The large 230-litre Stevenson screen installed in 1908 moved at least once in the post office yard and from the 1950s it was shaded and surrounded by watered lawns. It was replaced (and probably moved) in 1964 and due to continuing “vegetation problems” observations ceased there in August 1996.
Thermometers were observed in another 230-litre screen beside a dusty track at the second airport north of town in 1994. That site was superseded by an automatic weather station (AWS) 700 m away in 1999, which used a small 60-litre screen and which reported whole-degrees before 2002. The many temperature values that were culled shows the AWS was frequently over-range, probably because its rapid-sampling probe operating in the small screen recorded flurries of warm air that would not affect thermometers housed in large screens; or that due to calibration problems it was prone to spiking on warm days.
The AWS site was ploughed-around in 2013, which made it even hotter
Figure 1. The approach to the then RAAF landing ground in 1941 looking north over Bourke to the Darling River. The courthouse (C), Lands Department (L) and post office (P) facing Oxley Street are visible with trees (T) established around the post office (From the National Library of Australia aerial photograph collection).
Understanding data requires careful analyses and research. Step-changes detected using independent statistical tests are aligned with reports in newspapers and archives (National Archives and National Library of Australia); museums like the Airways Museum at Essendon and the RAAF Museum at Point Cook; and checked using historic aerial photographs and Google Earth Pro (Figure 2).
Bourke temperatures are hotter now than in the past because of site changes, not the climate.
Because sites change, data collected to describe the weather are often not useful for benchmarking trends in the climate. Shade, watering and the new building caused changes at the post office and the hotter it was the more watering was probably done to cool the place down. Daytime temperature is warmer at the airport especially in summer and Google Earth Pro satellite images show the current AWS site was ploughed around before 2013, which according to Blair Trewin[2] is “Australia’s hottest ever year”. The most recent ‘record’ temperature at Bourke (48.3oC on 12 January 2013) is due to ploughing not the weather.
Figure 2. Close-up views of high-level (25,000 feet (7,600 m)) aerial photographs shows the post office (P) with trees in the yard, the Lands Department office (L) and courthouse (C) on the Oxley-Richard Street corner in 1952. By 1963 a new building (?) (which Google Street View shows is now a bank) occupies the vacant lot which before 1877 was to have been the town goal.
Its hot when it’s dry and cool when its not and careful analysis outlined in the attached Bulletin shows the climate of Bourke hasn’t changed. Temperature trends and frequency of upper-range extremes has not increased. The AWS-site is neglected; out-of-range values are selectively culled because electronic thermometers housed in dusty 60-litre Stevenson screens spike randomly on warm days.
Recent temperature records at Bourke are due to ploughing; those at Wanaaring are due to the small screen moving from behind the post office, where the lawn was watered, to beside the dusty track to the tip in 2003. Brewarrina’s data are warmed after 2002 by new hospital accommodation; while at Cobar data are affected by urban encroachment. Like ploughing, establishing AWS at the hottest sites imaginable (Figure 3) is just another trick. While the Bureau warms the data the climate hasn’t warmed or changed.
Figure 3. Eight of 11 new AWS established in NSW in 2017 are in the arid northwest corner where its bound to be hot. (Pre-existing sites are in upper-case.) (Map courtesy of Google Earth Pro.)
Homogenisation
ACORN-SAT is the sum of its parts and Bourke is just another example of where arbitrary changes create trends that don’t reflect local weather. Recent claims of record warming are not supported by individual site data. (Bourke homogenisation is outlined in Part B of the Bulletin.)
Across the network site-changes are not rigorously documented, some are ignored and some that make no difference are adjusted as though they did. Furthermore, selecting faulty (correlated) data to adjust ACORN-SAT datasets results in bias. The default position that unexplained data-changes are attributed to the climate allows climate-changes to be specified in advance and data to be homogenised accordingly.
Australia’s ACORN-SAT temperature datasets are riddled with problems. The process is opaque; lacks statistical control; synchronous inter-site changes such as replacing 230-litre screens with 60-litre ones and thermometers by AWS at infrequently serviced sites beside dusty tracks and in paddocks at airports, are propagated across the network by the process. Thus few ACORN-SAT datasets are independent of collective problems. Using comparator data that are not homogeneous to adjust faults in ACORN-SAT has no merit and should be abandoned.
Conclusions
The Bureau’s ardent support of climate warming has overtaken its job of monitoring the weather. Replacing observers with AWS and 60-litre Stevenson screens beside dusty tracks, which are checked at most places less than once per year has warmed Australia’s climate.
It’s always been hot at Bourke especially when it’s dry. The climate hasn’t changed; temperatures have not increased nor are extremes more frequent or increasingly severe.
It is remarkable that homogenisation has gone-on for as long as it has. Changing data to agree with models is unscientific. For all its complexity the process is faulty and should be discontinued.
We are trying to collect dilute erratic energy, spread over hundreds of square kilometers in windy, salty, and wet conditions with machines that spin at 330km/hour. What could possibly go wrong?
The Offwhore Wind Industry website discussed this type of damage in 2015:
Large rotors lead to large yields, but also to lots of annoyance – at least as far as the coating is concerned. After only a few years, the protective layer that is supposed to prevent erosion is already worn out. Materials that really last for 20 years are still being worked on.
The ever larger rotor blades have led to increasing rotation speeds of the blade tips. Offshore, speeds of up to 90 m/s are now reached. This is around 330 km/h. At these speeds, raindrops and hailstones hit the coating like bullets and remove the erosion protection like a pressure washer. After that, the rain washes away the rest of the coating layers and in the worst case exposes the blade structure. The tips and the leading edges of the blades are most affected.
Because the aerodynamics also get ruined along with the protective coating, the repair costs are accompanied by a loss in yield for the operator. Various studies estimate these losses to be between 4 and 10 %. If delamination sets in, this can quickly rise to 20 %.
It would already be an improvement if the erosion protection lasted six to seven years on the blade tips….
Apparently the protective coatings need a protective coating.
There is a steep loss of power as the leading edge erodes.
For onshore wind, the monthly ‘load factor’ of turbines – a measure of how much electricity they generate as a percentage of how much they could produce if on at full power all the time – dropped from a high of 24 per cent in the first year after construction, to just 11 per cent after 15 years.
For offshore wind –examined only in Denmark where it has been used for longer – it declined even more dramatically from over 40 per cent at the start, to just 15 per cent after ten years.
The bigger wind farms were less efficient than the small.
There is a five year guarantee on the rotor blades.
Some Californian councils launched climate litigation against Exxon because they will be wiped out by floods. But at the same time the same councils issued bonds and forgot to mention that the local area was going to be washed away.
Since 1990 or so, the bonds are worth in the order of $8 billion according to a petition from Exxon. The Competitive Enterprize Institute is calling on the SEC to investigate regarding potential fraud.
The councils have painted themselves in to a terminally awkward corner: Are they money grubbers using false propheses to scare up some money, or are they deceptive bond dealers?
For example, San Mateo County claimed in its complaint to be “particularly vulnerable to sea level rise” with a 93 percent the county will experience a “devastating” flood before 2050.
“If sea levels were to raise that high, it most certainly would be catastrophic,” Epstein said.
San Mateo’s 2014 and 2016 bond offerings told would-be investors that the county “is unable to predict whether sea-level rise or other impacts of climate change or flooding from a major storm will occur,” Exxon’s petition said.
The councils accused fossil fuel companies of causing their losses, but the counties and cities consume and produces a lot of fossil fuels itself.
[NYU Prof] Epstein’s comments are among a number of voices claiming the counties’ and municipalities’ lawsuits against the energy companies are inherently flawed. Epstein and those other voices point out that California, which includes the counties and cities that filed the lawsuits, is both a great consumer and producer of the same fossil fuels the litigation claims are sowing the seeds of imminent climate change disaster.
We toss the term Groupthink around a lot, but Christopher Booker gets serious about exactly what it is and what it means. He analyzes the “Climate Change” debate through the lens of the original scientific study of Groupthink as published by Irving Janis, a professor of psychology at Yale back in the 1970s. It’s uncanny…
Obviously we need to understand it so we can preventlimit it. But Groupthink is also ripe fodder for driving Eco-worriers up the wall as we list the ways — to a T — that they are The Textbook Example. There’s a useful strategy that flows from this. The core tenet is that because believers hold a shaky, fragile idea, they must be aggressively hostile to protect it. So put the boot on the other foot. Let’s ask Believers how they don’t fit the Groupthink mould. Do they welcome debate — go on, prove it.
Richard Lindzen’s introduction:
[Booker] asks how do otherwise intelligent people come to believe such arrant nonsense despite its implausibility, internal contradictions, contradictory data, evident corruption and ludicrous policy implications…
The phenomenon of groupthink helps explain why ordinary working people are less vulnerable to this defect. After all, the group that the believers want to belong to is that of the educated elite. This may have played a major role in the election of Donald Trump, which depended greatly on the frustration of the non-elites (or ‘deplorables’, as Hillary Clinton referred to them) with what they perceived to be the idiocy of their ‘betters’
Booker himself:
…I kick myself that I did not discover the book that inspired this paper until 2014. When I finally came across Irving Janis’s seminal analysis of ‘groupthink’, I realised just how much more it helped to explain about the story I and many others had been following for so long.
The three rules of Groupthink:
The late Professor Irving Janis analysed what happens when people get caught up in what he termed ‘groupthink’, a pattern of collective psychological behaviour with three distinctive features, that we can characterise as rules.
A group of people come to share a particular view or belief without a proper appraisal of the evidence.
This leads them to insist that their belief is shared by a ‘consensus’ of all rightminded opinion.
Because their belief is ultimately only subjective, resting on shaky foundations, they then defend it only by displaying an irrational, dismissive hostility towards anyone daring to question it.
This paper begins by showing how strongly all these three symptoms were in evidence, right from the start…
Read the whole paper at GWPF, click the book image or go here…
Electricity prices declined for forty years. Obviously that had to stop.
Here’s is the last 65 years of Australian electricity prices — indexed and adjusted for inflation. During the coal boom, Australian electricity prices declined decade after decade. As renewables and national energy bureaucracies grew, so did the price of electricity. Must be a coincidence…
Today all the hard-won masterful efficiency gains of the fifties, sixties and seventies have effectively been reversed in full.
Indexed Real Consumer Electricity Prices, Australia, 1955-2017.
But sooner or later a national system is a sitting duck for one small mind to come along and truly muck things up.
Please spread this graph far and wide.
Thanks to a Dr Michael Crawford who did the original, excellent graph.
For decades the power price fell,
In Australia, where the system worked well,
But renewable power,
For each kilowatt hour,
Shot up prices and rang its death knell.
We use cookies to ensure that we give you the best experience on our website. If you continue to use this site we will assume that you are happy with it.


 The ABC also gave time to APRA and the RBA — both notable climate science authorities (not) — who agreed with the IPCC. They interviewed (or rather, promoted) someone from a left wing think tank, the Special Counsel for Climate Risk from Minter Ellison, a consultant from “ClimateRisk” and a spokesperson from the industry body for insurance companies. All four of these specialists, predictably, were happy to help sell the topic that brings them more business. Could we imagine an insurance agent telling us that things are not going to be worse than we expect? Or how about a Special Counsel for Climate Risk that said the risk was inconsequential and her job was irrelevant? It’s a bit rich to call these “interviews” — no hard questions were asked. Much was made of the farmers historic weather books, but Brissenden didn’t ask to see their records from, say, Jan 1896 when a long heatwave killed hundreds across Australia and temperatures hit 50C in four states. He travelled around the country “over four months”, but didn’t find half an hour to phone one skeptical scientist, businessman, or lowly blogger who could have saved him from looking like a gullible patsy.


Recent Comments