Who’s desperate to find the missing hot-spot? Sherwood’s new paper claims to have found it, but after years of multi-layered adjustments, and now kriging the gaps, and iteratively homogenizing, the results of the new data partly “solve” one problem while creating others. There’s no documented, physical reason for the homogenizing and there’s no new insight gained. The raw data was used by airlines, the military, and meteorologists for years, yet the suggested new results are quite different to the raw data. It’s as if we can’t even measure air temperature properly. Somehow we’ve made multivariate complex models work but not simple temperature sensors? The main problem with the old results was that they didn’t fit the models. Now, after torturing the data, they still don’t.
Twenty-eight million weather balloons had shown by 1999 that the key assumption in the climate models was wrong. Without feedbacks, the models only produce 1.2°C of warming with a doubling of CO2. With feedbacks the simulations ramp that up to a dangerous 3 – 4 degrees C, and water vapor was the most important feedback. It’s just no fun for the Global Worriers without it.
No hotspot = no water vapor feedback like in the models = no danger from CO2
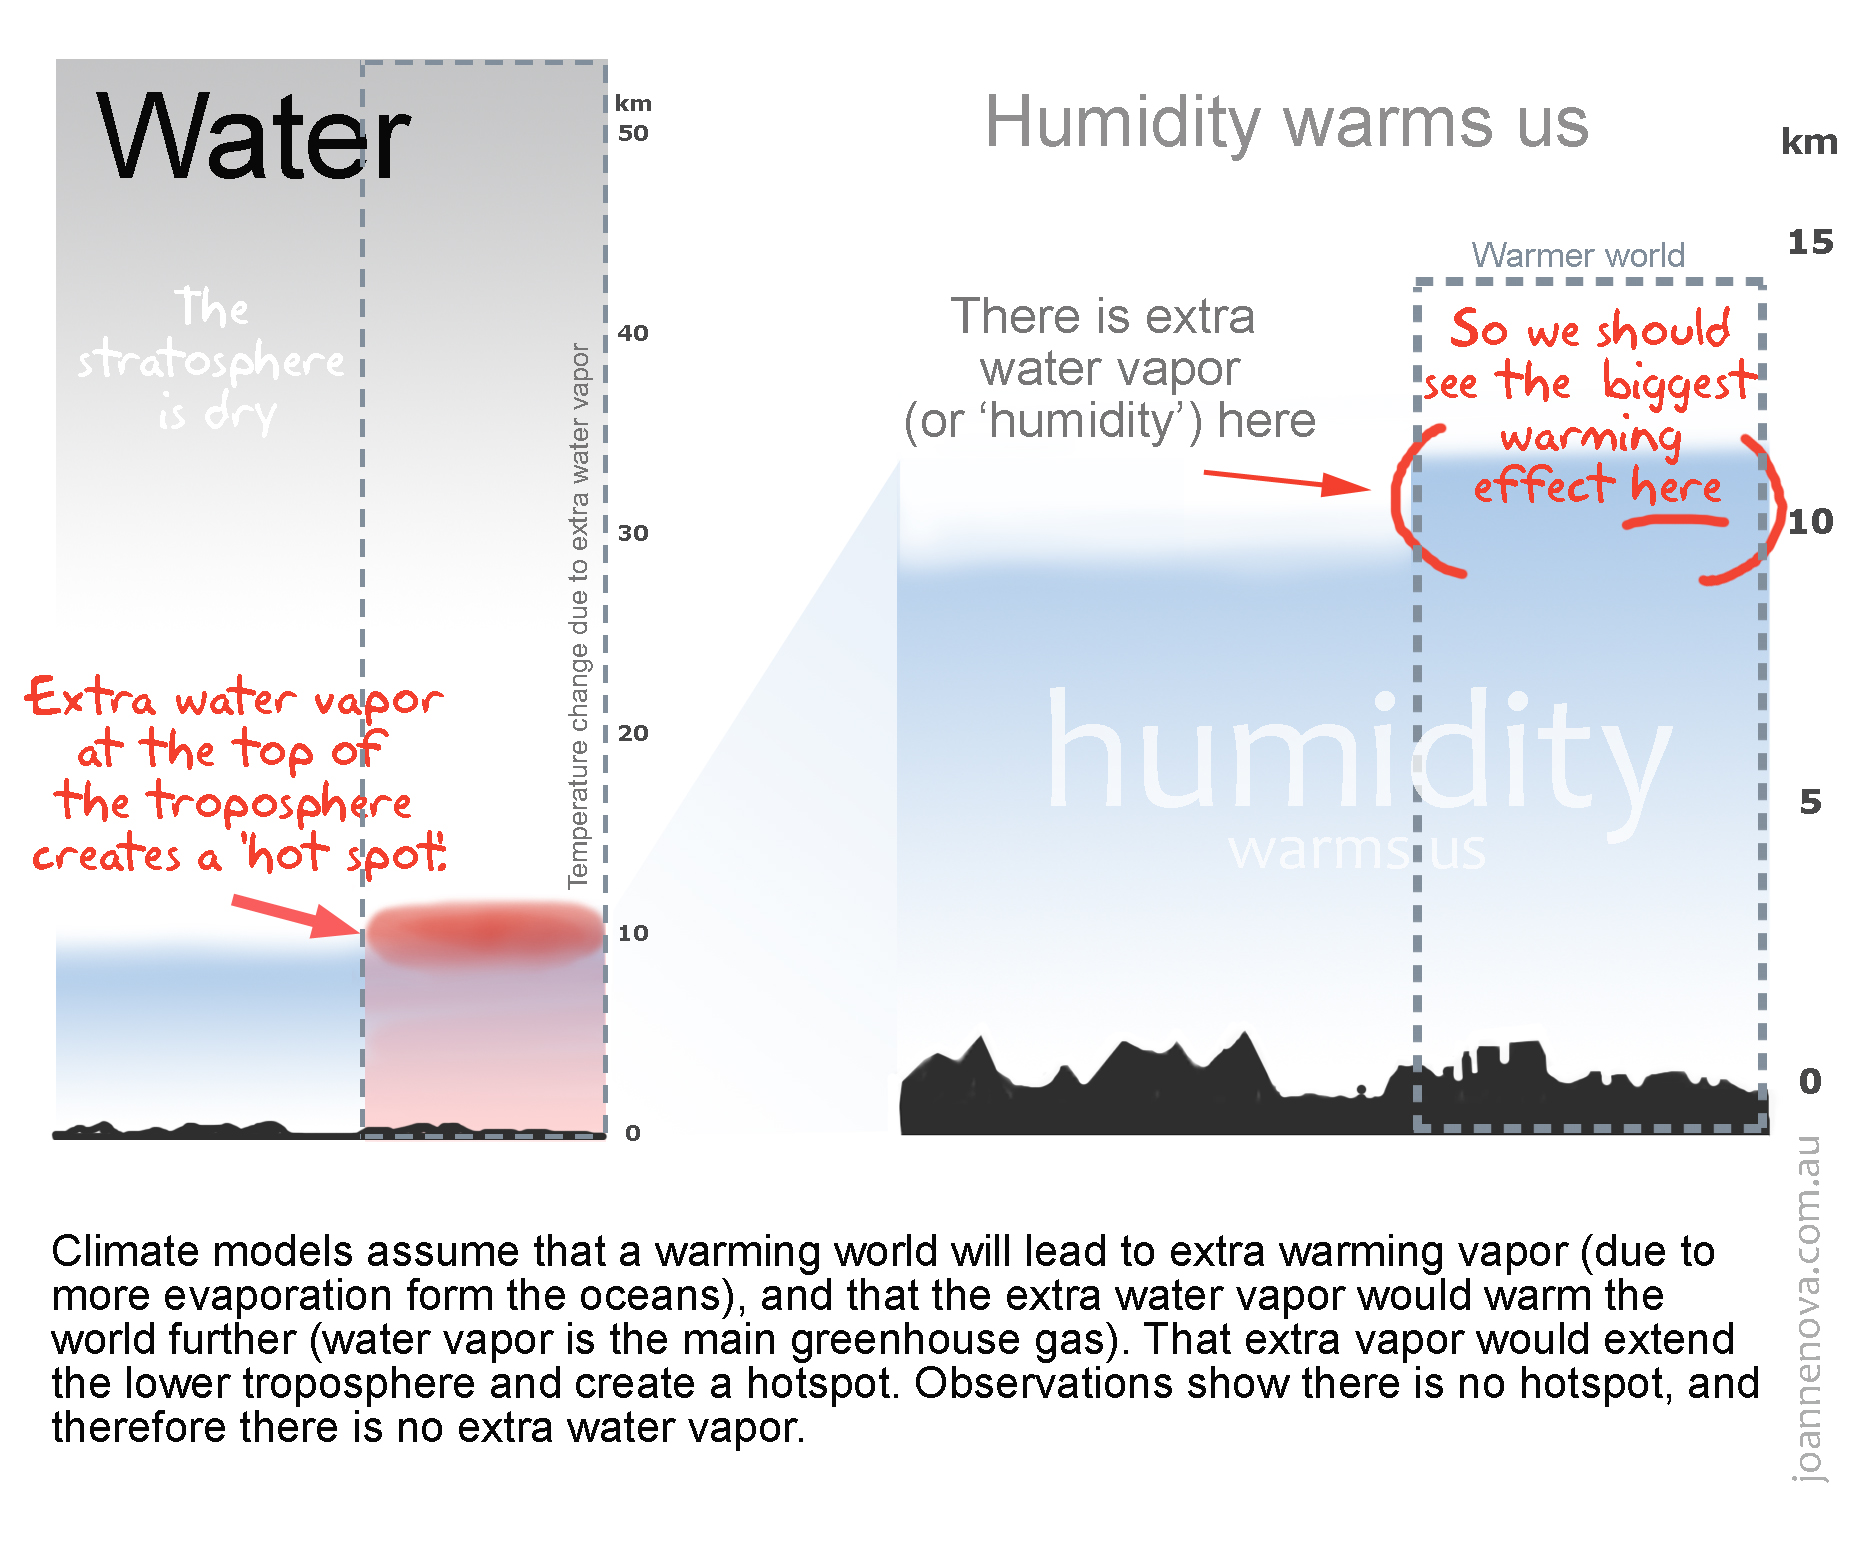
The fingerprint test of the water-vapor feedback is the “hot-spot”, a warming of a band of the upper troposphere 10 km over the tropics. (See the reasons below at the end). The weather balloons were designed and calibrated to measure temperature and humidity as they rise through the sky and right through the hot-spot. Their results are unequivocal: red was not yellow; the spot was not hotter. Supporting this, the specific humidity was also supposed to rise, but fell instead. If the computer models worked on everything else, we might wonder if the millions of observations were biased, but the models didn’t predict the pause, were wrong about humidity, rainfall, drought, and clouds too. They didn’t work on regional, local, or continental scales and can’t explain long term historic climate either. At this point, a scientist would throw out the theory. The weather balloons independently agreed with each other, the humidity results fitted the temperature results, the whole lot was loosely supported by satellites. The data doesn’t need homogenising or kriging or obscure numerical witchcraft.
Instead Steven Sherwood and Nidhi Nishant of UNSW revisited their 2008 technique of homogenizing temperature data by using wind data as well. They homogenised it again. They have iterated the iteration? They’ve also extended it from 2005 to 2013 and changed the “wind shear” component to “vector wind”. Their new homogenized-temp-wind data is below (left). The model predictions of 2005 are centre, and the radiosonde temperature results (before homogenisation etc) are on the right.

The new temperature estimates (Left) might agree with the models (centre), but not with the raw temperatures (right). | Click to enlarge
Sherwood was a co-author of the model projection in the centre from the US 2005 CCSP report (a kind of mini IPCC, known as “Karl et al”). Chapter 5 of the CCSP report used the term “fingerprint” seventy four (74) times. It was that important. Note that color and time scales are different in these graphs. Sherwood could have made these directly and easily comparable, and put them side by side. He is paid to do this.
They’ve iteratively homogenised, but their findings are paradoxical
The fingerprint was strengthened by adding years of irrelevent data
The new study added data from 2005 – 2013, though we have to wonder why — there hasn’t been any global warming of the surface since the late 1990’s, so we wouldn’t expect to find a hot spot in the last 18 years. The hot spot is supposed to warm faster than the surface, but two times zero is still zero. Yet this strange point is the first finding mentioned in the abstract: “First, tropical warming is equally strong over both the 1959–2012 and 1979–2012 periods”. It shouldn’t be. The hot spot should exist from about 1976 to 1999, but not during the non-warming times before and after. In the climate models a hot spot only happens when the surface warms. This result still doesn’t fit the theory. Sherwood et al acknowledge that the rate should have slowed after 1998 but didn’t. They admit that adding in the extra data during the last flat decade is “the main reason why the trends are now slightly stronger than those shown in [Sherwood 2008].” They added data that shouldn’t generate a hotspot, and this helped find one? Sherwood calls this “interesting”, and says it “deserves further scrutiny”. Rather?
The models still have the altitudes wrong, by 1 – 2 km
Their second finding is also more bad news for models: “tropospheric warming does not reach quite as high in the tropics and subtropics as predicted in typical models”. The height is crucial. Higher means cooler, and cooler layers emit less than warmer ones. “…our data indicate that the upper tropospheric warming since 1979 began transitioning to stratospheric cooling at a lower altitude (by about 1–2 km) in nature than in a typical climate model.” If the models have this height wrong, they’re still a long way from understanding our climate. If the top of the water vapor (to one optical depth, looking from space) does not rise, then the water vapor does not amplify the effect of extra CO2 and there is no crisis.
The stratosphere was supposed to cool more but cools less?
Their third finding was that “cooling has slackened in the stratosphere such that linear trends since 1979 are about half as strong as reported earlier for shorter periods.” But wait? Wasn’t stratospheric cooling part of the fingerprint? So all that extra CO2 since 1979 has had less effect than expected?
Independent scientists are setting the science agenda
The press release was quite different from the abstract (perhaps because the central findings raise more questions than they answer). The press release is primarily designed to respond to skeptics, and it openly says so. Forgive me for feeling pleased. We’ve been talking about the hot-spot here for nearly seven years. This site put the missing hotspot on the search-engine map in 2008. Dr David Evans got the first headline about the “hot spot” into the media. The hot spot was the first point in the Skeptics Handbook and the key point in the evidence. For all the posts here see the tag: missing hot spot.The hunt for the hot spot has been so passionate, that in the 2008 paper this new study was following, Sherwood and co. even used deceptive color scale tricks to “find it” where the color of zero was a hot orange-red.
Independent scientists and blogs are setting the agenda in the science debate, supported only by citizens donations (and we do need your help). Sherwood collects a UNSW professorial salary and gets full resources, PhD students, support, and superannuation to produce papers telling us essentially that we can’t even measure the temperature of the upper atmosphere without adjusting the data so much that the homogenized results look nothing like the raw measurements. If the models are that good that we are “correcting” data to fit, why bother taking the measurements? We could just figure out the temperature over Sudan from a computer in Pennsylvania, right?
This is modern bureaucratized science — it’s what 95% certainty means — yellow is red, don’t ask questions — we have to stop the storms.
Compare wind-temperature to modeled simulations
Sherwood has never published a paper admitting the hot spot is missing, except implicitly when he issues another paper that “finds” it. If this paper really shows something new, why was his attitude to the missing hot-spot the same last week, last year, and every year before this discovery?
Credit to the independent scientists fighting for the basic truth in the peer review medium: Fred Singer, David Douglass, Roy Spencer, John Christy, Garth Paltridge, Ross McKitrick, Steve McIntyre, Chad Herman, Benjamin Pearson, and others named in citations below. I’m pretty sure credit for the “hotspot” phrase itself goes to Christopher Monckton.
On satellites: Radiosondes are the best tool to use. Satellites are not as useful for detecting the hot spot since their vertical resolution of the atmosphere is in large bands several kilometers thick, while the movement of the water vapor emission layer is tens or maybe hundreds of meters. The satellites excel at separating longitude and latitude, but not altitude, which is vital for finding the hot spot. Even so, when John Christy et al 2010 looked at the scaling ratio of temperature trends between the right layers, the satellites agreed with the radiosondes — the models were wrong. The upper troposphere should have warmed 1.4 times as much as the surface, but instead satellites suggested it was only warming by 0.8 times the amount at the surface. This was supported by Fu et al 2011.
Water Vapor feedback is the strongest feedback in the models:
See the IPCC graph Chapter 9, AR5, page 819.

IPCC AR5, Chapter 9. The strengths of feedbacks in models. | Figure 9.43 | (a) Strengths of individual feedbacks for CMIP3 and CMIP5 models (left and right columns of symbols) for Planck (P), water vapour (WV), clouds (C), albedo (A), lapse rate (LR), combination of water vapour and lapse rate (WV+LR) and sum of all feedbacks except Planck (ALL), from Soden and Held (2006) and Vial et al. (2013), following Soden et al. (2008). CMIP5 feedbacks are derived from CMIP5 simulations for abrupt fourfold increases in CO2 concentrations (4 × CO2). (b) ECS obtained using regression techniques by Andrews et al. (2012) against ECS estimated from the ratio of CO2 ERF to the sum of all feedbacks. The CO2 ERF is one-half the 4 × CO2 forcings from Andrews et al. (2012), and the total feedback (ALL + Planck) is from Vial et al. (2013).
The radiosonde network
The radiosondes are most concentrated over the northern hemisphere and over land, and are not as common in the southern hemisphere and barely cover the oceans.

Worldwide radiosonde stations (NOAA)
Source: NOAA The integrated Global Radiosonde Archive
The ARSA site estimates there are around 40,000 radiosondes released each month. (The NOAA site above suggests it’s been closer to 50,000 per month. It’s been something roughly like that every month since 1958.) See this post on radiosondes for more information.
The reason the hotspot is where it is (theoretically):
(Click to enlarge) From a post in 2009 and The Second Skeptics Handbook.
Despite the name, the hot spot is actually cold air that is meant to be warming faster than everywhere else in the atmosphere. The idea is that this dry band above the damp water vapor layer becomes humid and warmer as the water vapor rises and reaches higher into the atmosphere. This extra thickness of water vapor matters. The molecules at the top are the VIPs releasing energy to space. (The water molecules down lower emit energy too, but it’s mopped up by all the molecules around: thwarted from escaping.) As the blanket of damp air thickens, the temperature of the top layer of molecules gets colder — it’s one of those rules about the atmosphere — as everything gets higher in the troposphere it gets colder. The reason you care about this (really) is that colder molecules are more sedate boring creatures; they just don’t fling energy into space as well as warmer molecules do. The net effect is that a thicker blanket of humid air warms the planet by slowing the amount of energy lost to space.
For more information see, The one fatal flaw that wipes out the crisis (a brief summary), and the models are wrong, but only by 400% (Herman, McKitrick and McIntyre).
Creative color scale tricks
In 2008 Sherwood used a color changing trick to produce a hot spot graph which appeared quickly in blog-battles. He altered the standard color scale so that even zero degrees of warming would look orange red hot. (It fooled John Cook.) Sherwood has never apologized for or corrected that 2008 graph. The only acknowledgement given was that Cook stopped using the graph, and Sherwood has stopped using that skewed color scale. He is much more restrained this time, but is still not using the standard scheme. In the latest effort a zero-degree-trend is still not the normal yellow, but a neon green. The effect is to make it look as cold as possible and contrast it with the ultra hot red a fraction of a degree away, which implies a stronger signal than the data might suggest. The red scale goes all the way to black, and most of those red-black shades are unnecessary as they aren’t used at all in the graph. The net effect is to artificially generate contrast, and isolate the “hot spot”. Meh.
Press release UNSW:
New publicly available dataset confirms tropospheric hot spot and increased winds over Southern Ocean
Researchers have published results in Environmental Research Letters confirming strong warming in the upper troposphere, known colloquially as the tropospheric hotspot. The hot has been long expected as part of global warming theory and appears in many global climate models.
The inability to detect this hotspot previously has been used by those who doubt man-made global warming to suggest climate change is not occurring as a result of increasing carbon dioxide emissions.
“Using more recent data and better analysis methods we have been able to re-examine the global weather balloon network, known as radiosondes, and have found clear indications of warming in the upper troposphere,” said lead author ARC Centre of Excellence for Climate System Science Chief Investigator Prof Steve Sherwood.
“We were able to do this by producing a publicly available temperature and wind data set of the upper troposphere extending from 1958-2012, so it is there for anyone to see.”
The new dataset was the result of extending an existing data record and then removing artefacts caused by station moves and instrument changes. This revealed real changes in temperature as opposed to the artificial changes generated by alterations to the way the data was collected.
No climate models were used in the process that revealed the tropospheric hotspot. The researchers instead used observations and combined two well-known techniques — linear regression and Kriging.
“We deduced from the data what natural weather and climate variations look like, then found anomalies in the data that looked more like sudden one-off shifts from these natural variations and removed them,” said Prof Sherwood.
“All of this was done using a well established procedure developed by statisticians in 1977.”
The results show that even though there has been a slowdown in the warming of the global average temperatures on the surface of the Earth, the warming has continued strongly throughout the troposphere except for a very thin layer at around 14-15km above the surface of the Earth where it has warmed slightly less.
As well as confirming the tropospheric hotspot, the researchers also found a 10% increase in winds over the Southern Ocean. The character of this increase suggests it may be the result of ozone depletion.
“I am very interested in these wind speed increases and whether they may have also played some role in slowing down the warming at the surface of the ocean,” said Prof Sherwood.
“However, one thing this improved data set shows us is that we should no longer accept the claim that there is warming missing higher in the atmosphere. That warming is now clearly seen.”
DATA:
Credit to Sherwood — the data is supposedly available, though I cannot get anything through this link or variations of it. Presumably that will be fixed.
“The data presented here (v2.01) may be freely downloaded from the lead author’s website.”
REFERENCES
Steven C Sherwood and Nidhi Nishant (2015) Atmospheric changes through 2012 as shown by iteratively homogenized radiosonde temperature and wind data (IUKv2) Environ. Res. Lett. 10 054007 [PDF]
Christy J.R., Herman, B., Pielke, Sr., R, 3, Klotzbach, P., McNide, R.T., Hnilo J.J., Spencer R.W., Chase, T. and Douglass, D: (2010) What Do Observational Datasets Say about Modeled Tropospheric Temperature Trends since 1979? Remote Sensing 2010, 2, 2148-2169; doi:10.3390/rs2092148 [PDF]
Douglass, D.H., J.R. Christy, B.D. Pearson, and S.F. Singer. (2007). A comparison of tropical temperature trends with model predictions. International Journal of Climatology, Volume 28, Issue 13, pp. 1693-1701, December 2007. [Abstract] [PDF]
Fu, Q., S. Manabe, and C. Johanson (2011), On the warming in the tropical upper troposphere: Models versus observations, Geophys. Res. Lett., 38, L15704, doi:10.1029/2011GL048101. [PDF]
IPCC, Assessment Report 4, (2007), Working Group 1, The Physical Science Basis, Chapter 8. Fig 8.14 [PDF] Page 631
Karl et al (2006), Climate Change Science Program (CCSP) 2006 Report, Chapter 1, 1958-1999. Synthesis and Assessment Report 1.1, 2006, CCSP, Chapter 1, p 25, based on Santer et al. 2000; [PDF]
Karl et al (2006) Climate Change Science Program (CCSP) 2006 Report, Chapter 5, part E of Figure 5.7 in section 5.5 on page 116 [PDF]
McKitrick, R., S. McIntyre, and C. Herman, (2010), Panel and multivariate methods for tests of trend equivalence in climate data series. Atmospheric Science Letters, 11: 270–277. DOI: 10.1002/asl.290. Data/code archive. [Discussion on JoNova] [PDF]
McKitrick, R., McIntyre, S., and Herman, C. (2011) Corrigendum to Panel and multivariate methods for tests of trend equivalence in climate data series, Atmospheric Science Letters, Vol. 11, Issue 4, 270–277. DOI: 10.1002/asl.360. [Abstract] [See McKitricks page on model testing].
Fu, Q, Manabe, S., and Johanson, C. (2011) On the warming in the tropical upper troposphere: Models vs observations, Geophysical Research Letters, Vol. 38, L15704, doi:10.1029/2011GL048101, 2011 [PDF] [Discussion]
McKitrick, R. and Vogelsang, T. J. (2011), Multivariate trend comparisons between autocorrelated climate series with general trend regressors, Department of Economics, University of Guelph. [PDF]
NOAA Satellite and Information Service, Integrated Global Radiosonde Archive, Data Coverage. June 8th 2010. [Link]
Santer, B. D., P. W. Thorne, L. Haimberger, K. E Taylor, T. M Wigley,. L. Lanzante, J. R. Solomon, M. Free, P. J Gleckler, P. D. Jones, T. R Karl, S. A. Klein, C. Mears, D. Nychka, G. A. Schmidt, S. C. Sherwood and F. J. Wentz (2008), Consistency of modelled and observed temperature trends in the tropical troposphere. International Journal of Climatology, 28: 1703–1722. doi: 10.1002/joc.1756 [Abstract] [PDF]
Paltridge, G., Arking, A., Pook, M., 2009. Trends in middle- and upper-level tropospheric humidity from NCEP reanalysis data. Theoretical and Applied Climatology, Volume 98, Numbers 3-4, pp. 351-35). [PDF]
H/t to the late Rod Smith — the original dropsonde-man — for giving me some appreciation of the formidable database amassed from weather balloons. His comments in the early days of this blog are still remembered.


“Based on homogenized wind data.”
Blowing hot air?
Abe
293
Jo, your “It fooled John Cook” link doesn’t work but don’t worry – I don’t really need to see further evidence of how easily Cook is fooled.
162
The link to peer-reviewed science that counters Sherwood also appears to be missing.
88
Yes, he’s been published for 3 days and still survives unscathed in the peer-review. Amazing. — Jo
323
Jo
I did my dissertation for my Master’s degree under Professor Krige, who at the time was a consultant for the Anglovaal mining company in South Africa.
He was a truly brilliant individual, so one day I asked him about his system of statistical analysis, which is now known as kriging. My reason was that I had just calculated the same gold reserve figure for a new mine called Deelkraal, but I knew instinctively (as I had worked on a nearby mine) that the numbers were too high.
He responded by saying it only works if you are using statistics from the same population group and if you adjust your result by a known constant.
I knew the Deelkraal drill results divided into two population groups and redid the calculation, which resulted in a much reduced grade and tonnage, which is exactly what happened when the mine was in commercial production.
As for the constant needed for adjustment, this was a figure that had been calculated for this particular orebody in adjacent mines. I cannot remember if this constant was a negative or positive figure, but I suspect it was negative.
So to return to Sherwood’s tosh. You cannot use kriging for results which are a mixture of population groups, such as over the land, over the oceans, or over the poles. I very much fear different elevations/atmospheric pressures should also not be combined.
Also, because the sun is the principal driver of our planet’s temperature, I suspect you should be dividing the kriging analysis into bands of latitude.
And you very definitely should not exclude correctly gathered data just because they contain inconvenient numbers.
As for the correcting constant, I guess you have to go to Planet Zarg, wherever that might be, to get it.
My conclusion on Sherwood’s ‘research’ paper? Mannish at best, complete BS most likely.
302
Oops, I said something not quite correct. It is statistically OK to exclude, or adjust, outlier numbers, as long as the methodology you use is made clear and it can be demonstrated to be free of author bias.
In mining, ultra high grade numbers are usually adjusted downwards by a time proven formula.
112
Would that be anything like averaging averages of different populations , not giving a true average of the entire set ?
21
Can’t wait for Peter Miller’s work to be published, by that I mean somewhere other than on blogs.
[If you want to stake your reputation on such statements then, wait for it to be published with our blessing. In the meantime, a little courtesy to others would be very well received by everyone.] AZ
422
Timboss,
That is a grand idea, first decent suggestion you’ve had, for someone that actually knows what they are on about to use the correct methodology to try to replicate his amazing discovery.
80
Fear not. You won’t even notice the time passing till you don’t read it.
50
””can’t wait for Peter miller’s work to be published..”
Tim,
It just was you goose. You read just read it, although you apparently didn’t understand it.
There is something else you clearly don’t understand. Pal review and journal publication are part of scientific and academic bureaucracy and have nothing at all to do with the scientific method. Science is a method, not an institution. That is why the Fabian “long march through the institutions” failed for the warmulonians. Call to authority or claims of consensus are no match for repeatable empirical experiment.
Here’s an easy experiment anyone can build and run –
http://i48.tinypic.com/124fry8.jpg
it shows you the difference in average equilibrium temperature for two insulated gas columns in a gravity field. The only difference between the columns is hight of energy entry and exit. You can even run it as a simple computational fluid dynamics model –
http://i60.tinypic.com/dfj314.jpg.
Radiative gases play a critical role in our atmosphere. They cool. The column on the left represents our atmosphere. Warming at the surface, and radiative cooling at altitude. The column on the right represents an atmosphere with no radiative cooling ability, with conductive heating and cooling only at the surface. Funny thing Tim, the gas column with no energy loss at altitude super heats, just as our atmosphere would superheat without radiative gases.
“But, but, but” I hear you shriek “That’s not published in a pal reviewed journal!”. Too late, It just got published in new media. Good luck getting it un-published 😉
You can sneer at blogs all you like, but that just means you don’t understand what it means to lose the first major information war of the Internet age. Everything is being recorded. It no longer matters where in the public domain repeatable experiments were published or who published them, only the timing.
30
All Kriging does in this case (using iterated and re-iterated data) is create statistical artifacts with no physicality. How this passed peer review is beyond me.
452
Perhaps it passed because it said what a majority of reviewers where hoping it would say?
351
Alan Poirier
So true
151
Wind data homogenized, color scales trickery, and all of a sudden the hot spot is there. Hmmmm?
Is this a three dimensional hockey stick?
Mann used temperature data and a proxy and screwed them together to make a hockey stick for temperature.
Is Sherwood using Kriging and data homogenization illustrated by a tricky color scale to form a hot spot? Seems that is what he has done. Like Mann, make higher temperature seem to appear where there is none.
132
Excuse me, was that peer review or was it pal review?
132
john karajas
Maybe it’s One Big World UN-Government paid review (through the usual anonymized Swiss homogenized numbered account channels.)
😉
20
So much for KRudd’s “thousands of guys in white coats measuring things”.
60
Peer review is known, from the Klimategate Emails, to be a lot kinder when the peer is a pal.
101
The saturated adiabatic lapse rate used to be 3 degrees F per 1000 ft. and it is used by aircraft to determine freezing levels and the likely formation of ice on wings etc. One can see this with the snowlines which are controlled by freezing temperatures with saturated air. Probably less important now because most aircraft have de-icers, but there have been quite a few crashes due to loss of lift due to ice.
210
Meanwhile, on a different front…
Polar Temperature Recordings ‘Proving’ Climate Change Nothing More than a Guess
=> http://www.breitbart.com/london/2015/05/15/polar-temperature-recordings-proving-climate-change-nothing-more-than-a-guess/
Climate change: New claims ‘murky’ global warming statistics are ‘GUESSED AT’
=> http://www.express.co.uk/news/nature/577281/Climate-change-global-warming-statistics
…You know that “adjusted” numbers game (recordings of weather stations) the Bureau of Meteorology had been playing in Australia? Well, it looks like similar organisations around the world were doing the same thing! Damn those satellites for contradicting their “adjusted” numbers!
284
aussieguy,
I was under the impression that this was common knowledge.
The parent company of The IPCC, Inc., The WMO, LLC., published a guide book for the practice of climatology. GUIDE TO CLIMATOLOGICAL PRACTICES.
Right off the bat, temperatures are assumed to be ‘stable’ a priori. They’re not. There’s enough peer-reviewed and thoroughly scrutinized work that shows temperature to be cyclical, not stable. The cycles are as short as the well-known daily and yearly cycles, to as long as millenial and multi-millenial cycles such as Milankovich and Ice-ages respectively. Other cycles have been identified for time-spans in between the ones I’ve mentioned.
They’re clearly aware of the artifacts that can be produced by the act of homogenization. And here’s where we get into the thick of it.
Any and all hypotheses must be amenable to replication. That any request for original data, non-homogenized data, is met with any number of excuses for not providing the data tells us that there must be something to hide. Requests for the precise methods used, program code, and procedural algorithms (flow charts, etc) are similarly met. Why not just provide the data, provide the methods, allow the replication, and shut those pesky skeptics up once and for all. After all, the scienceis settled, isn’t it?
From the time that Roger Bacon outlined the basic structure of the scientific method and up until just prior to the current climate change debacle, this method served us well. Open data and open methods have always been the cornerstone of scientific enquiry. Open discussion has always been the hallmark of the scientific endeavor; that which has brought excellence in all the fields of science.
Until now.
What changed and why?
What needs to happen in order to stop the dismantling of the scientific method?
How can we return to the mature, productive exchange of ideas through rational discussion rather than the current childish, immature behaviour of insulting those who hold a differing view and of their subsequent, inevitable, and malicious marginalization?
Why should any one have to put up with such behaviour?
Now there’s a couple or three questions that’re just begging for answers.
Abe
322
BTW.
It took me hours to read that guide all the way through back in December when I first stumbled upon it, who remembers how.
My impression is that any and all things wrong in what passes off as climate science and world’s best practice in the fantacy world of today’s CAGW adherents can be traced right back to that book.
Make sure you’re stocked up on pop-corn and/or peanuts before you sit down to have a read.
Abe
243
Sherwood’s paper proves conclusively that homogenising and adjusting and kriging using iterated data can literally produce something out of nothing. QED.
That the artefact of this manipulation produces a hot spot where there isn’t one actually invalidates most of the basic practices common across the whole of the field of Climate Science. Well done. Sherwood has just proved that his whole field of endeavour is a complete mirage, a cipher, or if you’d rather a unicorn on wings of gossamer. It is actually quite a feat to destroy the remnants of credibility left in your whole field in one paper. Quite an achievement.
272
It’s a pity there are no trees growing at that altitude, for more accurate measurement.
322
The Hotspot found at last, hiding out with Shergar & Lord Lucan.
252
Eddie,
And soon to be released from the wicked witch of The West!
92
The only hot spot I can,t think of is between their legs, certainly not between their ears
41
A comparison between (2015) and (2005) is trickier because scales used are irritatingly different, not usual if one wanted to make a easy-to-see valid comparison between two graphs? But is a comparison legitimate given the time frames – a decade (2015) and 41 years (2005)?
At best, (2015) modeled image appears to be a convenient snap-shot when one looks at the NOAA Climate Prediction Centre 30-day loop of analyzed 200-hPa heights and anomalies, see also the US height to standard pressure and temperature table. The altitude of the purported hot spot between the two graphs appears to match in the meaningless modeled snapshot but are the respective modeled temperature values stated and concordant?
102
Manfred, all of the warming from 1959-1999 occurred in the last 20-25 years. Therefore (if we assume there was no cooling in the first 15 (which is a dangerous assumption) that graph of 1959-1999 might look the same if it were just a graph of 1979-1999.
But we are used to seeing graphs which don’t clarify.
For AR4 the team revised and put out one which went all the way from 1890-1999 and looked almost the same.
114
All they need to do is look up in the sky during the day and they’ll see their hot spot.
222
I just did, and it’s not working. it was 7.7C this morning in Broome, about 8C colder than any day last May. Please, bring back that hot spot!
163
Another hot spot has been found:
http://scitechdaily.com/antarcticas-larsen-b-ice-shelf-will-disintegrate-before-the-end-of-the-decade/
A loss of 1600km², from the Antarctic’s 14,000,000km² is a worry. Stories are already circulating that this will cause sea level rises.
30
The operation of positive feedbacks mainly water vapour, as I understand it, has nothing to do with CO2.
A warming climate, whatever the cause, should be accompanied by those positive feedbacks and those feedbacks should feedback on themselves causing runaway warming.
So why should they only become evident in the modern era?
242
And that is the crux of the matter, there is no evidence of a phenomenon similar to CAGW in the geological record. If this phenomenon existed it would be impossible for life to have evolved beyond a single cell status.
The alarmist argument boils down to the ridiculous assumption that all natural climate cycles suddenly ceased circa 1950 to be replaced by AGW.
101
But manalive,
Hansen explained that the water vapor uptake is controlled by the CO2 holding the heat, hence
🙂
31
Manalive,
you are correct, the proposed “strongly positive water vapour feedback” mechanism would result from any warming. This is why the Team were so desperate to destroy Lamb’s work and eliminate the “punitive” MWP and RWP, during which “strongly positive water vapour feedback” clearly didn’t occur.
30
How can this study be worthy of anything when cloud modeling is incomplete and inaccurate.
Why not try to better model cloud production/dissipation taking in to account all the sources of parameter variation, chaotic fluid mechanics, and known physics i.e. day/night cycles, humidity, compress/expansion effects, temperature, pressure, convection, Lapse rates, advection, particulates, chemical make-up, etc…
¯
However if the results of this modeling is true — no just imagine it is 🙂 — then all aircraft flying near or at the equator, and the pilots, and pilots in training, are flying with incomplete data. Hopefully they’ll ensure all the flight training simulator take in to account this (wind homogenized) modeled heat, as pilots must be aware of these things. No doubt all aircraft flight software will have to be upgraded, by order of the UN, to take into account this important wind homogenized heating effect.
/sarcoff
203
Please resubmit after further scrutiny.
Peer Reviewer 1
153
As indeed it does. Now, would you please stop quibbling and provide me with the necessary funding to engage in further model and data scrutiny? Unlike His Eminent Orifice, Al Gore, I have a mortgage you know. You will note that my grant application refers to ‘climate-change‘ as predefined by the UN. There is widespread agreement among the inner circle that the words ‘Climate’ and ‘change’ defined by the COD, will shortly be deleted from the next edition to avoid confusion. We simply cannot permit the sheeple to be unnecessarily confused.
So, in my grant application I have mentioned ‘climate-change‘ at least fifteen times. This is somewhat beyond the required number I know, but it signals my unfettered enthusiasm and devotion to The Cause. My grant submission also contains obligatory linkage to the idea of ‘end times’. And as we all know, further funding is crucial to the meme. Indeed, the same models that we must
scrutinisemassage further tell us that we are at grave risk of being consumed by the greatest climate conflagration ever to which the perfect antidote is a societal-wide eco-marxist, eco-nomic enema. The purgative effect on Gaia will be truly magnificent to behold.So, stop quibbling and damn well give me my funding will you.
/sarc
133
Manfred:
was that linkage to the 1970, 1979, 1982, 1983, 1987, 1992, 1995, 1998, 2002, 2005, 2007, 2009, 2011, 2012, 2013, 2014 or this years “grave risk of being consumed by the greatest climate conflagration ever” claim?
41
Has the Maquarie dictionary been informed that climate-change refers to human induced change and that natural change is to be referred to as climate variability?
11
So is the troposphere warming/expanding and stratosphere cooling/shrinking, or the reverse? Expect more wriggling and weaselling.
143
This is 2015, the year of Paris.
More climate BS will probably be published this year than ever before in human history and as luck would have it (for the alarmists) there is an El Niño brewing, which means global temperatures should be a little higher than normal.
41
Jo,
And they never will! 🙂
Abe
83
Yes, it appears that jamming the data through a certain kind of sieve produces the right answer in one particular context, but it falls apart in other ways.
Though with more creative sieving and iterating the homogenizations I don’t doubt someone could “find” the complete hot spot in all the right moments. What that won’t do is make their models work, or improve their understanding of the climate.
164
Agreed
Also, balloon and satellite measurements have not shown significant increases in humidity although this most important of feedbacks insist that they should
When I asked this question on another serious website, I was given a nonsensical answer: “It doesn’t matter, and why it doesn’t matter doesn’t matter”
Publicly arguing aspects of science is now pointless. The Achilles Heel of CAGW is the affordable supply of reliable 24/7 base load. The MSM have avoided examining this for over 20 years now – like Sherwood’s constant “Return to Hotspot”, the issue is conspicuously highlighted by avoidance of the question
204
Jo,
A lot of your linked documents are broken or out of date. However most documents are available through a web search.
In particular I note that Ross McKitrick is broke but are available through http://www.rossmckitrick.com/
I also consistently get “Sorry ‘www.climatescience.gov’ does not exist or is not available.” I’m denied access.
Could you possibly up date the links?
32
Tom, thanks for letting me know. I do care about the links and will fix them.
To all readers, please report any links that are broken, and if you can find the correct link, I’ll be extra grateful. I would need to fix past posts too. :- (
It’s disappointing that government sites would need to break permanent links. For those of us without I.T. staff it’s an extra chore to check and update.
124
As others have pointed out your link above to “(It fooled John Cook.)” is malformed having extra http:/ added to the end of the address.
your link is this
http://joannenova.com.au/2010/07/the-unskeptical-guide-to-the-skeptics-handbook/http:/
should be
http://joannenova.com.au/2010/07/the-unskeptical-guide-to-the-skeptics-handbook/
40
Hi Jo,
There is a quick and easy way of checking all your links by using a “linkchecker”
here is the link to the software
http://wummel.github.io/linkchecker/
the version you want is v9.3
Pete
20
Hi Jo,
I did a quick check on it by running it against CNN.
It seems robust and more importantly “safe”.
Obviously there are many which you can choose from to perform this clean up task.
have a great weekend
10
Thanks to Tom for the link info. I have fixed all the McKitrick links and the John Cook internal one.
Thanks to the ScotsmaninUtah — I shall have to look it up!
Appreciate your help. :- )
00
Bill Illis,at Watts Up With That,writes:
http://wattsupwiththat.com/2015/05/14/claim-climate-scientists-find-elusive-tropospheric-hot-spot-over-the-southern-ocean/#comment-1935363
http://hadobs.metoffice.com/hadat/images/update_images/msu_timeseries.png
http://data.remss.com/msu/graphics/tts/plots/RSS_TS_channel_TTS_Tropics_Land_and_Sea_v03_3.png
http://data.remss.com/msu/graphics/tts/plots/RSS_TS_channel_TTS_Southern%20Mid%20Latitudes_Land_and_Sea_v03_3.png
142
May 13, 2015:
Cloudiest Places on Earth Revealed by 12 Years of NASA Satellite Data (nbc.news)
42
Sherwood’s actions here just reinforce my comments that scientists today, particularly climate alarmist scientists are most definitely no smarter or more intelligent, maybe less so in many cases than any other citizen in any other industry or proffession or citizens off the street.
After all that is where scientists of every stripe come from, the exact same gene pool and the same levels of intelligence as every other citizen in our society and civilisation.
Some three quarters or more of a century ago, particularly after the great scientific advances just before and just after WW2, Society placed “science” and scientists on a high pedestal when the great advances in physics, medicine and electronics were first invented and then developed.
For close on half a century science deserved it’s place on that pedestal as it fulfilled its part of that great two or thee centuries year old unwritten but well understood contract between science and society.
And that contract was that Society will support science to the fullest extent it could afford .
In return Science undertook to advance our society and our living standards and our personal advancement to the greatest extent it was capable of and possible.
Today science in many fields but fortunately not all fields of research, has now ignored and discarded its part of that great unwritten Social Contract with society.
Nevertheless science still demands that society support science even more lavishly, particularly the most dissolute and integrity lacking and corrupted disciplines in science such as climate alarmism even more lavishly than it ever has in the past.
A situation and demand that clearly reflects the levels of, or the increasing lack of integrity of the so called scientists in those fields of research.
Given the rigidity and complete denial by climate alarmism science that there are other alternative scientific scenarios other than CO2 increases to explain the minute but highly beneficial global increase in temperature there is going to probably be an extremely bitter ending to all of this climate science debacle for both the science and for our society at large.
In the Sherwoods case above and that of many others in the same climate alarmism mentality we see the exact same mentality as that which is very common when a business of any sort is heading towards bankruptcy.
The principals of the business or climate alarmists in this case [ of just about every type, standard and level today ] as they head towards the complete bankruptcy and total failure of their ideology of the great global warming ideological scam there will be an increasing denial about the true situation.
The alarmist scientists will be inventing all sorts of impossible and ill conceived scenarios and impractical strategies to recover the glory days of their supposed high public status and their complete belief that their science was unchallengeable and their hubris in believing they could and would destroy anybody in science or non science who dared to challenge their ideologically based alarmist climate warming, catastrophe predicting claims
The totally arrogant hubris of the high status climate alarmist scientists was revealed for all to see in the Climate Gate mails.
Inventing all sorts of different scenarios which the inventors often come to believe themselves to explain the failures of their past scientific claims in just about every aspect gives them the warm feeling that they will be able to survive this temporary downturn in their fortunes.
Most of all as a part of that deep denial of their real situation and their utter scientific incompetence and their bias and bigotry and complete inability to think outside of their own personal ideological defined beliefs will be to blame their entire failures and lack of success on somebody else, some big, bad ogre such as those damn denier Skeptics or the Koch Brothers.
We see this almost continuously in a steady stream of almost identical and completely fact free wording in the stream of truly vicious, viperous commentary that continues to emanate from the climate alarmist cult believers today.
Never until the final chapter just before complete bankruptcy of a business or in this case, of a scientific consensus created but totally corrupted ideology such as climate catastrophe alarmism will they be capable of recognising that it was their own total incompetence as scientists that destroyed everything they had gambled their entire scientific status and standing on and did so unsupported by the scientific facts and on what seems to be on the face of it, nothing more than it seemed a good idea at the time.
With the mentality of those who are heading towards a business failure and a potential bankruptcy, Sherwood probably doesn’t even realise it but the increasing acceleration towards a bankruptcy of the entire alarmist climate science ideology and cult defines Sherwood’s entire attempts such as this one, to try and find some feeble irrational excuse for the total failures of his and so many other climate alarmist scientists utterly failed claims and predictions of climate catastrophes in the making, claims and predictions whose time has already passed by in many cases and have failed totally to produce any evidence of any sort to support those climate catastrophe claims and predctions.
Sherwoods claims in this paper in all of it’s finality is just another harbinger and predictor of the steady descent into total irrelevancy of the entire alarmist climate science scene and of it’s hard line practitioners.
326
ROM, that is the most succinct encapsulation of the demise of credibility of the climate “science” community that I have ever read. Worthy of publication in the Australian, as is, I believe!
I particularly responded to –
We see this almost continuously in a steady stream of almost identical and completely fact free wording in the stream of truly vicious, viperous commentary that continues to emanate from the climate alarmist cult believers today.
– the warmists who contribute to this site never present true scientific facts and nearly always resort to name calling as their only weapon. Those that occasionally do present excerpts from “expert” papers never come back to support their claims when challenged by some of the real experts on this site.
Thank you for this comment.
135
I don’t think that any of us is in this for the outright disputation for its sake.We are marginalised or sent to purgatory for asking or challenging the orthodoxy.We are relatively powerless but we maintain the correctness of our viewpoint.Until convinced otherwise.
52
I think another hot spot has been found: http://www.theage.com.au/environment/climate-change/nasa-finds-antarctic-ice-shelf-just-a-few-years-from-disintegration-20150515-gh317o.html.
Antarctica is around 14,000,000 sqkm and they have clearly found a hot spot:
(This way off topic) CTS
22
Like so much Global Warming research, this all looks manufactured, more so all the time. It was clear from the start that an increase in tiny CO2 by itself was not enough to warm our planet noticeably, so there was a need to make it do so, to turn coincidence into causality and this theory was born. However neither the primary warming nor the enhancement of extra water vapour have proven to be real. As much as any theory can be disproven, this has been disproven, but they persist. Why?
I think you have to go back to the 1988-1998 period with a sudden, short 0.5C warming which coincided both in time and amount with the switchover error from old thermometers to electronics. Of course projected over 100 years, this meant 5C and so a disaster in the making. However what if it was fake and the explanation more prosaic, an artifact from a switch in instrumentation? Now after 20 more years, this is 5C is now /3. There is a real possibility that the original warming had more to do with the formation of the purpose hungry IPCC.
Still the money train keeps rolling, funding futile, pointless research into either why theory failed or how it is all true after all.
In the world of real science, it is much more exciting to read of the development of fusion reactor and the real possibility of a better world. It is time for Australian Universities to call a halt to the farce of expensive, time wasting research into nothing. Surely Australia has learned from the 50 year CSIRO project to seed clouds for rain or develop a robotic sheep shearing machine? We gave the world the stump jump plough and a tiny component of WiFi. Isn’t that enough? Do we really have to find the hot spot or a Monte Carlo computer search for the Holy Grail?
194
TdeF @ # 19
Don’t know if you have read this but Berniels’ blog articles which are not an easy read but are very factual, gives the history of the beginnings of the whole global warming catastrophe debacle at the Madrid Conference in 1995 and the role that Ben Santer and Houghton and his political masters played in first changing the whole Madrid conference conclusions that maybe a fingerprint of human influences on the climate were there to a conclusion that the finger prints of humanity were definitely changing the climate.
This total turn about in attribution done by a young Ben Santer as editor of the conference proceedings was from a carefully considered and well argued at the conference, “maybe” to a “definite” impact by humanity on the climate without the knowledge and the analysis or any approval by the Madrid 1995 climate science participants of the time.
Followed by Houghton’s and Santers application of their political master’s requirements in creating this whole immensely costly economically and social scientific debacle and it ain’t pretty at all for the main participants.
From another source on another forum about a decade ago I came across a comment that around 300 papers skeptical of any claims of the human impact on the climate through CO2 and sulphur dioxide sent to the Madrid 1995 conference just plain disappeared and were never seen again.
[ “Berneil” whose real name I came across sometime ago but can’t locate now, is a high status scientist with access to all the main participants in the Madrid 1995 and later climate science conferences and meetings and a skeptic as well I gather. ]
The series of articles including the origins of the “Mirror in the Sky”, the “hot spot” of Jo’s headline post can be found as below;
Enthusiasm, Scepticism and Science
on the origins and impacts of Global Warming Alarmism in the history and philosophy of science
Madrid 1995: Was this the Tipping Point in the Corruption of Climate Science
142
Thanks. Incredible. A lot of information and 30 years of disaster hype and 20 years in which everyone agrees the temperature has not changed at all.
“In 1988 James Hansen had told the US Congress that ‘there is only a 1% chance of an accidental warming of this magnitude.’ Under oath he proclaimed that ‘the greenhouse effect has been detected, and it is changing our climate now’”
Is it a crime to be utterly wrong under oath? How much have Hansen and Manne cost the planet?
It would be hard at 74 to reflect on a life time achievement of being so infamously wrong. Is there an Anti-Nobel Prize for atmospheric physics.
111
Hello TdeF,
I thought it was a crime to “mislead the parliament”, at least here, but I’m not aware of the penalties or of any successful prosecutions.
Cheers,
Dave D
60
Rom: thank you for the reminder of Berniel’s comprehensive history of the corrupt processes within the fabric of the IPCC. After the actually inconclusive FAR there was an imperative for strong Summary for Policymakers in SAR to support the Kyoto Protocol in preparation. As you have pointed out this was so critical that dissenting material was actively suppressed. It is indicative of the fact that ALL the parties to the UNFCCC, for their own reasons, wanted the CAGW narrative to be beyond dispute and still do. The outcome of Paris 2015 has been decided and is taking shape. It will be a convoluted continuation of the present stalemate. You (and TdeF ) are homing in on political and ideological reality that, by exploiting the prestige of science, has corrupted it to the point of no repair. Do not abate your efforts.
80
Sheep shearing robot? Are you psychic TdeF? My family and I were wandering through a beautiful Worcester field full of sheep and lambs and pondering that very thing just yesterday. I wondered about a giant potato peeler but thought the animals’ extremities might be at risk! Talk then moved on to the sheep shearing demo and competition at the Three Counties Show…most shearers there come from Australia and NZ.
40
Sorry…a bit off topic train of thought after reading TdeF’s comment.
30
Annie
All we need to do is breed-up sheep with smaller or less extremities, or can assume a better shape when processed during shearing.
Maybe a talented genetic modifier could cross the sheep with a woodlouse then the sheep would roll-up when touched. That way not only automated shearing is easier but also rounding up the sheep as this only consists of rolling them into place.
Problem solved –Next!
🙂
30
Hilarious thought tom0mason. I also wondered about a donner kebab sort of set up but thought the sheep might not survive that.
10
Interestingly they find the hot spot because they want to find it and will find it any damn way they can. It’s interesting as this aligns with a recent post on Judith Currys web site.
http://judithcurry.com/
Psychologist Brian Nosek of the University of Virginia says that the most common and problematic bias in science is “motivated reasoning”: We interpret observations to fit a particular idea.
WE INTERPRET OBSERVATIONS TO FIT A PARTICULAR IDEA
This goes against the principles of real science. The data doesn’t fit so it’s either the theory is wrong or we need to rerun the data or find new data, not massage existing data to fit preconceived notions. If it still doesn’t fit then the theory needs revisiting…. Won’t matter how much you massage the data a square peg still wont fit a round hole. And if you go sanding, cutting, shaving the square peg to fit – then it’s not a square peg anymore…
92
Also, I would say that Richard Feynman’s observations —
and
and
are still true.
111
Why is this gentleman continuing with his snark-hunt at public expense when the IPCC already assumes that the hot spot exists in its climate sensitivity estimates and scary temperature predictions, when the non-existent hot spot is already ‘settled science’.
121
Jo,
reference —
This link http://web.science.unsw.edu.au/~stevensherwood/radproj/index.html will get you there. The difference is in the ‘ ~ ‘ symbol you are using in the link address.
—-
Thanks Tom. Fixed! — Jo
61
I take this latest effort from Sherwood as a very positive sign. It seems a pretty good proxy for the utter desperation in the minds of the CAGWa’s as they get ready for Paris.
This piece of ‘sociopathic sciency schtick art’ tries to conjure up temperature from wind speed when the thermometers don’t reveal it.
What, are the thermometers ‘deniers’ as well?
The only temperature being inferred by wind speed here, in my opinion, is the absolute zero between Sherwoods ears due to the cold wind of reality whistling through.
Joint Aus-UK-Can-NZ Royal commission called for, methinks.
103
I’m not sure sociopathic is quite the right word, but there does seem to be some sort of abnormal disinhibition at work in AGW science, possibly related to frontal lobe abnormalities.
I can’t imagine a normal person going to the trouble of fabricating hot spots, hockey sticks, and correlations without a qualm, even if paid to do so. This goes beyond venality.
40
I can’t get a handle on what is wrong with these people so threw ‘sociopthic’ out there with a few others words just trying to get a vibe of what is going on in their heads. I am Sure La Lewandowsky knows what it is theroetically but he suffers from it too, it seems to me.
30
A bit of an insight into peer review – a true story,I had a prolapsed disc in my lower back that was squashing my spinal cord and I went to see a specialist about surgery ,when I first saw him I was a bit worried he looked as though he had been sampling the drugs cabinet,but I let that pass,he then read my notes and looked at my scans,he made the statement that he couldn’t see anything wrong with me,I replied that I didn’t agree with his diagnose ,he then got upset and pointed out how long he had been training to be a doctor and then asked some of his collegues to come in and look at my scans and reports,they agreed with him,I didn’t have the heart to tell them that they were looking at the wrong scans,after all they were the experts with years of training behind them and those other two doctors would have known but they had to support their colleague(anyone who knows even the slightest bit about the spine knows where L4-L5 is ,and it isn’t between your shoulder blades) .
BTW I went to a different hospital and specialists and had surgery that was successful
143
You have got me interested there GMac,
Which part of the spine were they looking at on your images?
20
With you on that GMac. I know where L4-L5 is cos I have had a similar problem. I ended up getting some good, practical advice via a GP who gave me a book written by a physio. I am an engineer and when he explained what the set up was it was fairly straightforward how to treat it.
It has echos in the CAGW thing in that the ‘fix’ is rest, anti inflammatories, then stretches etc, lose weight and work on the abdominals as against expensive surgery to fuse vertebrae and suffer the side effects let alon ethe costs.
30
Perhaps Ursus Augustus.
There is a lot we don’t know about back pain. Your prescription may work in many cases. It has been known for centuries that most cases will resolve on their own, hence treatment is supportive (eg physio and pain relief).
There are a small number of cases where nerve compression is severe. If GMac had that then he chose the right option.
20
Somehow they have added an artifact and misinterpreted it as a signal.
Fairly easy to do if you mine the data and then massage it enough.
As Feynman said, the thing you have to watch out for is fooling yourself and that is what they have done. As well as the reviewers and the editors of the journal.
122
READ ALL:
boils down to we know nothing, but Hickman ends the main interview with “Okay, brilliant, thank you very much.” before Slingo responds to 3 questions by email:
15 May: CarbonBrief: Leo Hickman: The Carbon Brief Interview: Prof Dame Julia Slingo OBE
Prof Dame Julia Slingo has been the chief scientist at the Met Office since February 2009 etc…
On the 2013/14 winter flooding in the UK: “I can’t give a definitive answer, but all the evidence points to the potential for climate change to have played a role.”
The Met Office’s new supercomputer: “It gives me more confidence in the advice we give to government, to businesses, to public on what climate change might look like.”…
On overinterpreting short-term temperature trends: “There are real issues with looking at too short a time period to define what we believe is climate sensitivity.”…
On the reliability of climate models: “Do I think our models run too warm? No, I don’t.”…
The impact of privatising the Met Office on science: “Oh, it would fundamentally change it …We would not be able to access the observations we need for weather forecasting, let alone climate.”
On transparency and open access to data: “Let’s be clear, everything that’s paid for by the public purse is freely and openly available.”…
CB: Some critics of those models have said that they’re running too warm, or that they don’t match current observations. How do you respond to that, and how will the new computer potentially resolve that?
JS: It’s certainly true that over the last decade, fifteen years or so, the planet hasn’t warmed at the rate one would expect simply from the accumulation of carbon in the atmosphere. We’ve made no bones about that, we’ve been very clear about that and we’re beginning to understand why that is…
One of the important things about climate models is that those that say they run too warm will say that they’re wrong and I will always say climate models are not wrong; they’re incomplete because our knowledge of the climate system is incomplete. We don’t fully understand yet how clouds work, how cloud microphysics works. All science’s knowledge is incomplete and climate science is no different. Our knowledge is incomplete and our ability to represent the knowledge we have in our climate models is constrained by the computer power we have. I can run models at a kilometre scale, I can run them at a few hundred metres with the same codes that I’m running for climate. I don’t have the computer power to do it…
CB: And what’s your latest view on how long this sort of slowdown period could continue for?
JS: Well, we published something recently that certainly said that another five years is possible and, actually, becomes more likely the longer the slowdown progresses. Again, can we make a prediction with any confidence? I’m not sure. Because, again, how far back do we have observations of what the oceans have done in the past on these sorts of time scales? Very, very limited. So, am I confident in the models? As much as I have observations and theory to underpin what they’re doing. And they tell us quite a bit, which, you know, we might be looking at an end of it in five years…
http://www.carbonbrief.org/blog/2015/05/the-carbon-brief-interview-prof-dame-julia-slingo-obe/?utm_source=Daily+Carbon+Briefing&utm_campaign=b1454e79aa-cb_daily&utm_medium=email&utm_term=0_876aab4fd7-b1454e79aa-303449629
71
Not wrong then, just incomplete, settled science. Or the future is certain, we just don’t know how long it will take to get there but another five years is always a good hedge.
40
A talk by Dr Christopher Essex
The missing “hot spot” is indicative of the fundamental problem with climate models.
I think Dr. Christopher Essex adds much to our understanding and discusses the limitations of using such tools.
https://www.youtube.com/watch?v=19q1i-wAUpY
As an Engineer who works with deterministic systems, I know that due to the temporal nature of the systems it is sometimes impossible to verify the outcome.
42
Not being a super scientist, I find all this statisticying totally baffling. If there is a patch of hot, moist, air up there, I would expect that thermometers passing through it would record higher temperatures than they do when in areas around it. And the same sort of thing for hygrometers and humidity.
If they do, it surely would not need fancy statistical techniques to show that. And if they don’t, the warm damp patch isn’t there, regardless of what statistical sorcery can conjure from the vasty deep.
120
What I find somewhat baffling is that the work above tracks trends, rather than actual temperatures. They’re looking at the derivative, a notoriously inaccurate parameter, one that loses information.
70
Derivative products quickly lose sight of the big picture. Aren’t they what drove the Global Financial Crisis?
40
I spoke to meteorologists at the recent Avalon Air Show. They were very confident that their radiosonde instruments recorded; atmospheric pressure, temperature and humidity accurately, even though they move fairly quickly upward through the air.
60
Actual accurate data , the constant bane of climatastrology’s existence
50
They seek it here,
they seek it there,
they seek that hot-spot
every-where,
is it in heaven?
Is it else-where?
That demmed elusive
warming troposphere.
101
Move over Scarlet Pimpernel!
Here comes beththeserf
🙂
50
The 3rd. graph is exactly as I would expect :- Northern Hemisphere hotter due to urban heat islands due to the much larger population. Equatorial regions cooler due to cloud cover.
41
Jo I had some more thoughts on Why Satellites Are No Good for Hot-Spotting.
Jo says:
Jo, one of your recent detractors “Brunswick_Greenie” on Tuesday linked to a satellite-based study of the troposphere which concluded:
Whether that finding counts as The Hotspot might depend on how much you cross your eyes when looking at the satellite microwave channel weighting functions. Jo’s readers might be enlightened from a quick glance at page 11, section 2.2.2.1 of the RSS Climate Algorithm Theoretical Basis Document v3.3. Figure 2 shows how much the signal from a frequency channel is affected by the emissions at various heights. A copy of this diagram is here:
http://i.imgur.com/VfgdJl2.png
The relevant channels for the hotspot are the TTS channels (MSU Ch.3, AMSU Ch.7) which are described in Table 1 as being affected by emissions between the heights 3km – 20km, a range six times larger than the thickness of the hotspot. Even just judging by eye, in Figure 2 you can see far more than half of the area under the TTS curve comes from heights above 14km or below 8 km.
So the hotspot would affect the value of the TTS data product if it were present, but locating a hotspot from such data alone is impossible. It is as impossible as being told the sum of a series of 10 numbers and being asked if the 3rd number is bigger than the 2nd and 4th numbers. With only the sum there is no way to know. The 3rd number affects the total but the 3rd number is unknowable. If you see a trend in the sum over time, it does not tell if it is the 3rd number that is increasing, it could be any of them.
Later, in section 2.2.2.4 of that document, RSS show the height weighting of the lower troposphere channels TLT. That contains only a tiny contribution from heights above 9 km. You may think that you can be clever by subtracting the TLT data from the TTS data to give the temperature of the heights in TTS that TLT is not sensitive to. However the resulting channel weighting still includes heights from 7km to 9km and above 12km up to 16km. The subtraction would only measure the hotspot if the TLT curve ended at precisely 12km and the TTS began at precisely 9km, but they don’t. Remember, any temperature profile which gives the same weighted sum is indistinguishable by this instrument. If the whole column was slightly warmer and there was no hotspot the weighted sum could still be the same as the hotspot scenario.
The difference between upper troposphere and lower troposphere can certainly be guaged with the TTS and TLT data, but any hotspot would still be entirely inside the TTS curve and so can’t be resolved.
On that basis I reckon when Weng and Zhou find “a stronger warming in the upper troposphere than in the low troposphere” they may well be correct but that does not mean they have detected the elusive hotspot, as “upper troposphere” in satellite terms is a much larger range than the hotspot would occupy.
31
Thanks for those links
10
Testing. I’ve tried to make a comment several times today and I seem to get booted out each time.
30
Well you are here this time.
I loved your comment @No. 8
30
These are the numnuts who did the get stuck in the ice at the South Pole costing the taxpayer and US Coastguard several millions.
Homegenised Data – like throw out anything that does not support your theory. Dodgy as.
81
Although it is way off topic, in fact the direct opposite of Jo’s headline post, I’m going to toss in this paper’s title here via WUWT commenter as the discussion on the contribution to ocean heat content from the ocean floor geothermal heating will inevitably be raised sometime again in the future.
So for a reference for anybody interested in this subject, a subject on which the climate nutters are now claiming the “missing heat” has disappeared somewhere into the oceans, this paper;
Geothermal heating, diapycnal mixing and the abyssal circulation
Abstract ;[ sample ]
The dynamical role of geothermal heating in abyssal circulation is reconsidered using three independent arguments.
&
For strong vertical mixing rates, geothermal heating enhances the AABW cell by about 15% (2.5 Sv) and heats up the last 2000 m by ∼0.15◦ C, reaching a maximum of by 0.3◦ C in the deep North Pacific.
Prescribing a realistic spatial distribution of the heat flux acts to enhance this temperature rise at mid-depth and reduce it at great depth, producing a more modest increase in overturning than in the uniform case.
In all cases, however, poleward heat transport increases by ∼10% in the Southern Ocean.
The three approaches converge to the conclusion that geothermal heating is an important actor of abyssal dynamics, and should no longer be neglected in oceanographic studies.
40
It is not just that the hot spot is not there and a key prediction has failed.
Not finding warmer water vapour at this position proves amplification of the CO2 greenhouse gas effect is not happening and all scientists agree the CO2 increase by itself cannot dangerously heat the planet.
No hot spot, no problem. Game over.
This is a search for a spectral ghost in the data.
90
Here’s one for you all. . .
NASA: 10,000-Year-Old Ice Shelf in Antarctica Will Soon Be Completely Gone
20
Usual stuff. Never seen anything like it! Ha! What arrant nonsense.
100 years ago very brave adventurers had just reached the poles. Man was still forty years away from even reaching the top of Everest and no one had dreamed of satellites and digital transmission from cameras and helicopters. We knew nothing about the poles.
Now ‘scientists’ write as if ice shelves have never broken away in 10,000 years. How could they possibly know? We are just infants studying with satellite tools we have had for such a short time. Antarctica is not some tiny island. Antarctica is the size of South America with mountain ranges up to 16,000 ft and covered in 4km of ice! At -50C it is not melting any time soon.
While these ‘scientists’ agree that floating ice will not raise sea levels, but suggest that something might happen. This is deliberate scaremongering posing as science. It is also nonsense. The more we learn about these arctic regions, the more we know how much we have to learn. To go from utterly ignorant to all knowing just takes a few wild ideas it seems. Arguing from authority as a scientist on subjects which no one fully understands is just offensive.
Now if someone can come up with a reasonable explanation even for why Antarctic sea ice is currently at a maximum in both size and thickness, it would be interesting reading. No waffle about the Ozone hole please and natural variation is not an explanation.
Trying to argue that CO2 increase causes global warming of the oceans alone is absurd. Even the simplest air temperature predictions are wrong and while warmer waters can happen, the idea that this is caused by a CO2 increase is not science. However warming water would increase CO2. That is well known. However it is not what Green communist politicians and the UN want to hear. Paris is their last chance to snatch victory from the jaws of defeat.
So let us fear icebergs now. At least there will be no Polar bears on them.
71
Well said TdeF!
🙂
Add some perspective on the size of Antarctica from this link ❗
So now where are those calving not melting glaciers, and compared to all of the Antarctic how much ice loss is that? Less than 1% ❓
😕
51
Yes, the recent story about melting ice in Antartica, 19 billion tons works out to a tiny 6mm over this huge area and over ice 2km to 5km thick. Put another way, nothing is melting and as you say, calving is not melting, just a predictable and regular and unavoidable mechanical process as the ice starts to float. Why are people trying to whip up these crazy scares?
When Chris Turny and his Ship of Fools landed in Commonwealth Bay expecting no ice, they were only at 67 South, still 2600km away from the South Pole. In the North, they only be in Sweden on the arctic circle.
51
This hot spot at 10 kms altitude is great news for the aviation industry.
Very soon we will be able to toss out aircraft wing deicing systems. The wings will not ice up AND if the hot spots get much hotter, we might have to increase engine cooling for high altitude aircraft.
Isn’t it so exciting?
61
From a quick glance at the figures, and to my untrained eye in these matters, there is as much heating happening further up in the atmosphere from cosmic dust burning up during entry.
See, “Atmospheric entry heating: A criterion to distinguish between asteroidal and cometary sources of interplanetary dust” by GJ Flynn and published by (it could only be 🙂 ) Icarus ($$$pay for document site £££)
and
“The distribution of temperature maxima for micrometeorites decelerated in the Earth’s atmosphere without melting”
Authors P. Fraundorf — available at Wiley ($$$pay for document site £££)
20
It is odd the cult of CAGW appears to be incapable of doing holistic, critical analysis. Climate ‘science’ theories make predictions are physically constrained. The paper that assertion they have found the tropical tropospheric warming must explain why there is almost no tropical region warming.
If A (tropical tropospheric warming) is true then B (tropical region warming) must also be true (observed). The corollary is that as B (tropical region warming) is not true (did not occur) then A (tropospheric warming) is not true. Likewise if A (tropical tropospheric warming is occurring) is true then as the CO2 forcing is logarithmic proportional to the amount of CO2 in the atmosphere, then the planet should warm in a wiggly fashion where the slope of the increase in planetary temperature is due to the CO2 increase and the wiggles are due to natural variation. What we observe instead is no warming for 18 years.
Clearly the most amount of tropospheric warming occurs in the tropics not in high latitude regions. That makes sense as the most amount of long wave radiation that is emitted to space is in the tropics not in high latitude regions.
http://www.eoearth.org/files/115701_115800/115741/620px-Radiation_balance.jpg
https://wattsupwiththat.files.wordpress.com/2015/05/clip_image042.gif
http://www.drroyspencer.com/wp-content/uploads/TMI-SST-MEI-adj-vs-CMIP5-20N-20S-thru-2015.png
There is almost no theoretical direct warming in the lower regions of the troposphere due to the increase in CO2 as the lower regions of the troposphere is saturated. The saturation of the lower regions of the troposphere occurs as the long wave absorption of water and CO2 overlap. High in the troposphere there is less water so that is the region where theoretically there should be the most CO2 warming.
1) Latitudinal Warming Paradox
The latitudinal temperature anomaly paradox is the fact that the latitudinal pattern of warming in the last 50 years does match the pattern of warming that would occur if the recent increase in planetary temperature was caused by the CO2 mechanism.
The amount of CO2 gas warming observed is theoretically logarithmically proportional to the increase in atmospheric CO2 times the amount of long wave radiation that is emitted to space prior to the increase.
As gases are evenly distributed in the atmosphere (ignoring very heavy or very light gases which biases the distribution in the atmosphere with elevation), the potential for warming due to CO2 should be the same at all latitudes.
The amount of warming is also proportional to amount of long wave radiation that is emitted to space prior to the increase in atmospheric CO2.
Now we know that as the earth is a sphere the tropical region of the planet receives the most amount of short wave radiation and hence also emits the most amount long wave radiation to space. The tropical region of the planet should have hence warmed the most due to the increase in atmospheric CO2.
There is in fact almost no warming in the tropical region of the planet. The observed warming is at high latitudes rather than in the tropics. This observational fact supports the assertion that the majority of the warming in the last 50 years was not caused by the increase in atmospheric CO2.
As it is a fact that there is in the paleo record cycles of high latitude warming and cooling that correlate with solar cycle changes and solar activity has the highest in 8000 years in during the last 30 years, the no brainer answer for what caused the high latitude warming is solar cycle modulation of cloud cover.
P.S. The fact that there has been almost no tropical tropospheric warming also rules out an increase in TSI (total solar radiation) as the cause of the warming, in addition to the fact that TSI has not significantly increased. If TSI did increase the tropics would warm more than the poles of the planet.
http://arxiv.org/ftp/arxiv/papers/0809/0809.0581.pdf
52
To warmists it matters a lot,
To find the missing hot-spot,
Which they think must exist,
As the models insist,
Which are wrong;but it’s all that they’ve got.
90
Warm moist air will always rise because it is lighter than cool dry air, and that moisture must continue to rise until it cools sufficiently to start condensation and thus get heavy enough to stop rising. The process is controlled by the properties of the water.
During the summer (in most temperate parts of the world, excluding extremely dry areas) the tropopause rises, while in the winter it falls. Higher altitude of the tropopause means greater surface area for radiation of energy into space (the Earth is round after all). Do we see any positive feedback causing runaway warming every summer?
We also know that the altitude of the tropopause is higher in the tropics, and lower near the poles. Does this cause the tropics to become unstable and have wild temperature swings? No, quite the opposite actually, temperature is more stable in the tropics and less affected by seasons, also less affected by climactic fluctuations on longer timescales. Temperature swings get more significant as you go toward the poles… the water vapour is a stabilizing negative feedback mechanism. If the Earth was bare rock with no atmosphere, then the equatorial regions would be far too hot to live in, and the poles would be far too cold to live in. Convection plus latent heat of water is the primary heat transport mechanism that cools the tropics and redistributes this heat both upwards and sideways, thus cooling the warmer regions and warming the cooler regions.
31
The “missing hot spot” found from ‘homogenized “wind” data’ = a bag of hot air!!!
32
Hmmmmm ……. probably mixed with excess methane! 🙂 🙂
32
That Sherwood be a big wind, wouldn’t it? 😉
21
Better run for cover I would think.
21
Oh come on now. Little red thumb, where is your sense of humor?
10
Since there was some mention of the stratospheric “finger” print let’s have a look:
In these two plots TLS is inverted to compare to surface temps ( SST ). First plot is est Pacific warm pool vs tropical TLS
https://climategrog.files.wordpress.com/2015/05/tls_wpwp_sst.png
Surprisingly similar with the notable exception of the cooling of WPWP during 1987/88 and 1997/98 El Ninos.
Second is global ave TLS vs southern hemisphere SST ( 20S-70S )
https://climategrog.files.wordpress.com/2014/07/tls_icoads_70s-20s.png
There is a step change to cooler TLS after each major eruption and pretty flat since 1996. The ocean temp takes a few years to rise up to the new level due to its thermal inertia.
A more credible to “fingerprint” would be a volcanic one. Changes in optical properties of the stratosphere initially cause TLS warming but then reverse to a strong cooling. The opposite happens in surface temps.
These step changes can only be made into AGW “fingerprints” by ignoring the step nature of the change and attempting to draw a straight line through it.
10
“NASA reputation is not what it used to be”
A coalition of 49 ex-NASA employees, including seven Apollo astronauts, have accused the U.S. space agency of sullying its reputation by taking the “extreme position” of concluding that carbon dioxide is a major cause of climate change.
“We believe the claims by NASA and [the Goddard Institute of Space Science], that man-made carbon dioxide is having a catastrophic impact on global climate change are not substantiated, especially when considering thousands of years of empirical data,” reads the letter, addressed to NASA administrator Charles Bolden, Jr. “We request that NASA refrain from including unproven and unsupported remarks in its future releases and websites on this subject.”
NASA administrator Charles Bolden Jr and NASA chief scientist Waleed Abdalati need to be fired.
10
Thats it.??
Thats your best attempt at “defending” this junk.???
It just was published..so how could there be another paper correcting it.?
Is your lack of intelligence so removed..that you could make such a buffoon of yourself with that query.?
Cricket noises about the earlier tampered temp color scale in the graphic above.
Cricket noises on using wind speeds to aid in getting a temperature measurement..and on and on.
The academics behind this rubbish know its trash..but at least they are doing it for $..Noble Cause Corruption etc
But the sheeple like “imboss” ….sweet baby jesus what is their excuse..?
10
They don’t need an excuse. They just are.
Abe
00
Some of these “scientists” need to be put on trial for torturing data.
20
“We deduced from the data what natural weather and climate variations look like, then found anomalies in the data that looked more like sudden one-off shifts from these natural variations and removed them,” said Prof Sherwood.
Bwahahahahahahahahahaah!
And then in the next breath these same turkeys will tell you those extreme weather events/perturbations are a critical sign from Gaia.
No climate models were used in the making of this picture folks! Strictly linear regression and Kriging for us and wacky stuff like perturbation theory be damned because ‘under some circumstances, perturbation theory is an invalid approach to take. This happens when the system we wish to describe cannot be described by a small perturbation imposed on some simple system’ or it’s impossible to separate the whopping big assumed perturbation from the mind bogglingly complex system.
I’m off to finish my cuppa so I can get to the bottom of it all with inspiration and a sign from Gaia.
10
“U.S. Hurricane forecast for 2015”
The NOAA Hurricane Center has forecast a “below average” season for hurricanes in 2015.
However the BBC has forecast an “average AND lower than average” season for hurricanes in 2015.
http://www.bbc.com/weather/feeds/32597388
Auntie BBC ! makes one feel warm and cozy … 😮
I hope Australians do not have the same reverence for their ABC.
00
http://www.theguardian.com/environment/climate-consensus-97-per-cent/2015/may/15/new-study-finds-a-hot-spot-in-the-atmosphere “And this is exactly how models are supposed to work. Models can be used to predict changes that will occur in the future. Once we make measurements, we can compare them with the models. If the two disagree, it either means our models are wrong, our measurements are wrong, or both are wrong. More often than not, the models have been found to be vindicated. In the case of the tropospheric temperatures, initially the models and experiments disagreed. Both were rechecked and scientists found the experiments were misinterpreted. When improved experiments were obtained, we see atmosphere temperature studies in agreement.”
http://www.theguardian.com/environment/climate-consensus-97-per-cent/2015/may/15/new-study-finds-a-hot-spot-in-the-atmosphere
00