Recent Posts
-
Blackouts and maintenance problems hit farmers forced onto solar and batteries in Western Australia
-
Tuesday
-
Monday
-
Sunday
-
One Nation are now the Party of the workers, and Labor the party of wealth and academics
-
Saturday
-
Net Zero anyone? USA bets big on coal and gas — overtakes China in spending.
-
Friday
-
Winning: Trump persuades The World Bank to drop its huge spending target on “climate”
-
Thursday
-
Bafflement?! Germany, a global leader in renewables but has one of the highest EU electricity prices
-
Wednesday
-
Horse-drawn carriages must have caused a Megadrought in Europe in 1540, right?
-
Tuesday
-
Monday
-
Sunday
-
UK facing devastating 36 degree heat — can’t decide whether to use air conditioners or rip them out
-
Saturday
-
Batteries failed on day One: A four day wind drought in South Australia wreaks havoc, high prices
-
Friday
-
The UN wants to be One World Government and it starts with a carbon tax on ships and planes
-
Thursday
-
What if Global Warming was just because something made the clouds go away…
-
Wednesday
-
Snowy 2.0 is the Trillion dollar Black Hole of Australia — sucking in energy, money, land, industrial relations, the dollar, our lifestyle
-
Tuesday
-
Monday
-
Winter Solstice
-
Saturday
-
We were throwing-renewable-energy away at record levels in 2025
-
Friday
-
Pauline Hanson, the centrist, just wants a free market in electricity, and an end to the renewable energy bribery
-
Thursday
-
Blame the Climate Yeti again for making your life more expensive! (It’s a smokescreen)
-
Wednesday
-
The Sunrise Project funneled $343 million from overseas to push net zero
-
Tuesday
-
Monday
-
Sunday
-
The US government has been secretly funding 120 dangerous biolabs around the world
-
Saturday
-
New report shows renewables are a drag on our national productivity
-
Friday
-
Thursday
-
Well, how convenient. AI data centers have arrived to be the fall guy for the Energy Minister
-
Wednesday
-
Billionaires are leaving the room with excuses — Bezos says “AI will solve climate crisis”
-
Tuesday
-
Monday
-
Sunday
-
The Craziest eco laws against Farmers. Let’s check that science…
-
Saturday
|
Nicola Scafetta has a new paper (in long line of papers) on a semi-empirical model which has a better fit than Global Circulation Models (CGM) favored by the IPCC. We ought be careful not to read too much into it, but nor to ignore the message in it about the grand failure of the GCM’s. Scafetta used Fourier analysis to find six cycles, then uses those six cycles to produce a climate model he runs for as long as 2000 years which seems to match the best multiproxies. In terms of discovering the absolute truth about the climate, this is not an end-point way to use Fourier analysis, as it is just “curve fitting” With six flexible cycle frequencies (plus amplitude and phase) there are 18* 6 tuneable parameters, more than enough to model any wiggly line on a graph, and there are scores of astronomical cycles to pick from. *.[Nicola Scafetta replies to this below, pointing out he uses the “6 major detected astronomical oscillations”, and their phases are fixed. I am happy to be corrected. His model is more useful than I thought. Apologies for the misunderstanding. – Jo]
But Scafetta’s work suggests it’s madness not to pay attention to astronomical cycles, and points to major flaws in the IPCC simulations. Compare the two types of models: Scafetta’s simple model uses [natural astronomical] cycles and assumes there is a connection [there might be, it is speculative] but curve fits to produce predictions**. The unverified IPCC models assume CO2 has a powerful influence (backed up by laboratory experiment, but not backed up with empirical data from the climate) — then the IPCC assume powerful positive feedbacks that more than double the effect of CO2 (without empirical evidence to support those assumptions) and in a sense, curve-fits volcanic, solar, and aerosols to flex the line to match the data. We know the IPCC models don’t work, they don’t hindcast the last 2000 years, and didn’t predict the last 20. It obvious from Scaffetta’s work that we ought be investigating these natural cycles, and that the IPCC models are hopelessly incomplete.
1. The IPCC depends on the claim that their models include all the important forcings. Their attribution claim has always been “we can’t model the recent temperature rise without using CO2 forcings”. This is argument from ignorance, and Scafetta shows just how ignorant it is.
2. IPCC models don’t produce natural cycles. IPCC models are missing important natural forcings (if only we knew what they were). Scafetta takes the thermometer records, and the paleoclimate records, points at natural cycles, some of which are well known and long established, some of which are purely speculative, and shows how the IPCC models do not produce the same natural cycles. If those cycles (or ones like them) have a physical cause it means the IPCC models don’t include those forcings. A monster flaw.
3. Look at the “pause”, the long plateau in temperatures. The IPCC favoured models failed to predict it (von Storch). The natural cycles might explain the flatness in global surface temperatures since 2000. A simple solar-astronomical-model based on these natural patterns outperforms the inadequate, over-rated, billion-dollar-IPCC models. The caveat being that in a chaotic system the true natural cycles may be difficult to discover.
4. Natural cycles may be driven by the orbits of planets and their effects on the sun. This is speculative, but very much worth discussing. According to Scafetta, there may be natural cycles of 9.1, 10–11, 19–22 and 59–62 years. (Several of these cycle lengths also appear in Ian Wilson’s work on a mechanism where lunar tides in our atmosphere may help trigger ENSO conditions). It is believable that the resonant effect of the orbits of planets acts on the solar dynamo, in ways we do not yet know, affecting it’s luminosity and magnetic field, and that these small solar changes are then amplified on Earth’s climate. (See, e.g. Svensmark and cosmic rays, or Lam et al 2013, who found the solar wind may influence Rossby waves and atmospheric pressure.)
5. Monopolistic science funding has taken years to not find the answer. Many research programs and grants have focused on making a CO2 driven model work. How much money have governments spent figuring out role of natural cycles in a climate that has always changed? If governments could tax planets, there might be 23 solar-system coupled climate models, and they might just work a whole lot better than the CO2 ones.
IPCC Climate models don’t match the turning points
I have long said that it was obvious the CO2 theory does not fit the data because the models were not able to reproduce any turning points in our climate. The models don’t explain why the world was warm in the medieval times, cool 300 years ago in the little ice ages, nor do the models explain the shorter 30 year cool periods in the last 150 years either.
Fig 17 (below) shows how climate models (GCM simulations) fail during the last 13 years, overdo the volcanic cooling spikes, fail to reproduce the well known cooling period from 1880-1910.
 Fig 17 A reproduction of Fig. 1 in Gillett et al. (2012)with additional comments that highlight the major mismatches between the GST record (black) and a set of simulationsmade with
CanESM2. The figure highlights problems common to all CMIP5 GCMs. From Scafetta (2013a).
8.8 out of 10 based on 60 ratings
” I’m over and over
tryin’ to excuse your point of view
I’m over and over
Your slant and bias too
I’m over and over
being treated like a fool
And I’m over and over
continually funding you..”
“When it’s over you’ll discover
What a free market can do
Keep reading →
8.6 out of 10 based on 84 ratings
“…the role of the Sun is one of the largest unknowns in the climate system”
Meteorologists are already aware that changes in the interplanetary magnetic field (IMF) can affect the polar regions of Earth. Now, for the first time Lam et al report the magnetic field appears to influence atmospheric pressure in the mid latitudes. Lam compared the average surface pressure at times when the magnetic field is either very strong or very weak and found a statistically significant wave structure similar to an atmospheric Rossby wave. They claim to show that this works through a mechanism that is a conventional meteorological process, and that the effect is large enough to influence weather patterns in the mid-latitudes. The size of the effect is similar to “initial analysis uncertainties” in “ensemble numerical weather prediction” (which I take to mean “climate models”).
They are suggesting that small changes in this solar influence on the upper atmosphere could produce important changes through “non-linear evolution of atmospheric dynamics”.
Jo suggests that IPCC-favoured climate models don’t include any solar magnetic effect at all, which is just one of many reasons why they don’t work.
The large scale wandering convolutions of the jet stream around the planet are Rossby waves (usually 4 – 6 in number). Some of these become very pronounced and detach into cells of warm or cool air. Jet streams have been recorded traveling at nearly 400km per hour and the path of the jet stream is known to steer cyclonic storm systems in the air below.

Rossby Waves in the Polar Jet Stream
Abstract
The existence of a meteorological response in the polar regions to fluctuations in the interplanetary magnetic field (IMF) component By is well established. More controversially, there is evidence to suggest that this Sun–weather coupling occurs via the global atmospheric electric circuit. Consequently, it has been assumed that the effect is maximized at high latitudes and is negligible at low and mid-latitudes, because the perturbation by the IMF is concentrated in the polar regions. We demonstrate a previously unrecognized influence of the IMF By on mid-latitude surface pressure. The difference between the mean surface pressures during times of high positive and high negative IMF By possesses a statistically significant mid-latitude wave structure similar to atmospheric Rossby waves. Our results show that a
mechanism that is known to produce atmospheric responses to the IMF in the polar regions is also able to modulate pre-existing weather patterns at mid-latitudes. We suggest the mechanism for this from conventional meteorology. The amplitude of the effect is comparable to typical initial analysis uncertainties in ensemble numerical weather prediction. Thus, a relatively localized small-amplitude solar influence on the upper atmosphere could have an important effect, via the nonlinear evolution of atmospheric dynamics, on critical atmospheric processes.
 Figure 1 The field significance is strongest in the Southern Hemisphere, but also high (< 5%) for all regions except the equatorial.
Keep reading →
8 out of 10 based on 61 ratings
I’m very glad to see this point being made in the mainstream media. Earth is a water planet (yet the models don’t do clouds, rain, snow or humidity well). This is pitched for The Washington Times audience, not a science blog, but it’s a point well made, and it’s good to see the point about positive feedback from water vapor, which I (and David Evans) have been making for so long, is getting out to the mainstream press. Readers will also find the North Atlantic hurricane statistics on predictions versus outcome rather stark. – Jo
————————————————————————————————————————-
Climate change is dominated by the water cycle, not carbon dioxide
By Steve Goreham
Originally published in The Washington Times
 … Climate scientists are obsessed with carbon dioxide. The newly released Fifth Assessment Report of the Intergovernmental Panel on Climate Change (IPCC) claims that “radiative forcing” from human-emitted CO2 is the leading driver of climate change. Carbon dioxide is blamed for everything from causing more droughts, floods, and hurricanes, to endangering polar bears and acidifying the oceans. But Earth’s climate is dominated by water, not carbon dioxide.
Earth’s water cycle encompasses the salt water of the oceans, the fresh water of rivers and lakes, and frozen icecaps and glaciers. It includes water flows within and between the oceans, atmosphere, and land, in the form of evaporation, precipitation, storms and weather. The water cycle contains enormous energy flows that shape Earth’s climate, temperature trends, and surface features. Water effects are orders of magnitude larger than the feared effects of carbon dioxide
Sunlight falls directly on the Tropics, where much energy is absorbed, and indirectly on the Polar Regions, where less energy is absorbed. All weather on Earth is driven by a redistribution of heat from the Tropics to the Polar Regions. Evaporation creates massive tropical storm systems, which move heat energy north [and south says Jo] to cooler latitudes. Upper level winds, along with the storm fronts, cyclones, and ocean currents of Earth’s water cycle, redistribute heat energy from the Tropics to the Polar Regions.
The Pacific Ocean is Earth’s largest surface feature, covering one-third of the globe and large enough to contain all of Earth’s land masses with area remaining. Oceans have 250 times the mass of the atmosphere and can hold over 1,000 times the heat energy. Oceans have a powerful, yet little understood effect on Earth’s climate.
Even the greenhouse effect itself is dominated by water. Between 75 percent and 90 percent of Earth’s greenhouse effect is caused by water vapor and clouds.
Yet, the IPCC and today’s climate modelers propose that the “flea” wags “the dog.” The flea, of course, is carbon dioxide, and the dog, is the water cycle. The theory of man-made warming assumes a positive feedback from water vapor, forced by human emissions of greenhouse gases.
The argument is that, since warmer air can hold more moisture, atmospheric water vapor will increase as Earth warms. Since water vapor is a greenhouse gas, additional water vapor is presumed to add additional warming to that caused by CO2. In effect, the theory assumes that the carbon cycle is controlling the more powerful water cycle.
Keep reading →
8.7 out of 10 based on 126 ratings
This song is growing on me. It didn’t grab me in the first verse, but I was definitely smiling by the middle. A rollicking… satire.
I could see this going down very well at the right party. :- )
Thanks to James Black, a Tropicarnival music award winner, see his site. This song is part of an album “Songs From Inside The System”, and I hear it started as a short poem here. Support the musician who doesn’t follow the same meme as so many others, there are plenty more songs yet to be written about our collective craziness.
My favourite lines:
“Paying your carbon taxes,
paying trillions to the goldman saches,
surrender your neurology,
to the church of climatology,
that science garbology,
is new world theology.
Keep reading →
8.7 out of 10 based on 65 ratings
…
7.8 out of 10 based on 22 ratings
Popular Science — a 141 year old science and technology publication — have announced they’re shutting down their comments entirely. Apparently they can’t cope with open debate of contentious scientific areas like climate change.
As usual, there are pat lines about “fostering debate” even as they close it down.
“It wasn’t a decision we made lightly. As the news arm of a 141-year-old science and technology magazine, we are as committed to fostering lively, intellectual debate as we are to spreading the word of science far and wide. The problem is when trolls and spambots overwhelm the former, diminishing our ability to do the latter.”
Actions speak louder than words.
Of the two posts used to justify the silencing, the first was about climate, and had all of 16 comments — two of which were spam (see Ninna and Lili) — the rest mostly skeptical, and one used crass language. The other post was about abortion (90 comments) — yes, killing the unborn is going to generate debate. Is that it?
The real problem here is their mission statement (as contained in the quote above) is profoundly unscientific. A scientist’s job is not to “spread the word of ‘science’ “, it’s to find the truth. A science communicator’s job is not to spread the word either. Because there is no “word” to spread — there is only debate, argument and evidence in the endless quest to find the truth. The best science journalists interview the people with the most insight to share from both sides. They save their readers time, by putting the points that matter right in front of them.
Pop Science sure thinks it has dumb readers and points to research showing a few bad comments can fool them:
Keep reading →
8.9 out of 10 based on 110 ratings
It’s clear science journalists need some help. The IPCC are saying “The ocean ate my global warming” and most environment reporters just cut-n-paste this excuse — they fall for the breathtaking joules-to-the-22nd-figures — not realizing they convert to a mere 0.07C over nearly 50 years (as if we could measure the average temperature of the global oceans to a hundredth of a degree!). Worse, the warming we do find is so small, it supports the skeptical calculations, not the IPCC’s ones. I ran a tutorial for journalists at the end of the post, and asked Bob Tisdale (author of Climate Models Fail ) if he had some other questions. He did, oh boy, and here they are. Thanks to Bob. – Jo
—————————————————————————————————–
Joanne Nova asked me to suggest questions the media should be asking the IPCC about their 5th Assessment Report (AR5). I’ve provided a few examples along with background information.
This post will discuss the slowdown in global warming since 1998 (or the halt since 2001) known as the hiatus. While the hiatus in warming had been the topic of many blog posts around the blogosphere over the past few years, public awareness of the pause in surface temperature warming skyrocketed with David Rose’s 13 October 2012 Daily Mail article titled “Global warming stopped 16 years ago, reveals Met Office report quietly released… and here is the chart to prove it”.
————————————
1. Why did the IPCC simply glance over the well-known hiatus period in their Summary for Policymakers?
Background Information:
In their Summary for Policymakers of their 5th Assessment Report, the IPCC made only very brief references to the cessation of warming, coming to no conclusions about it.
In their approved Summary for Policymakers dated 27 September 2013, the IPCC states on page SPM-3:
In addition to robust multi-decadal warming, global mean surface temperature exhibits substantial decadal and interannual variability (see Figure SPM.1). Due to natural variability, trends based on short records are very sensitive to the beginning and end dates and do not in general reflect long-term climate trends. As one example, the rate of warming over the past 15 years (1998–2012; 0.05 [–0.05 to +0.15] °C per decade), which begins with a strong El Niño, is smaller than the rate calculated since 1951 (1951–2012; 0.12 [0.08 to 0.14] °C per decade)5. {2.4}
And on page SPM-13:
The observed reduction in surface warming trend over the period 1998–2012 as compared to the period 1951–2012, is due in roughly equal measure to a reduced trend in radiative forcing and a cooling contribution from internal variability, which includes a possible redistribution of heat within the ocean (medium confidence). The reduced trend in radiative forcing is primarily due to volcanic eruptions and the timing of the downward phase of the 11-year solar cycle. However, there is low confidence in quantifying the role of changes in radiative forcing in causing the reduced warming trend. There is medium confidence that internal decadal variability causes to a substantial degree the difference between observations and the simulations; the latter are not expected to reproduce the timing of internal variability. There may also be a contribution from forcing inadequacies and, in some models, an overestimate of the response to increasing greenhouse gas and other anthropogenic forcing (dominated by the effects of aerosols). {9.4, Box 9.2, 10.3, Box 10.2, 11.3}
The discussion by the IPCC includes the terms “low confidence” and “medium confidence”, indicating the IPCC hasn’t a clue about what caused the halt in warming.
————————————
2. In Figure SPM.1, the IPCC shows that hiatus periods can last for 3 to 6 decades. Why then is there no mention of that possibility in the future?
9 out of 10 based on 81 ratings
For years we’ve been warned via the media that there was a risk of irreversible global catastrophe. Is the IPCC stepping back from those forecasts too? The words abrupt, irreversible, and tipping point didn’t make it into the Headline Points in 2013.
Reader Katabasis at Bishop Hill reports on the Royal Society meeting where abrupt and irreversible changes were discussed. Katabasis notes that in the IPCC Chapter 12 Table 12.4 many of the catastrophic changes being forecast are described as “unlikely” or “very unlikely” or even “exceptionally unlikely”. The only one now considered “likely” is that the Arctic might be ice free 40 years from now (which is a big step back from “ice free by 2013” as some commentators predicted). Moreover confidence is low.
Will IPCC authors now correct Gore, Flannery, or other commentators when they tell us that CO2 emissions will probably lead to abrupt or irreversible ice sheet collapse, or collapses of the monsoonal circulation or Atlantic currents. Note the IPCC is saying “low confidence” for long term megadroughts, and monsoon changes, which means, “we don’t know” rather than “unlikely”. But why spend billions to prevent something you have low confidence will happen?
 Table 12.4: Components in the Earth system that have been proposed in the literature as potentially being susceptible to abrupt or irreversible change. Column 2 defines whether or not a potential change can be considered to be abrupt under the AR5 definition. Column 3 states whether or not the process is irreversible in the context of abrupt change, and also gives the typical recovery time scales. Column 4 provides an assessment, if possible, of the likelihood of occurrence of abrupt change in the 21st century for the respective components or phenomena within the Earth system, for the scenarios considered in this chapter. Source: AR5-Chapter 12. Table 12.4 page 78
Katabasis asked Matt Collins:
“What the IPCC says, and what the media says it says are poles apart. Your talk is a perfect example of this. Low likelihood and low confidence for almost every nightmare scenario. Yet this isn’t reflected at all in the media. Many people here have expressed concern at the influence of climate sceptics. Wouldn’t climate scientists’ time be better spent reining in those in the media producing irresponsible, hysterical, screaming headlines?”
Tumbleweed followed for several seconds. Then Matt said:
“Not my responsibility”.
Bishop Hill commenter matthu:
Is that Matthew Collins: Government employee? Joint Met Office Chair in Climate Change?
Is he saying that it is not his responsibility to correct widely held misconceptions about the likelihood of imminent abrupt and irreversible climate change as the result of carbon dioxide?
Keep reading →
8.7 out of 10 based on 61 ratings
And the public conversation finally starts to move on to discussing not whether the IPCC is wrong, but why it was wrong, and what we need to do about it. Credit to Judith Curry and the Financial Post. I’ve posted a few paragraphs here. The whole story is in the link at the top. – Jo
Judith A. Curry, Special to Financial Post
Kill the IPCC: After decades and billions spent, the climate body still fails to prove humans behind warming
 The IPCC is in a state of permanent paradigm paralysis. It is the problem, not the solution The IPCC is in a state of permanent paradigm paralysis. It is the problem, not the solution
The IPCC has given us a diagnosis of a planetary fever and a prescription for planet Earth. In this article, I provide a diagnosis and prescription for the IPCC: paradigm paralysis, caused by motivated reasoning, oversimplification, and consensus seeking; worsened and made permanent by a vicious positive feedback effect at the climate science-policy interface.
In its latest report released Friday, after several decades and expenditures in the bazillions, the IPCC still has not provided a convincing argument for how much warming in the 20th century has been caused by humans.
We tried a simple solution for a wicked problem:
We have wrongly defined the problem of climate change, relying on strategies that worked previously with ozone, sulphur emissions and nuclear bombs. While these issues may share some superficial similarities with the climate change problems, they are “tame” problems (complicated, but with defined and achievable end-states), whereas climate change is “wicked” (comprising open, complex and imperfectly understood systems). For wicked problems, effective policy requires profound integration of technical knowledge with understanding of social and natural systems. In a wicked problem, there is no end to causal chains in interacting open systems, and every wicked problem can be considered as a symptom of another problem; if we attempt to simplify the problem, we risk becoming prisoners of our own assumptions.
Keep reading →
8.7 out of 10 based on 129 ratings
Have you or your children challenged a teacher about something scientific? Were you treated fairly? Are you a teacher – if so, what are your thoughts on the new curriculum?
I would like to find out more about what is happening in our schools. I’m considering the new National Australian Curriculum, but comments related to the old curriculum and non-Australian curriculums are useful too. What kind of culture do our schools create. I would most appreciate both personal stories (privacy ensured) and comments about curriculum and educational matters. If you can’t write in comments, please email joanne AT this domain.
This link is probably the best for people who want to fossick : Australian Curriculum
Keep reading →
7.7 out of 10 based on 50 ratings
In answer to the excuse du jour: “The Ocean ate my Global Warming”.
Now that the plateau in air temperatures has lasted for 15 years, everyone, even IPCC lead authors, can see the “90% certain” models were 98% wrong. So the IPCC now claims the heat went into the deep abyss, which they didn’t predict, can’t measure accurately, and, even by the best estimates we have, has not been anywhere near large enough to explain the missing energy.
They predicted the surface air temperature would increase, but it didn’t. (The 1990 IPCC predictions about temperatures were so wrong the trends have come in below their lowest possible estimate.) They predicted the oceans would warm more than twice as much as they actually have (as best as we can tell). They did not predict the air temperature would level out for 15 years, and the oceans would suddenly start producing “natural cooling”.
The oceans are a bit of a mystery black box
There are 1.4 billion cubic kilometers of ocean out there — it’s so big it hid a 650 km volcano until two weeks ago. Only two people have been to the bottom ever (correction, three men), and they stayed just 20 minutes (and all they saw was silt). Despite this the IPCC wants us to believe we can measure the entire Earth’s ocean temperature in one hundreth’s of a degree, not just now, but allegedly also 50 or 60 years ago. There is no 95% certainty about ocean measurements in 1962 or even in 2002. Strangely, the best models in the world did not predict this in 2007. The IPCC are handwaving at the ocean heat so they can still say “the world is warming” but in reality the numbers are devastating, and the data (as scratchy as it is) supports the skeptics. If the standstill in temperatures is bad news for the IPCC, so are the ocean heat figures.
The excuse that the missing heat went into the ocean is a deceptive reframing — where a failure in ocean measurements is used to save them from their failure to predict what happened above the water. It is as simplistic as saying the warming line points up, and “up” is success.
 Who switched on natural variability in 1998? …
Ocean Heat Content does not help the IPCC
1.If the oceans affected global temperatures after 1998, what were they doing before that?
If the oceans caused natural cooling over the last 15 years, how do we know they didn’t cause natural warming over the 20 years before that? The answer is, if La Nina’s can cool the surface, El Nino’s can warm it. If oceans can draw heat out of the sky, then in times when they are not doing that, they can also increase the trends.
Caught again, the IPCC hides this banal symmetry. Their self-serving lop-sided rule is: if it cools, it’s natural; if it warms, it’s artificial. The killer contradiction goes unspoken. If the warming from 1979 -1999 was significantly caused by natural changes in currents, clouds or wind which allowed heat to build up in the air, it means they underestimated the natural effect of the oceans and overestimated the effect of CO2 during the warming. When CO2 levels reached their “highest” levels in human history after 1998, the oceans overrode whatever effect CO2 had. The IPCC knows so little about the ocean, that they didn’t even allow for this possibility in their past predictions. Why should we let them get away with the banal post hoc hand-waving excuse?
This is a point so simple any science journalist ought to spot it immediately. Have any of them asked?
2. The oceans are supposedly 0.06 C warmer than 50 years ago (but we can’t really measure the global ocean temperature to a hundreth of a degree).
The first point of deception is that temperature is measured in degrees, but the Climate-change Industry always report ocean temperatures in Joules. This hides the obvious problem — we just can’t measure the global ocean temperature that accurately.
Before 2003 there is only sparse irregular measurements with everything from buckets off boats to thermometers fired into the water and usually without pressure sensors (we estimated how deep they were from how long they’d been falling…not much room for precision there). Much of the ocean wasn’t covered, and there were almost no readings below 700m (the average depth of oceans is 4km).
We’ve only had decent measurements of the ocean since mid-2003 when the ARGO system started. But even these measurements are considerably less certain than often claimed, and they didn’t find the missing energy anyway (see point 4).
3. The utterly banal again: All forms of warming cause ocean heat to rise.
Ocean warming (like most other indicators) doesn’t prove anything about the cause. If the warming since 1700 was due to solar magnetic effects, or lunar effects, cosmic rays and changes in cloud cover, the oceans would warm. The only point that matters is whether the models have verifiable predictive skill of any kind. They don’t: Ergo the theory is wrong.
4. The missing energy is just not enough. The numbers Jim, look at the numbers!
ARGO data started in 2003, but the observed ocean warming does not fit the model predictions. (See this post for details.) The rate of increase is too small to demonstrate a large radiative imbalance.
But this also applies to the pre-ARGO data (as bad as it is). When we get down to hard numbers even professional experts in the Climate Change Industry find the “radiative imbalance” is only one third to one half of what the models and the theory of man-made global warming predict. They don’t necessarily say that in so many words, but the numbers do.
 Since sufficient ARGO data started in 2003, observed ocean warming does not fit the model predictions. See this post for details. | Updated, Sept 2013. The climate models estimate a CO2 additional forcing of 3.7 W/m2 with a doubling of CO2. (And since CO2 hasn’t doubled, then we’re looking for whatever part of 3.7W/m2 applies for the proportional increase in CO2 during the period in question. Hence that’s about 1W/m2 in the last 50 years, and less because 30% of the Earth is covered with land, not ocean).
David Stockwell has looked into the recent Levitis 2012 paper, which analyzed ocean heat from 1955-2010 and concluded that it supports the skeptics. Essentially, the models predicted 0.69W/m2, but Levitis found 0.3W/m2. Less than half. Once again, the data shows the models exaggerate by a factor of at least two.
Keep reading →
8.8 out of 10 based on 121 ratings
We could discuss that 95%-certain sermon from yon IPCC…
7 out of 10 based on 74 ratings
Michael Brown, recipient of taxpayer funds for astronomy, tells us that science is not about debate because people are not smart enough to judge the winner. He doesn’t list any evidence to support his faith in climate models (he’s just part of the herd following the consensus pack). Nor does he have any serious scientific criticism of the NIPCC climate report. But he uses plenty of names, baseless allusion, and innuendo. In the article “Adversaries, zombies and NIPCC climate pseudoscience” in The Conversation he resorts to a group smear (with the help of the taxpayer funded site) in the hope that people won’t listen to those who disagree with him. Apparently he can’t win a fair and open debate, so he’s doing what he can to stop one.
If science now has “Gods” who are above question, it’s not science, it’s a religion. A scientist who says “I’m right because I’m a scientist” is neither right nor much of a scientist. Brown is acting like a self-appointed High-Priest of the Climate Doctrine.
The NIPCC report is more balanced, more comprehensive, and more accurate than the politically-guided tome from the IPCC . It contains hundreds of peer reviewed references put together by independent scientists. In his reply to it, Michael Brown tells us all we need to know about the intellectual state of Australian science, and the value of The Conversation.
This is the face of the Church of Global Warming. (Yes, the “academic” site actually used this photo below — is there any better evidence that it’s not about science, but about propaganda?).
“Adversaries, zombies and NIPCC climate pseudoscience”
 Dead science lives on, thanks to the Non-governmental International Panel on Climate Change Michael Brown and The Conversation. |Photo: Scott Beale How low can Brown go?
How about “zombies”, “aliens”, and “pseudoscience”? As an unskeptical scientist (and we all know what that means), it appears Brown hopes to win through name-calling and “seeding doubt” about the motivations of people he disagrees with. Skeptical scientists are “skeptics” (always in quotes to imply they’re fakes) who are “bankrolled” (he’s blind to the evidence about the financial truth too).
For evidence Brown cites a consensus study that mixes up 0.3% with 97%. He likes the IPCC political-consensus approach. This is post-modern science (or post-science, science) forget radiosondes, just poll government appointees.
All the other evidence Brown lists is superficial and irrelevant. He claims: “there is remarkably good agreement between models of climate change and the temperature data.” Then offers as evidence the utterly banal and correct predictions of the “last 50 years” while ignoring the devastating failure in the predictions of the last 20 years that matter.
Modern science is broken — Astronomy in Australia is a small community and illogical, unscientific people have already been promoted to influential positions. I could ask where the decent astronomers are, and why aren’t they protesting, but because Brown’s activism is so strong, so unscientific, and unequivocal, I expect those who disagree with him would choose to stay silent. They wouldn’t know whether their next grant will be reviewed by him, but they know that if it is, and they are a vocal skeptic, it won’t help them. After a rant like this, why would anyone expect equal treatment?
This Heisenberg-like state of uncertainty (will or will he not be a reviewer for my application/proposal/paper? and will or will he not be biased if he thinks I am a zombie/denier/anti-science?) is enough to bring people in line. Welcome to the stifling blanket of self censorship.
Ode to the stupid
According to Brown, those who question the mantra of the IPCC are not just speaking their mind, they are using a pseudoscience “ploy” to fool the people (who are too dumb to realize). These evil mercenary skeptics want you to think we need to debate complex, costly plans that are dependent on our knowledge of the weather. (Imagine that!) Luckily for us, Brown is here to correct the dumb engineers, doctors, and lawyers who are unconvinced a solar panel in Melbourne will help stop a flood in Bangladesh.
The call for adversarial debate is a variant of the debate ploy, a common pseudoscience tactic. At first glance having two teams present competing positions seems entirely reasonable, but this approach only works if the intended audience can effectively assess the arguments presented.
Who is the pseudoscientist using a ploy to fool the public? The geologist who tells us that this warming is not unusual, or the man who has no evidence, and a profoundly unscientific and patronizing belief that only the anointed can speak their mind?
How’s this for reasoning: According to Brown, adversarial debate failed once with Einstein’s theory of relativity (the audience were not able to get the right answer in 1920 on one of the most difficult and ground breaking scientific advances in centuries). Cue the High-Priest, therefore and verily says he, adversarial debate is always a waste of time and science can only advance if the populace lets politicians annoint Gods in each subject (and everyone bows to them).
Keep reading →
8.9 out of 10 based on 138 ratings
A paper that is nearly 60 years old shows us just how intrinsically important CO2 is to life.
An acre of corn is a living machine drawing CO2 from the air around it. In windless conditions, CO2 concentrations over a cornfield build up each night as CO2 diffuses from higher air and the organic matter and bacteria create CO2 from the soil. A paper by Chapman et al from 1954[1], shows that as soon as the sun comes up, to power-up those dormant photosynthetic cells, the plants rapidly draw down as much CO2 as possible, and when the CO2 levels fall too low, plant growth surely slows.
On a windless day CO2 values rose to 410ppm overnight and fell to 210ppm during the morning.
This graph shows CO2 content of the air over a cornfield on a still day (no wind). Sunrise occurs at 5am and CO2 levels plummet til 8am, reaching their lowest by 1pm, which is nearly half the CO2 concentration of the peak reached overnight. The corn is affecting CO2 levels in air even as high as 150m or 500ft above. These level out by around 8am and only start to increase again, a couple of hours after sunset.
No wonder some farmers use greenhouses and pump in CO2 to boost their yields. The afternoon sun goes a-wasted as plants growth slows because CO2 levels are not high enough.
The message to gardeners is that this is why plants that get morning sun have an advantage.
 Fig. 1. Variations in the C02 content of air in a corn field and 152 m above it on a still day. A C02 deficit of more than 100 lbs an acre was developed within 3 hrs after sunrise, to remain nearly constant until late afternoon. Chapman point out that there is 40,000 lbs of CO2 normally present in the air over each acre.
This graph shows that on a windier day the effect is muted because CO2 is being brought in by the wind from areas around the field. CO2 falls ’til about 12 noon before leveling off as plant growth slows. Again, even air 150m above the field shows the effects of the plants underneath.
Keep reading →
9.1 out of 10 based on 97 ratings

Admire the power of the Internet. Since I started blogging we’ve had 9,999,619 pageviews. Minutes to go…
UPDATE #1: 10,000,075 pageviews. Thank you.
UPDATE #2: Extra special thanks to the volunteer moderators who work anonymously to keep things on track, who deal with the malcontents, complaints, and unpublishable bile and my evolving strategies. They made the 10 million pageviews possible and the 180,850 comments. They are spread over three countries and every timezone, and have been helping for 2 – 4 years each. They are a source of wisdom and advice. I would not be able to do this without their help.
Statistics show 1.67 million unique visitors from 225 countries have come to the site. From the extraordinary comments on Monday’s thread many readers are highly qualified in Engineering, Geology, Physics, Law, Medicine, Accounting, Architecture, Agriculture, Chemistry, Ecology and Education. From personal contact I know readers also include three national cartoonists, several members of the Australian and British Parliaments, State MPs, staffers to elected representatives, IPCC lead authors, journalists and at least six well known columnists. Readers include a professional full time carbon trader and several major investors, at least one of which I know has made quite a lot of money shorting renewables in Europe. I feel honored. humbled and grateful. Thanks to all who have supported me this year, to make this work possible. I still owe many of you a personal email.
There is a smart class of movers and shakers who influence events and markets. Even though the mainstream press may relentlessly report only one side, the other side of the message is getting out — may the best arguments win.
Keep reading →
9.3 out of 10 based on 126 ratings
 “What data? ” David Suzuki on Q&A David Suzuki’s performance on Q&A last night was extraordinary. I was knock-me-over amazed that he has not heard of UAH, GISS, HADcrut and RSS, and knew nothing of the pause in global surface temperatures that even the UK Met Office and IPCC lead author climate scientists like Hans von Storch are discussing.
How afraid is Suzuki about man-made global warming? So afraid, it doesn’t occur to him to check the data, incredibly he doesn’t even know what the data is. Tony Jones had to rephrase the questions to explain them to Suzuki, who doesn’t even understand them.
How much is his reputation as a scientist worth when he doesn’t even bother to check the evidence for a cause he stakes his reputation on?
Three times in Q&A he admitted he didn’t know — he didn’t know there was a pause in warming for the last 15 years, he didn’t know how global temperatures are measured, and he didn’t know that cyclones were not increasing over the Great Barrier Reef. He wants politicians jailed for “denying the science”. “You bet!” he exclaims, but then admits he hasn’t thought that through either.
The cartoon-like responses were incongruous. Should we go nuclear to reduce emissions? Suzuki tosses numbers, evidence, and cost-benefits down a deep well of ignorance: “It’s just crazy”. “What the hell is going on”. “You’ve got sunlight!” “Solar farms could be spread everywhere”. “There is plenty of sunlight beyond anything humanity needs”. The audience member who asked then pointed out we don’t have the batteries to cope with sunless cloudy days. Even Tony Jones asks how realistic solar is. At this first prod, Suzuki throws his hands up in the air, “I don’t know”.
Keep reading →
8.6 out of 10 based on 220 ratings
If you are fed up with dismal papers passing peer review and exploiting the good name of science, join us in protest. Christopher Monckton was not content to let John Cook and others get away with a paper where 0.3% becomes 97%, so Monckton is formally asking the journal to retract it — suggesting it would be wise to protect the journal from any allegation of scientific misrepresentation. Here is his entertaining background on events, and below that, a very serious letter 273 scientists and citizens have already signed to jointly send to the Editor Daniel Kammen. If deceptive wording and hidden data make you angry, join us by commenting below or emailing. — Jo
————————————————–
Honey, I shrunk the consensus
By Christopher Monckton of Brenchley
Michael Crichton said: “If it’s consensus, it isn’t science. If it’s science, it isn’t consensus.” Thales of Miletus, Abu Ali Ibn al Haytham, Newton, Einstein, Popper and Feynman thought much the same and said so. Science by head-count is mere politics.
Doran and Zimmerman (2009) and Anderegg et al. (2010) each concluded that 97% of a few dozen carefully-filtered climate scientists held Man guilty of some of the 0.7 Cº global warming since 1950.
Cook et al. (2013), in a recent me-too article in Environment Research Letters, conducted the largest-ever sensational epic blockbuster cast-of-thousands drama survey of scientific papers on climate change. They concluded that 97.1% of abstracts expressing an opinion on climate change endorsed the “scientific consensus”.
Here’s how they did it.
They examined 11,944 abstracts. But they arbitrarily threw out almost 8000 of them on the ground that they had not toed the Party Line by expressing the politically-correct opinion (or any opinion) on climate change.
Next, they ingeniously interchanged three separate versions of the imagined “scientific consensus”: that Man had caused some warming; that Man had caused most of the warming since 1950; and that man-made warming would be catastrophic unless the West were shut down and climate sceptics were put on trial – as the appalling James Hansen has suggested – for high crimes against humanity.
It was this last definition – in fact untested in Cook et al. or, as far as I know, in any other paper – that Mr Obama’s Twitteratus plumped for when he tweeted that 97% of scientists consider climate change not only real but “dangerous”.
The introduction to the Cook paper said that the survey was intended to examine the standard or IPCC “scientific consensus” that most of the warmer weather since 1950 was our fault.
The authors, having consigned 7930 abstracts to the Memory Hole because they had not parroted the Party Line, were left with 4014 abstracts. They marked just 64 of them, or 1.6% of the 4014 abstracts, as endorsing the standard version of “scientific consensus”.
Further examination by Legates et al. (2013) showed that only 41 of the 64 abstracts, or 1.0% of the 4014 abstracts expressing an opinion on the Party Line, or just 0.3% of the original 11,944 abstracts, had said Yes to the standard version of consensus.
The incredible shrinking consensus
 (A) Cook et al. claimed 97.1% consensus among 4014 abstracts; but (B) that was only 32.6% of all 11,944 abstracts in their sample; and (C) only 1% of the 4014 papers or (D) 0.3% of the entire 11,944 sample actually said Yes to the “scientific consensus” as Cook et al. had defined it. However, since 32.6% of all 11,944 abstracts, or 97.1% of the 4010 abstracts expressing an opinion on the Party Line, had said or implied that Man causes some warming, Cook et al. concluded by saying that 97.1% of all abstracts expressing an opinion had said that Man had caused most of the warming since 1950.
The totalitarian news media (that is just about all of them), ever careless with their logical quantifiers, dutifully reported that 97.1% of all scientists had stated their support for the “scientific consensus” that all global warming since 1950 was manmade.
The website of the Institute of Physics reported one of Cook’s co-authors as saying that the paper had indeed concluded that there was 97.1% support for that notion.
However, in my submission it is time for sceptics not merely to express dismay at the flagrant distortion of the objective truth that has occurred. I reported that co-author to his university for misconduct in the dissemination of research results, and the university has told me it has decided to investigate.
The Institute of Physics, to whom I also complained, says it does not propose to alter its story because, it says, the co-author’s statement accurately reflects the paper’s conclusion. I have sent it the authors’ own data-file and have asked it to check that the authors themselves had marked only 64 out of 11,944 papers as endorsing the version of “scientific consensus” for which the paper claims 97.1% consensus.
I have asked that the Institute should at least report that the result of the paper has been credibly challenged in the peer-reviewed literature; and I await its reply.
A report of research misconduct has gone to the Vice-Chancellor of Queensland University and to the Professor who is the “designated person” to investigate the lead author under the University’s research policies. I await a reply from either of them.
This is where you come in, gentle readers. For I have written a letter to the editor of Environmental Research Letters asking him to withdraw the paper on the ground that it is not merely defective but deceptive. The letter is below.
I should be very grateful if every reader who agrees with me that the paper should be withdrawn would send a message to this thread giving their names and, if they wish, their academic qualifications. I shall then add the names to the letter and send it to the editor. Jo Nova herself is a signatory. Please join us.
Keep reading →
8.9 out of 10 based on 157 ratings
Agnotology is the study of how ignorance grows through repetition of misleading misinformation. You might never have heard of it, but it’s the perfect term for the climate science “debate”. Predictably its use began when those convinced of man-man global warming claimed fossil fuel groups were funding misinformation. But as per usual, unskeptical scientists opened a promising new front only to got burned by the evidence.
In the latest volley, from Legates et al 2013, John Cook’s “97% consensus” survey has become the case study in agnotology. Based on incorrect results, a flawed method, and a logical fallacy, it kept key facts hidden while sloppily blending vague language into a form that is easily and actively misinterpreted. That it passed peer-review is another damning indictment of peer review.
Cook still refuses to provide about half the data, but the data that has been made public shows (after some digging) that a mere 41 papers out of 12,000 was called a 97% consensus. The trick is that Cook et al interchangeably use different definitions of consensus.
The Bait and Switch
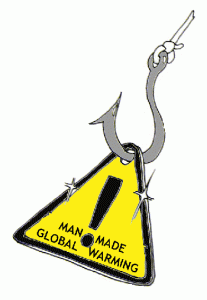
The Bait: In the introduction Cook states that the reason for the paper is “to determine the level of scientific consensus that human activity is very likely causing most of the current GW [global warming]”.
The word “most” leaves no doubt that it refers to man-made forces causing “more than half”.
Cook categorizes endorsement of anthropogenic global warming into seven categories, only the first of which fits the aim stated in the introduction.
- Category 1: “Explicitly states that humans are the primary cause of global warming”
- Category 2: “Explicit endorsement without quantification” — (which, if they studied other forms of publication, would include myself and most skeptics. Yes, CO2 is a greenhouse gas, it does cause some warming, and human emissions are increasing. Thus the category includes everyone from dedicated skeptic to confirmed believer. “Some” warming could mean 1% or 100%.)
- Category 3: “Implicit endorsement” — (meaning researchers involved in carbon sequestration, or wombat territories, or early peach ripening, or anything that might be affected by the climate.)
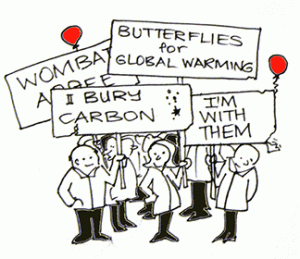 The switch: Cook doesn’t provide results for Category one in the paper, even though that was the aim of the paper. To “simplify the analysis”, he blends together categories 1, 2 and 3 (which include two very different definitions of consensus). In the data there are only 64 papers of Type 1 — papers that state that humans are the primary cause. (Is that why he did not report the result?) Worse, Monckton read the abstracts and found that 23 of those are misallocated. The switch: Cook doesn’t provide results for Category one in the paper, even though that was the aim of the paper. To “simplify the analysis”, he blends together categories 1, 2 and 3 (which include two very different definitions of consensus). In the data there are only 64 papers of Type 1 — papers that state that humans are the primary cause. (Is that why he did not report the result?) Worse, Monckton read the abstracts and found that 23 of those are misallocated.
Did Cook really think he could get away with taking 41 papers out of 11,944 and claiming it was a “97% consensus”? Most of the thousands of papers included in his “97%” collection are merely me-too papers where the scientists have assumed the models are right and someone else has done the sums.
This statement in the abstract of Cook et al is so vague as to be useless.
Among abstracts expressing a position on AGW, 97.1% endorsed the consensus position that humans are causing global warming.
The statement refers to the broadest and weakest form of consensus, but is often mistakenly amplified to infer it causes “dangerous” global warming. By Cook’s own definition a mere 0.3% of papers actually show that “humans are the primary cause of recent global warming”. Furthermore, being the primary cause does not necessarily mean the warming is also dangerous. The paper was not even designed to find out how many scientists endorsed dangerous warming. Yet in the media this is how the paper is being used. Tellingly, Cook has made no attempt to correct this misuse.
Note the strong terms of reference of the Legates paper — this is not about accidental misinformation, but intentional deception:
“…the focus will be on misinformation said to have arisen not through inadvertence, nor through any limitation in the state of knowledge, nor through any defect in teaching or learning, but through the self interested determination of some sufficiently influential faction to circulate misinformation calculated to sow doubt, to conceal a truth, or to promote falsehoods.”
The nub of the problem here is that this poorly done research is not contributing to human knowledge, but to the exact opposite. Cook uses a poor study of opinions to replace the empirical evidence he ought to have. And Bedford and Cook use agnotology as a method to shut down open debate about it.
Legates et al:
“Totalitarian regimes spread misinformation while demonizing their opposition. How is
it different here? Haud secus isti. If it is as Michael Oppenheimer argued earlier—though
the figure is wrong, the discussion is useful because it agrees with the consensus—then
misinformation is being used as information to support the consensus. In that instance,
agnotology takes on an added connotation—it includes the study of how misinformation is
spread as information by those espousing a contrived consensus to support one’s cause.”
Keep reading →
8.9 out of 10 based on 98 ratings
 Tim Flannery. Photo: Alex Ellinghausen Dear Tim,
Now that the government funded golden platform is gone, you say you will “not be silenced. ” Bravo, I say.
Perhaps I can help? When I didn’t want to be silenced five years ago, I set up my own blog. I got no government grants. Any financial support comes from readers voluntarily (thanks to Peter, Bill, Bernd, and Malcolm yesterday). I forgo a job to run this blog and get called a “denier” by government funded academics and politicians. Nevertheless, this is the largest skeptical climate science blog in the country, and one of the handful of largest in the world.
To help you until you get your own blog running in full, I extend an open invitation to you for a guest post anytime, unedited, and in full with graphs and images. Links to your own material will help your google rank.
You talked about the importance of scientific discussion, after the Climate Commission was abolished yesterday: “I believe that Australians have a right to know – a right to authoritative, independent and accurate information on climate change.”
Where better to post accurate information on climate change?
Keeping in the spirit of things, I’d insist commenters stick to scientific remarks, without ad hominems and personal insults.
On this blog you can reach the very people who are, as you might say, unconvinced about the extent of man-made global warming, and slowing down progress on climate action. Since the evidence is overwhelming, there must be plenty to write about. Convince us with what convinces you.
Keep reading →
9.1 out of 10 based on 223 ratings
|
JoNova A science presenter, writer, speaker & former TV host; author of The Skeptic's Handbook (over 200,000 copies distributed & available in 15 languages).

Jo appreciates your support to help her keep doing what she does. This blog is funded by donations. Thanks!


 Follow Jo's Tweets
 To report "lost" comments or defamatory and offensive remarks, email the moderators at: support.jonova AT proton.me
Statistics
The nerds have the numbers on precious metals investments on the ASX
|





Recent Comments