Recent Posts
-
Wednesday
-
Horse-drawn carriages must have caused a Megadrought in Europe in 1540, right?
-
Tuesday
-
Monday
-
Sunday
-
UK facing devastating 36 degree heat — can’t decide whether to use air conditioners or rip them out
-
Saturday
-
Batteries failed on day One: A four day wind drought in South Australia wreaks havoc, high prices
-
Friday
-
The UN wants to be One World Government and it starts with a carbon tax on ships and planes
-
Thursday
-
What if Global Warming was just because something made the clouds go away…
-
Wednesday
-
Snowy 2.0 is the Trillion dollar Black Hole of Australia — sucking in energy, money, land, industrial relations, the dollar, our lifestyle
-
Tuesday
-
Monday
-
Winter Solstice
-
Saturday
-
We were throwing-renewable-energy away at record levels in 2025
-
Friday
-
Pauline Hanson, the centrist, just wants a free market in electricity, and an end to the renewable energy bribery
-
Thursday
-
Blame the Climate Yeti again for making your life more expensive! (It’s a smokescreen)
-
Wednesday
-
The Sunrise Project funneled $343 million from overseas to push net zero
-
Tuesday
-
Monday
-
Sunday
-
The US government has been secretly funding 120 dangerous biolabs around the world
-
Saturday
-
New report shows renewables are a drag on our national productivity
-
Friday
-
Thursday
-
Well, how convenient. AI data centers have arrived to be the fall guy for the Energy Minister
-
Wednesday
-
Billionaires are leaving the room with excuses — Bezos says “AI will solve climate crisis”
-
Tuesday
-
Monday
-
Sunday
-
The Craziest eco laws against Farmers. Let’s check that science…
-
Saturday
-
China cooks the carbon accounting books by 400 million tons
-
Friday
-
The Wind Power Puzzle (add more wind turbines and get the same output)
-
Thursday
-
To save the world, Cement Australia stops burning coal and burns trees instead
-
Wednesday
-
On Fire! US hunger for gas power so large, wait time for turbines blows out to 5+ years
-
Tuesday
-
Monday
-
Sunday
-
Saturday
|
Electricity prices jumped in July. Now, retail sales are falling as wallets run out of money. When Greens, Labor, Conservatives said we need insurance, only skeptics pointed out the price.
Commonwealth Bank economist, Gareth Aird, calls the fall a “shocker”.
–Adam Creighton, The Australian
In a sign sluggish wages and higher power prices are starting to bite, the new financial year has seen the biggest fall in retail sales since 2009…
The Australian dollar fell back towards US78c yesterday after the Australian Bureau of Statistics revealed retail sales had fallen 0.6 per cent between July and August, defying economists’ expectations they would rise modestly.
“Households are facing several headwinds, including record low wage growth, record levels of debt, slowing house price growth, and, importantly, sharply higher energy bills,” said ANZ economist Jo Masters. The drop in retail sales by a cumulative 0.8 percentage points over the two months to August, the biggest two-month decline since 2009, comes as consumers receive their first round of power bills after prices went up more than 20 per cent since July.”
Who would have thought? The country is forced to spend more on green electrons to change the global weather, and that means people have less to spend elsewhere.
Cafe and restaurant owners were hit particularly hard. Survey’s show people “believe” in climate change, but don’t want to spend more money on it. But no surveys ask the questions that matter — How many restaurant meals will you give up in order to cool the world by 0.0001C? Will you give up your sales job to make hurricanes slower (maybe) in ninety years?
The Australian experiment continues.
h/t Dave B
9.5 out of 10 based on 102 ratings
The Greens are now asking for another $2.2billion to pay for the battery bandaid to fix a problem they and the leeching renewables industry created.
Adam Bandt is out today with the big new plan, apparently confused about what “load” means:
We don’t have a baseload problem, we have a peak load problem,” Mr Bandt said.
No matter how you look at this, it’s not a “load” problem. It’s an issue of supply.
We can count on the Greens to pour confusion on any problem:
“We need flexible generation and energy storage to manage the transition, not more coal.”
Four mistakes in one sentence. We have flexible generation – more than enough to cope with the current load curve. What we need is affordable electricity, which we used to have, and which coal supplies. What we don’t need is energy storage to manage an irrelevant transition that we never had to have in the first place. Let me say it again, electricity generators are for generating electricity, not for magical attempts to control the climate.
What Adam Bandt was trying to say:
“We The freeloading renewables industry needs flexible generation and energy storage to make up for its unreliable supply, to manage keep the frivolous and expensive transition to renewables from collapsing, not more coal.
Baseload scares the renewables industry and their lobbyists
It’s the great weakness of intermittent renewables. Solar and wind are in dire need of government funded batteries to stop their inefficient, unreliable, subsidy-dependent industry from evaporating. It’s only by paying more billions to “shift the load curve” that the normal load can be adapted to fit the new intermittent supply.
How much?
Such a system could deliver between 400 and 450-gigawatt hours of storage, which has the potential to power more than 100,000 homes for eight hours.
Or we could save $2b, get the government out of the electricity market, and let someone else spend $2b of their own money building an efficient coal plant that would supply more homes for fifty years at rates much cheaper.
h/t Dave B
9.7 out of 10 based on 130 ratings
Matt Ridley is about as gentlemanly, polite and sane a man as you’ve ever likely to meet — which is exactly why the mob are so afraid of letting him speak. Ridley even agrees that humans have caused most of the warming in the last fifty years (I shall have to talk to him about that). But this middle position is a potent threat. He’s walking the very ground that threatens the Green Blob — there are no subsidy trains in middle land. There’s no urgency, no gravy, and yet it’s so temptingly sensible, which is why the minions work hard to silence him. He can’t be ignored as “fringe”:
The National Review — Julie Kelly
“I’ve written about many controversial issues during my career,” Ridley said. “Never, have I ever experienced anything like what happens when you write about climate, which is a systematic and organized attempt to blacken your name rather than your arguments, and to try to pressure any outlet that publishes me into not publishing me any more.” A group of activists and scientists is urging the Times (U.K.) to stop publishing a regular column authored by Ridley because his views often challenge the climate tribe’s reigning dogma. Fortunately, none of this seems to have dampened Ridley’s good humor or self-effacing manner.
In a normal scientific debate, there would be a normal distribution of opinions — with most minds walking the middle ground where Matt is. It’s only tribal politics and rampant bullying that can keep opinions split in a U-shape distribution with most “players” either completely for or completely against an idea. And this is what Ridley is experiencing.
One of those groups must be wrong. Perhaps both. But the U-shape polarized opinion state takes a lot of effort to maintain. There is high-speed-spin, and buckets of money required to centrifuge the minds out of the middle.
Skeptics are not the ones fighting to silence voices.
h/t Climate Depot
9.8 out of 10 based on 114 ratings
With only a million dollars a day it’s hard for the BoM to keep up with their own stations. Luckily Bill Johnston has arrived to help out for free. The BoM announced that it was Canberra’s hottest ever day last week, but forgot to check whether the heat was due to the site moving three times, changes in thermometers and a wind profiler they installed themselves in 2010.
Normally the BoM would detect and correct for these sorts of things by using Homogenisation Magic (HM). That’s where they spot these effects by comparing a station with surrounding stations. However in this case HM missed all three site moves and the wind profiler. It looks like those might add up to 2.2°C of artificial warming. Nothing to worry about, but the hottest ever record will have to be shredded, and naturally, the BoM will need to issue a correction with at least as much fuss and coverage as the mistaken headlines. It’s only fair…
 After the effect of rainfall is removed there are at least three site moves, a screen change, equipment change, and alterations to the surrounding area that may influence the site. These step changes align with documented moves and account for most of the warming. Instead of using Homogenisation Magic, Johnston did things like getting site photos from national archives, and from google as well as using the BoM’s own data. He found out that most things have changed about the Canberra site since 1995. In 1995, not only did the thermometer shift to a new spot, the old liquid-in-glass style was converted to an electronic sensor (and we know they can be more sensitive and responsive to temperature changes). On top of that the screen around the thermometer shrank to about a quarter of its original volume (from 0.23m3 to 0.06m3). In the last ten years, large gravel or concrete pads were built near the sensor as well as a thingummygig called a wind profiler (which is a vertical radar array for detecting atmospheric turbulence).
Johnston uses a change in the relationship between temperature and rainfall to spot the site changes (then confirms them with documentation). If a site moves to a warmer or cooler spot the temperatures will shift up or down but the rainfall won’t. The relationship between rain and temperature will be broken — an effect that shows up during the following years of data. These changes in pattern often occur at the same time as a site change, and Johnston uses the shifting ratio’s to estimate how much effect the site change has.
Johnston has looked at a lot of sites around Australia, and estimates that many modern records wouldn’t be records at all if the BOM bothered to dig out historic photos, maps, and data and took more care to estimate the effect of site changes. The techno magical homogenization tool sounds fancy but allows site problems to be turned into misleading headlines.
— Jo
_____________________________________________________________
Welcome to Canberra airport where it’s always sometimes hotter
A sad day for meteorology but another marketing success story for Australia’s BoM.
Guest post by Dr. Bill Johnston[1]
Main points.
- Canberra’s record “hottest ever September day” is a great headline but not remotely real. The BoM forgot to mention thermometers were moved at least three times, each time to a warmer site.
- Homogenisation is a complete failure. Canberra temperature appears to follow model projections because homogenisation ignores site changes in 1973, 1997, 2004 and 2010.
Introduction
It’s not fair to expect meteorologists who don’t observe the weather to know much about their data.
However, its reasonable for people in Canberra gouged by ACTEW-AGL’s energy prices to expect Ashleigh Lange from the Bureau of Meteorology to have researched the BoM site at Canberra Airport so she knows what she is talking about when claiming “Canberra records its hottest ever September day” (Canberra Times, 23 September 2017).
It was cold as a toad three days before the record was allegedly “smashed”; people and businesses were forced to turn on the heat, which sent ACTEW-AGL laughing all the way to the bank. Which bank? The ones that won’t support low-cost coal-fired electricity generation of course.
Why is site history important?
Moving a Stevenson screen often results in a permanent change in background heat sources and sinks. For example buildings may shield prevailing winds; a site near a runway is likely warmed by tarmac not the weather. So for places like Canberra airport, where the site moved at least three times (See those details below) its important to know if temperature changes are due to site effects or the climate.
 Canberra Airport
| Figure 1. The original 1939 Canberra airport Aeradio site was near the hanger (S1) where the office was located. The site moved to S2, probably in 1973; then to an AWS south of the meteorological office at S3 (December 1995); then S4 in December 2008. |
|
|
|
Rainfall can be used to help analyze the effect of changes in the site and equipment
Evaporation cools the environment and there is a simple relationship between average Canberra maximum temperature (Tmax) and annual rainfall. Dry years are warm years, and the drier it is, the hotter it gets [Figure 2 (a)]). [It’s not the same for minimums where things are more complicated. A wet year can have slightly warmer nights. Clouds and humidity reduce heat loss by radiation so temperature is warmer in the early morning. (Exposure of the Stevenson screen to down-slope drainage of cool air is also important.) As foggy and cloudy winter days often don’t bring rain in Canberra, relationships between Tmin and rainfall are less clear-cut.]
The variation in Tmax can be split into the portion attributable to rainfall (the component described by the linear regression line [Figure 2 (a)]) and the residual variation, which is the portion not explained by rainfall. The relationship is robust if it is statistically significant and more than 50% of Tmax variation is accounted-for (R2adj, the coefficient of determination, is greater than 0.50). Although random in the rainfall-domain, Tmax-rainfall residuals may embed a hidden time-signal. As rainfall effects are removed the trajectory of residuals (rescaled by adding grand-mean Tmax) is unaffected by persistent weather effects and is analysed for step-changes using an independent statistical test [Figure 2 (b)].
Residual step-changes show that either the S1-site changed in 1973 (due to works nearby, for example) and it moved to S2 later (about 1975); or the move in the ACORN-SAT catalogue is miss-specified. Many things changed in 1995 [the site moved to S3, an AWS replaced thermometers, and it is likely that a small Stevenson screen (0.06m3) replaced a previous large one (0.23m3)]. In 2005, a vertical radar array for detecting atmospheric turbulence (wind profiler) was installed on a 350 m2 gravel or concrete pad 30 m north of the screen and a bitumen car-park replaced a former playing field 25 m east (Figure 3). However, the site didn’t move to S4 until December 2008, afterwards, in 2010, the wind-profiler relocated 40 m north of the S4 screen.
 Figure 2. Tmax depends on rainfall (a); however, due to embedded site changes, variation explained (R2adj) is only 0.36 or 36%. As the naïve regression (Tmax = 21.91 – 0.34oC/100 mm) accounts for rainfall; rescaled residual variation (b) is due to non-rainfall factors including site and observer inconsistencies data in-filling etc.; and site changes and relocations. (Out-of-range outliers (o/r; red squares) are excluded from analysis.) Segments defined by step-changes are analysed separately in (c). Except for 2005 to 2016, relationships are significant. Differences in R2adj reflect both the number of cases and closeness of data to respective regression lines and are not comparable. Dotted lines indicate median rainfall (vertical) and overall average Tmax (horizontal), which provides a visual reference. (A P value of 0.10 is not statistically significant.)
Factored on step-changes, simultaneous analysis[3] shows regressions [individually free-fit in Figure 2 (c)] are parallel; rainfall reduces Tmax 0.33°C/100 mm and 78.8% of Tmax variation is explained (vs. 36% for rainfall alone). Moving the site beside the runways in 1972; then to the AWS and small screen in the vicinity of the new met-office in 1995; then installation of the 2005 wind-profiler array; sealing the car-park; then in December 2008 moving 400 m south along the eastern airport boundary, where a wind-profiler array was installed in 2010 caused data to warm 1.75°C[4] (0.43°C + 0.76°C + 0.56°C [Figure 2 (b)]). With those changes and rainfall accounted-for no Tmax trend remains that is indicative of changes in the climate.
The history of Canberra airport’s moving weather station
Temperature measurements started at Canberra airport in 1939 when Aeradio was set-up to monitor aircraft and advise pilots of inclement weather. In those days planes flew through turbulence not above it like jets do and Aerado ensued aviation safety. Plans at the National Archives of Australia show the Aerado and meteorological offices were in the northwest corner of the original hanger, still standing at RAAF (Royal Australian Air Force) Fairbairn. In June 1940 weather observers and radio operators were conscripted to the RAAF and after WWII, in July 1946, air traffic control merged with the Department of Civil Aviation and Weather Bureau staff transferred to Department of the Interior. As technology changed and demand for services increased facilities across Australia were up-graded in the 1950s. Radar was introduced to monitor aerosonde balloons; the busy met-office in the hanger at Canberra airport was provided with forced ventilation in 1954.
The National Library of Australia holds aerial photographs from 1956 and 1960 that show a meteorological enclosure between the north-south runway and the hanger (at about Latitude ‑35.3049, Longitude 149.2014) (S1 in Figure 1). The 2012 ACORN-SAT[2] catalogue states vaguely that the “original site (070014) was on the eastern side of the airport”; and “there are indications … of a possible move in about 1975”. The Canberra Aero Comparison (70228) (December 1995 to 1997) site summary locates the second site (S2) in the centre of the airport near intersection of the N-S and E-W runways (Lat. -35.3083, Lon. 149.1936). The site moved 800 m northeast to an automatic weather station (AWS) in December 1995 (S3); then 400 m south in December 2008 (S4). Canberra Airport Comparison (70014) metadata doesn’t mention either of the two earlier sites so perhaps the Bureau doesn’t really know what happened.
Discussion and conclusions
Daily temperature fluctuates around average site temperature. For September, average S1 Tmax from 1939 to 1972 is 15.8°C; from 1973 to 1996 (S2) it is 16.0°C; from 1997 to 2004 (S3), 17.3°C and at the current S4 site it is 18.0°C. Due to site changes and moves which have nothing to do with the climate, average September Tmax has shifted-up by 2.2°C!
World’s worst-practice compounds multiple site and instrument changes. Although the 1973 S2 site operated in parallel with S3 until December 1997; reply to an FOI request confirmed that data for thermometers observed in parallel with the AWS until March 2010 at S3 (which would enable the change to the AWS/small screen to be cross-referenced using the same instrument) are not available. Internal Bureau policy directed that manually observed data were discarded without being databased and that paper records were destroyed. In the absence of comparative data statistical inference and interpretation of site factors (Figure 3) is the only evidence that the heat signature of the MO-site (S3) is different to the runway (S2) site.
 … |
|
 Canberra |
| Figure 3. Google Earth satellite images of the Stevenson screen (sc) and meteorological office (mo) at S3 beside a sports oval on 11 March 2004 (left); and with the wind profiler array (wp) and sealed car-park on 31 March 2008 (the site did not relocate until December 2008). |
|
Homogenisation makes no Tmax adjustment despite the weather station moving three times to situations whose background heat signatures are different; and changes such as to the AWS and small Stevenson screen in 1995, which is documented; and installation of wind profiler arrays in the vicinity in 2005. Bureau meteorologist Ashleigh Lange who claimed 30.2°C on Saturday 23 September “smashed a 52-year record” and was the “hottest ever September day” may not have visited the site, analysed any data and may not know that Tmax is affected by background warming independent of the climate. Even if it’s an above-average anomaly, inflated by site factors it is not a valid 52-year record.
Homogenisation provably does not improve site records. Choosing not to adjust for site and instrument changes in 1973, 1997, 2004 and 2010 causes Canberra data to warm like the models claim it should. Although Canberra airport data are not used directly to calculate Australia’s warming, Bureau meteorologists use the site to stir alarm about the climate.
Furthermore, airport data spread their faults far and wide: to ACORN-SAT sites at Bathurst Agricultural Research Station (63005), Dubbo airport AWS (65070), Moruya Pilot Station (69018) and Nowra RAN (68072). Data for those, adjust others, including Sydney Observatory, whose numerous faults find their way to Alice Springs (via. Tibooburra). Homogenisation of faulty ACORN-SAT site data using other data that are faulty is flawed. Instead of being recycled into yet another version, ACORN-SAT should simply be abandoned.
Bureau marketing of record-heat that doesn’t exist is the reason for the RET; the rivers-of-cash ACTEW-AGL takes from the Canberra community and the ACT Labor-Greens government’s hard left-turn to consumer-subsidised unreliable “renewables”.
Trends don’t exist; the cost is too high; people are hurting and losing their jobs. An open public inquiry into the Bureau of Meteorology and its dodgy homogenisation methods is long-overdue. In the meantime, the Bureau should cease making claims about record temperatures, which like at Canberra are provably false.
9.7 out of 10 based on 79 ratings
Managing the global climate is a tough thing. Sacrifices are required.
The last 100 years has been a success story of cleaner air in London. But air pollution is on the rise again. The fear of carbon is partly responsible for over a million people returning to burning “renewable wood” instead of clean gas and turning around a century long trend. Welcome to the “progressive” 21st century. Too bad about about the dusty lungs and razed trees.
As much as a third of small particle pollution is due to wood fires.
Wood-burning stoves are increasingly popular in middle-class homes and hotels, with 1.5 million across Britain and 200,000 sold annually. Old fireplaces have also been opened up in many houses and can cause greater pollution than stoves. Wood burning is most popular in the southeast, where it is done in 16 per cent of households compared with less than 5 per cent in northern England and Scotland.
Between a quarter and a third of all fine particle pollution in London comes from domestic wood burning. During a period of very high air pollution in January, it contributed half the toxic emissions in some areas of the city, King’s College London found.
It is alleged that air pollution causes “9,500 early deaths a year in London and 40,000 across Britain”.
h/t GWPF
9.7 out of 10 based on 93 ratings
…
9.1 out of 10 based on 27 ratings
 Coral which has produced eggs near Fitzroy Island. Photo AIMS, Neal Cantin. Optimism is rising among scientists that parts of the Great Barrier Reef that were severely bleached over the past two years are making a recovery.
Scientists from the Australian Institute of Marine Science this month surveyed 14 coral reefs between Cairns and Townsville to see how they fared after being bleached.
The institute’s Neil Cantin said they were surprised to find the coral had already started to reproduce.
Who would have thought that after 5,000 years of climate change, sea level change, temperature change and super-storms every 200 years — that the Great Barrier Reef would have something left up its sleeve?
Much of the ABC reporting on the Great Barrier Reef damage uses vague terms. If I was feeling cruel, I might call them “weasel words”:
Nearly two thirds of the Great Barrier Reef was affected by bleaching in 2016 and 2017, killing up to 50 per cent of coral in those parts.
So which parts are “those parts”? Did 50% of the corals die in two-thirds of the reef? Or has two thirds of the reef been affected by a small amount of bleaching while a much smaller number of reefs were hit by the apocalyptic 50% death-rate? There must be a better way to describe the damage. As it is, it is a number mush. (If only the ABC had a dedicated science unit they would be able to make sense of difficult concepts like this.) 😉
“What it means is the corals along the entire Great Barrier Reef, are survivors that are going to reproduce earlier than expected which could help drive quicker recovery if we don’t see another heat stress this summer,” he said.
“This is a positive news story for a change for the Great Barrier Reef. We’re seeing eggs and we hope those eggs will lead to somewhat of a successful spawning season this summer.”
When climate-sameness would be remarkable…
The Barrier Reef survived the Holocene peak for hundreds of years, so we might assume that the reef has ways to deal with hotter conditions and changing temperatures. Sea levels in Queensland were 1 – 2 meters higher 5,000 years ago. (Lewis 2012) Super cyclones have been hitting the coast of Queensland for the last 5,000 years and there is no sign that storms are getting worse. (see Nott 2001 and Hayne 2001.)
Corals have survived warmer periods and worse storms
Globally it was hotter 5,000 years ago, and sea levels were a lot higher in Queensland:
 Sea Levels have been falling for 4,000 years in Queensland during the Holocene. Lewis et al 2012. From a post in 2012 on 5000 year trends in storms in Australia:
Nott and Hayne studied a 5000 year history of super-cyclones along a 1500 km stretch of North East Australia and concluded that the big nasty ones hit roughly every 200-300 years in all parts of the coastline from 13° – 24°S.
 Fig 6: Progradation plot: normalized distances of each dated Storm Deposit from the oldest ridge crest versus the age difference between each storm deposit and the oldest ridge.
Hayne and Chappell (2001) looked at deposits left from storm surges on Curacoa Island (one of the Palm Islands of far north Queensland). They found that large cyclones have been hitting the coast at a statistically constant rate for 5000 years. This includes the earliest times when the sea surface temperature appear to have been about 1°C warmer (Gagan et al 1998). At Palm Island, sea levels were apparently 70cm higher back in that warm Holocene era (Chappell et al 1983). Somehow the Great Barrier Reef survived.
h/t Dave B. Pat.
Australia’s Great Barrier Reef,
At times may get bleached, but its brief,
And for eons survived,
More than bleaching and thrived,
Which must cause alarmists some grief.
–Ruairi
Keep reading →
9.7 out of 10 based on 84 ratings
 Maybe they’ll get one like this one? 😉 Circa 1934.* Green management of the South Australian grid scores another big success for the environment:
The Manns’ electricity costs have more than doubled in five years, from about $200,000 per annum to $500,000.
Due to the high prices, the family will this summer switch to diesel power to run their 116-stand rotary dairy and 14 irrigation centre pivots at Wye in the lower south east of South Australia.
The Manns are among Australia’s top 10 dairy producers, in terms of volume, milking up to 2300 cows and producing 19-21 million litres annually.
If only South Australia had more “cheap” solar and wind power, their electricity might be as low cost as the coal-fired Victorians:
Their move comes as South Australia’s dairy lobby has calculated the state’s dairy farmers paid about 40 per cent more for power than their Victorian neighbours last season.
The Mann’s are definitely going diesel this summer, but may set up a mixed solar-diesel-battery plan in the long run:
“Its embryonic, but information we have is saying we could get a payback within five years of (setting up a system on-farm) not connected to the grid, a combination of solar, diesel and batteries.
Imagine how expensive your electricity has to be for a small diesel generator to be cheaper than mass produced coal power? This could be the first time in 130 years that people connected to coal turbines switch off to use their own small fossil fueled generators because it’s cheaper.
Another world first for South Australia. And possibly a mark of the grid saturation point of intermittent renewables.
h/t Keith S
*Electric generator ( diesel engine and alternator ) installed in the underground worksite of the Coupole d’Helfaut in 1944. Photo Vassil
Keep reading →
9.6 out of 10 based on 99 ratings
File this under Nasty Nature. This is the sort of thing planet Earth throws at life.
The is real “sea level rise” — where most of a continent (called Zealandia) sinks under the waves — and — as far as we know, though I could be wrong — fossil fuel use was minimal circa 50 -80 million years ago. Can Exxon be blamed?
New Zealanders may be feeling a bit cheesed that they carelessly lost something like 80% of their land. (Call that “Old Zealand” which was once as big as India.) Given that it is one kilometer underwater, it looks like it isn’t coming back soon. But think of all the national parks, reefs, etc that were destroyed?
 Zealandia. | Credit: IODP The story is that the Pacific Rim of Fire “buckled” 40-50 million years ago, and Zealandia sunk a lot deeper. There is a suggestion that it was originally submerged about 80 million years ago (or so), when this renegade land split from Australia and Antarctica.
Since 1,000 tide gauges estimate current sea level rise at around 1 mm a year, real climate change puts the current panic about sea levels into perspective. Even the next ice age, with a 125m sea level drop, is not going to uncover all this lost real-estate.
9.7 out of 10 based on 63 ratings
A fairly crappy investment in every sense — even as a “subsidy farmer”:
…renewable energy proponents say individual consumers like Mr Pulford could play an increasingly important role as citizen investors.
“I say it is a little bit gold plated,” Mr Pulford says of his $20,000 investment.
‘The new system was installed last month and he is already generating enough power to run all his home energy needs, charge his son’s hybrid SUV and sell excess back to the grid. “It ranges between $2 to about $1.90 a day for energy and that can be with the clothes dryers and bar heaters on.”
Mr Pulford said he expects to pay off the investment within 14 years.
He’s excited that his electricity bill is only $700 a year, after laying out twenty grand. After 14 years his “investment” will start to pay off, assuming the batteries are still running, the solar panels are clean, and the inverter didn’t need replacing. Those battery warranties, at best, are ten years. He might get lucky. Without subsidies, his “pay-back time” would be something like 30% longer.
In the ACT, 250 homes with Reposit technology are generating up to 1.2 megawatts, which is dwarfed by territory-wide consumption.
Reposit power gets a free advertisement from the ABC, but the ABC don’t mention that when it is forecast to be cloudy, the software Reposit uses is designed to charge the battery direct from the grid (and that will be mostly coal-fired). That way “solar users” get electricity at off peak prices and they can sell back the electricity at higher peak rates. This will help the grid deal with the intermittency of solar and wind, a problem the grid didn’t need to have.
The ACT has pledged to be 100% renewable by 2025. I say “bring it on” but they’ll only be 100% renewable when they cut the interconnectors.
Glorious solar subsidies
The ACT Government has released a third round of funding to accelerate solar battery storage and the $4 million includes subsidies for batteries with Reposit control boxes.
Mr Pulford agreed.
“We can’t continue to use fossil fuels for our energy because the future generation will pay the price,” he said.
It’s not the future generation who will pay, it’s people poorer than Mr Pulford who are already paying for the subsidy. He rationalizes his burden on the system with the superstitious belief that having solar panels on the roof will somehow make life nicer for future generations.
I’m sure he is a nice guy, but when it comes to accepting money from taxpayers, half the population is happy not-to-look-too-hard.
Isn’t it time we taught kids where taxpayer money comes from?
Solar subsidies for a 6kW system are round $3,500:
The lowest value STCs have held is $16, while their cap price is $40. Using the median price of $28 as a guide, the “rebate” you would receive for the 6.48 kW system described earlier is approximately 125 x 28 = $3500, which represents 30 to 40% of the price of a good quality system. Real-time STC market prices can be found online.
The subsidies were $1,000 bigger before July 20th 2017.
Choice Magazine looked at solar “payback times” and estimated it took 14 – 24 years.
h/t Dave B.
9.7 out of 10 based on 80 ratings
We are creatures of habit. Look at the spike caused at 11:32pm as something like 27,000 hot water tanks in South Australia suddenly switch on to use cheaper off-peak electricity. This spike is entirely due to pricing plans. It’s entirely avoidable too, but at least it’s predictable. “Scheduled”.
This peak, allegedly, is only a problem if SA is “islanded” — meaning if it can’t rely on the coal generators in Victoria.
Yesterday people were asking why the South Australian demand was peaking at 1am (and why two hours were strangely missing from that graph). “Hot water” is the answer (at least to the first part).
 SA Hot water systems add sudden 250MW of demand at 11:30pm. Graph. This graph comes from the AEMO report in Feb 2016. What follows is their electro-nitty-gritty:
Based on previous experience, and as demonstrated in a separation event on 1 November 2015, maintaining the SA power system in a secure operating state is challenging if there are large changes to the supply-demand balance during a period of islanding.
- There is a risk of automatic under frequency load shedding if SA is being operated as an island during the hot water demand peak, which occurs at 11:30 pm daily.
Hot water demand peak
Currently the most concerning of these challenges is the hot water demand peak that occurs at 11:30 pm daily. This is a step change increase in demand of approximately 250 MW, shown in Figure 3. This demand peak is controlled by fixed timers and requires considerable effort to reduce the peak through the adjustment of the time clocks at individual premises. While all new meters installed in SA will have randomised time clocks, all existing meters are set to switch at 11:30 pm.
Keep reading →
9.3 out of 10 based on 83 ratings
What other heavily subsidized industry brags about its ability to provide a product for one quarter of the time it’s needed? Vale sunny-day-solar!
Pick a day, an hour, and what are the chances solar will be there for you? A lot less than one in four, because last Monday’s peak in South Australia was an all time record. Every day in the last year was worse.
And so much for cheap… the price when solar power peaked was still close to $50/MWh. Compare that to most of the years of the national electricity market operating when average prices were $30/Mwh.
The price dip at 6am (the black-line bottomless gully), has nothing to do with solar, but was caused by wind power. Far from being useful, essential, or productive, solar and wind power are playing havoc with a normal market, destroying the chance for cheap, reliable energy to find a place. As long as we force the market to accept this non-dispatchable supply, we are actively punishing reliable power. What investor in reliable energy would look at this and head to South Australia?”
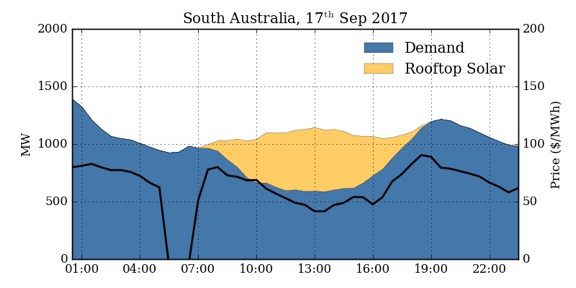
Giles Parkinson was excited at Reneweconomy: Rooftop solar provides 48% of South Australia power, pushing grid demand to a record low.
South Australia’s level of minimum demand hit a new record low this weekend – barely a week after the previous benchmark was set – with a fall to just 587MW on Sunday afternoon.
We can see what a wild spike this particular lunchtime peak was:
The record eclipsed the previous mark by nearly 200MW – with AEMO data showing minimum demand at 1.30pm of exactly 587.8MW, compared with the previous low mark of 786.42MW posted last Sunday. (See graph above courtesy of Melbourne’s Climate and Energy College).
That is a phenomenal share of 47.8 per cent of the state’s electricity demand being met by rooftop solar (compares with 36 per cent in the previous record last week) and is clearly a record for South Australia, and for that matter in any large grid anywhere in the world.
Parkinson seems to think a slight dip in exorbitantly high prices is a good thing?
The impact of rooftop solar is being felt in prices – look at the black line that shows prices fall as rooftop solar accounts for a sizeable share of demand during the day.
Yes, let’s look at the black-line price “dip” (but don’t compare it with the long term price for electricity when renewables were a smaller part of the grid.)
The South Australians are in deep:
South Australia is the first region where rooftop solar PV has caused a shift in minimum demand from night time to the middle of the day (most states still have electric hot water being switched on at night, when it would make sense to use the “solar sponge” as Queensland has suggested).
We could reprogram all the hot water heaters to automatically switch on in the middle of the day. Bravo. When it’s not so record-breaking-sunny (which is nearly every other day), we’ll a/ pay more for hot water, or b/ have cold showers? We could use the hot water tanks to store solar energy — but isn’t that what we make solar-hot-water-heaters for, and aren’t they more efficient at it? Why not heat the water direct instead of using PV cells to generate electricity, then use the electricity to heat the water? Is this the big advance Parkinson is excited about?
How “good” is a market price of minus $44?
Note, also, the negative price of minus $44/MWh at 6am when there was abundant wind and a constraint on the connector with Victoria.
The sign of a screwed market. Let me build a plant and pay you to take my electricity…. How does that work as a free market, nay, socialist plan — just fine. Would you like nationalized coal with that? The only company that can afford to run the cheapest generator in the market is one with shareholders who are forced to pay and never ask for a dividend.
It also questions the need for old fashioned concepts such as “baseload”, which would struggle to find a niche in a market dominated by wind and solar, where mostly “dispatchable” and flexible generation is needed to fill in the gaps. Wind energy is already producing more than 100 per cent of local demand at certain times.
Baseload is old fashioned in the same sense that cooking dinner at 6-9pm is. Ninety nine percent of Australia is still living the baseload dream.
PS: There are still subsidies for Solar Hot water systems in Australia, and according to wiki, even after the subsidy it takes nearly 7 years to “pay back” the solar hot water system even in the sunniest country on Earth. (See “costs”.)
9.8 out of 10 based on 91 ratings
…
9.8 out of 10 based on 32 ratings
Excellent news. Obviously we are getting to the BoM.
This week, Jen Marohasy and I were mentioned by Maurice Newman in The Australian.“Smoking Gun demands Grilling for the BoM”. In response, the Australian Bureau of Meteorology has unleashed a double dummy-popping effort in The Guardian.
The BoM could have answered the questions in The Australian, of course, but it’s so much easier to whine, bluster, raise the conspiracy flag and avoid the questions that matter at the-ask-no-hard-questions-Guardian.
Graham Readfearn
Michael Slezak
It really is an extraordinary rant as the former head of the BoM admits skeptics are “debilitating” the BoM with these “attacks”. The Guardian is so starved of real news, it runs the one-sided name-calling excuses and another separate story discusses it as if it was actually news. While The Australian asks the BoM for a reply and would publish it, The Guardian didn’t ask a skeptic. One of these newspapers acts like a newspaper…
How debilitating are we skeptics? Jennifer Marohasy tells me she sent the BoM questions in 2015, but hasn’t heard back yet. It doesn’t take much to debilitate the million-dollar-a-day agency. Ask a few questions and cripple them for years…
Obviously, the BoM have stopped trying to answer Marohasy, but now they also say they won’t answer our national masthead newspaper either. That’s another scandal to add to the list.
Maybe Rob Vertussy is still hurting from the time I said that Maurice Newman knew more about climate models than he did.
Vertessy spent a decade at Australia’s Bureau of Meteorology. He retired in April 2016 after five years as the agency’s director.
Over that time, Vertessy’s agency was under consistent attack from climate science denialists who would claim, often through the news and opinion pages of the Australian, that the weather bureau was deliberately manipulating its climate records to make recent warming seem worse than it really was.
When the Bureau makes mistakes, this is how it thanks the volunteers who want to improve the national data:
Vertessy said these sorts of attacks were dangerous. “From my perspective, people like this, running interference on the national weather agency, are unproductive and it’s actually dangerous,” Vertessy told me. “Every minute a BoM executive spends on this nonsense is a minute lost to managing risk and protecting the community. It is a real problem.”
It’s all a wicked conspiracy:
Now, the agency is under another wave of attack through the pages of the Rupert Murdoch-owned broadsheet, which is publishing claims made by Jennifer Marohasy, of the “free market” conservative thinktank the Institute of Public Affairs.
The recent spate of trouble for the BoM started when Lance Pidgeon and Jen Marohasy caught the BoM artificially clipping the coldest temperatures from Goulburn and Thredbo. The BoM then took weeks to do an internal review and finally answer that it was — through incredible coincidence — only these two stations, and it didn’t matter (even though it had been going on for years). The BoM admitted the hardware was clipping temps at minus 10.4, but still hasn’t explained why that was then altered to minus ten, which made the original “accidental” clipping problem worse. Maurice Newman not only mentioned this issue, but also discussed the far more serious matters of data being deliberately deleted and one-second-noise was being written into our record books. These are radioactive hot potatoes that the BoM won’t even touch:
Science writer and blogger Joanne Nova has raised scandal after scandal concerning the BOM’s record-keeping.
She refers to historic data being destroyed, and the influence of adjustments on Australia’s warming trend. She reports private auditors advising the bureau of almost a “thousand days where minimum temperatures were higher than the maxes”.
When Australia’s bureau transitioned from mercury thermometers to electronic sensors more than 20 years ago, to ensure readings from these devices were comparable with the old thermometers and complied with World Meteorological Organisation guidelines, parallel studies were undertaken at multiple sites….
A key conclusion was that readings from the new electronic sensors needed to be averaged over one to 10 minutes. However, rather than implement practices consistent with their finding, the bureau records one-second extremes (or noise), which can be announced as new record highs
Vertussy answers these criticisms of missing data, inexplicable adjustments, using sub-standard noise, and terrible quality-control with nothing but hand-waving bluster. Essentially: don’t be mean, how dare you ask! We’re Experts and you are lowly scum.
So when a shock jock or a thinktank employee claims the bureau is trying to cook the books, how should the public react?
What needs to be front of mind, Vertessy says, is that there is “virtually complete consensus on the extent to which the planet has warmed and why, since the beginning of the industrial revolution”.
“The facts are just unequivocal because they have been replicated so many times, by so many teams, using multiple independent methods.”
He says if the bureau “was really making a hash of managing its climate data” then it would be documented in scientific “journals and at symposia” but “that’s clearly not happening”.
He says it “beggars belief” that these commentators “actually profess to know better”.
Obviously, if he hadn’t deleted all the data he wouldn’t need to over-react.
Vertussy continues spinning wild claims and dodging the real questions:
“Time and time again there has been one independent review by experts after another, all telling the same story. The simple, unimpeachable facts are that the BoM is doing an exemplary job at managing the nation’s climate data and multiple independent reviews have confirmed that and we are recognised by our World Meteorological Organisation peers as being amongst the best in the world; that keeps being restated and restated.
“I think the Australian play on very dangerous ground here,” he says, adding that some editors at the newspaper were guilty of “perpetuating nonsense”.
The truth is the BOM will do anything they can to avoid any independent review. Vertussy only provides one example of a so-called independent review, but that one day wonder used hand-picked people who avoided looking at the points the skeptics raised. It wasn’t independent, and it isn’t relevant, and there are no better examples because there are no independent reviews. The Guardian swallows these fantasy answers 100%. What’s the difference between The Guardian and a PR agency? A PR guys are more honest. They don’t pretend to be journalists.
Graham Readfearn launches into full strawman agitprop:
The current non-story centres on two of the bureau’s 695 automatic weather stations (AWS). As temperatures reached -10.4C in Thredbo and Goulburn in July, a hardware card in the AWS stopped working. This event, detected by the bureau, kick-started several internal quality control processes.
The bureau found four other hardware cards in areas where things can get chilly and replaced them. The cards should not have been used, as they could become faulty at low temperatures.
That’s essentially it.
“No. That’s essentially lying by omission” says Jo Nova. The Guardian is hiding all the real problems from their readers.
Here come the conspiracy theories again:
But the Australian and the IPA and the network of climate science denial blogs have once again screamed scandal.
What network? Our secret networks are called “bigpond” and “gmail”.
Vertussy even resorts to vague threats:
“But, as the costs of climate change accumulate in the years ahead, I can see that leaders of this climate change denial movement will really be seen as culpable.”
Culpable indeed. As volunteer amateurs we are only guilty of asking questions the BoM doesn’t want to answer.
Graham Lloyd, and The Australian deserve great praise. If they didn’t ask the hard questions and report both sides of the story, who would?
UPDATE: See Jennifer Marohasy’s question for the BOM below from 2015 that they won’t reply too.
_____________________________________
THE BOM LIST grows — Scandal after scandal
- Scandal: Australian Bureau of Meteorology caught erasing cold temperatures
- On Sunday, Goulburn got colder than the BOM thought was possible (and a raw data record was “adjusted”).
- Two-thirds of Australias warming due to “adjustments” — according to 84 historic stations
- The mysterious BOM disinterest in hot historic Australian Stevenson screen temperatures
- The lost climate knowledge of Deacon 1952: hot dry summers from 1880-1910
- 1953 Headline: Melbourne’s weather is changing! Summers getting colder and wetter
- The mysterious lost hot Sunday in Bourke, did it really happen?
- Wow, look at those BOM adjustments – trends up by two degrees C!
- Australian BOM “neutral” adjustments increase minima trends up 50%
- Was the Hottest Day Ever in Australia not in a desert, but in far south Albany?!
- Hottest summer record in Australia? Not so, says UAH satellite data
- Mystery black-box method used to make *all new* Australian “hottest” ever records
- BOMs new data set, ACORN, so bad it should be withdrawn (954 min temps larger than the max!)
- Threat of ANAO Audit means Australia’s BOM throws out temperature set, starts again, gets same results
- Australian Temperatures in cities adjusted up by 70%!?
- NEW (this post) The BOM calls critics names, wails, and says it won’t answer questions from The Australian any longer.
9.5 out of 10 based on 114 ratings
An advert today describes the real climate change we should afraid of, discusses how past CO2 levels did not cause dangerous global warming, and extra CO2 has a smaller and smaller effect, then connects failed climate models with rising electricity bills.
 Click to enlarge. The text….
Keep reading →
9.3 out of 10 based on 155 ratings
Spot the political PR paper pretending to be science: the global carbon budget just got a whopping — four — times — bigger, but instructions on how to follow the carbon religion are 100% identical.
It’s become too obvious to everyone that the climate models have been complete failures. Thus, the global leeches were facing a crisis as their credibility and motivation drain. So the new paper in Nature Geoscience is just a retweak of the models to produce a number that isn’t so mock-worthy. There is no scientific reason offered, no new understanding of the climate. No one is even pretending that these modelers can explain the way our climate works any better than they did last year when they were utter failures. It’s all a charade. There is no honesty here — if there was, they’d admit the skeptics are years ahead of them.
The new paper is just about “staying the game”, a desperate injection to keep the dying movement alive. All the political messages remain untouched. It’s got everything to do with PR and nothing to do with science.
The numbers change (and nobody ever cared about them anyway) but PR meme is a carbon copy: We can just barely, possibly save the world. (Give us your money.)
To maintain an artificial money pump and a team of volunteer activists, the messaging has to balance on the fine line between being “too hard” and demoralizing the serfs, and being “too soft” and everyone gets complacent. It also obviously has to avoid the “too ludicrous” line and being the butt of jokes. This paper ticks all those boxes. “How convenient”.
The carbon budget was about to burn out too soon
Time for a paper to keep the scam running another 20 years:
The discrepancy means nations could continue emitting carbon dioxide at the current rate for another 20 years before the target was breached, instead of the three to five predicted by the previous model.
Time to neutralize the dire threat of Trump pulling out of Paris
In 2015 the Paris deal was set to save life on Earth and before Trump won, he was the Anti-Christ and going to destroy the planet. The problem with the hype is that he won and called their bluff — for the troops it’s a crushing dose of “no hope left”. Enter the PR marketeers with a press release titled: “New hope for limiting warming to 1.5°C”. Et Voila. Add to that the new “insight” that Trump and Paris don’t really matter as reported in the Telegraph:
They also condemned the “overreaction” to the US’s withdrawal from the Paris Climate Accord, announced by Donald Trump in June, saying it is unlikely to make a significant difference.
The press release doesn’t even try to look like a scientific advance. The evidence is from “complex Earth System Models” which mean it isn’t evidence and comes from the same models that didn’t work. So they have had a few assumptions tweaked to fit the facts. Whatever.
From the Press release:
Significant emission reductions are required if we are to achieve one of the key goals of the Paris Agreement, and limit the increase in global average temperatures to 1.5°C; a new Oxford University partnership warns.
Published today in the journal Nature Geoscience, the paper concludes that limiting the increase in global average temperatures above pre-industrial levels to 1.5°C, the goal of the Paris Agreement on Climate Change, is not yet geophysically impossible, but likely requires more ambitious emission reductions than those pledged so far.
Three approaches were used to evaluate the outstanding ‘carbon budget’ (the total amount of CO2 emissions compatible with a given global average warming) for 1.5°C: re-assessing the evidence provided by complex Earth System Models, new experiments with an intermediate-complexity model, and evaluating the implications of current ranges of uncertainty in climate system properties using a simple model. In all cases the level of emissions and warming to date were taken into account.
‘Previous estimates of the remaining 1.5°C carbon budget based on the IPCC 5th Assessment were around four times lower, so this is very good news for the achievability of the Paris targets,’ notes Professor Pierre Friedlingstein of the University of Exeter, a co-author on this study and a key expert on carbon budgets for the Intergovernmental Panel on Climate Change (IPCC). ‘The 5th Assessment did not specifically address the implications of the very ambitious 1.5°C goal using multiple lines of evidence as we do here. The ambition of Paris caught much of the science community by surprise.’
Co-author Professor Michael Grubb of University College London, concludes: ‘This paper shows that the Paris goals are within reach, but clarifies what the commitment to ‘pursue efforts to limit the temperature increase to 1.5°C’ really implies.
Pretends to be a science paper but openly dictates energy policy:
‘Starting with the global review due next year, countries have to get out of coal and strengthen their existing targets so as to keep open the window to the Paris goals.
As James Delingpole says:
Note the disingenuousness here.
Grubb is claiming that the facts have changed. Which they haven’t. Climate skeptics have been saying for years that the IPCC climate models have been running “too hot.” Indeed, the Global Warming Policy Foundation produced a paper stating this three years ago. Naturally it was ignored by alarmists who have always sought to marginalize the GWPF as a denialist institution which they claim – erroneously – is in the pay of sinister fossil fuel interests.
Allen’s “so it’s not that surprising” is indeed true if you’re on the skeptical side of the argument. But not if, like Allen, you’re one of those scientists who’ve spent the last 20 years scorning, mocking and vilifying all those skeptics who for years have been arguing the very point which Allen himself is now admitting is correct.
… that word you were looking for to describe the current state of global warming science is: “Sorry.”
ABSTRACT
(Political phrases bolded by moi)
The Paris Agreement has opened debate on whether limiting warming to 1.5 °C is compatible with current emission pledges and warming of about 0.9 °C from the mid-nineteenth century to the present decade. We show that limiting cumulative post-2015 CO2 emissions to about 200 GtC would limit post-2015 warming to less than 0.6 °C in 66% of Earth system model members of the CMIP5 ensemble with no mitigation of other climate drivers, increasing to 240 GtC with ambitious non-CO2 mitigation. We combine a simple climate–carbon-cycle model with estimated ranges for key climate system properties from the IPCC Fifth Assessment Report. Assuming emissions peak and decline to below current levels by 2030, and continue thereafter on a much steeper decline, which would be historically unprecedented but consistent with a standard ambitious mitigation scenario (RCP2.6), results in a likely range of peak warming of 1.2–2.0 °C above the mid-nineteenth century. If CO2 emissions are continuously adjusted over time to limit 2100 warming to 1.5 °C, with ambitious non-CO2 mitigation, net future cumulative CO2 emissions are unlikely to prove less than 250 GtC and unlikely greater than 540 GtC. Hence, limiting warming to 1.5 °C is not yet a geophysical impossibility, but is likely to require delivery on strengthened pledges for 2030 followed by challengingly deep and rapid mitigation. Strengthening near-term emissions reductions would hedge against a high climate response or subsequent reduction rates proving economically, technically or politically unfeasible.
Years from now this paper will be cited as another example of the way Nature sold out and became a mindless political tool.
REFERENCE
Miller, R.J. et al (2017) Emission budgets and pathways consistent with limiting warming to 1.5 °C, Nature Geoscience, doi:10.1038/ngeo3031
9.6 out of 10 based on 93 ratings
Democracy in action.
Fully 62% of Australians don’t want to pay a pitiful $10 a month for renewables. They are already paying more, therefore at least two-thirds of our parliament should be voting “No” on this. Why is Turnbull even toying with this?
Former prime minister Tony Abbott has threatened to cross the floor of Parliament and vote against any move to introduce a clean-energy target, describing as “unconscionable” any move to wind back support for coal in favour of renewables.
In his first interview with his former chief of staff Peta Credlin on Sky News’ Jones & Co on Tuesday night, Mr Abbott described climate change as “very much a third order issue”.
He suggested Liberal MPs had “extremely serious reservations” about the government’s clean energy target, and said last year’s power blackouts in South Australia had influenced the attitude of Liberal MPs to renewable energy.
“I think there is no chance that our party room will support any significant increase in the amount of renewables in our system.”
Asked whether he would support an attempt by Mr Turnbull to legislate for a clean-energy target, Mr Abbott replied: “It would be unconscionable, I underline that word unconscionable, for a government that was originally elected promising to abolish the carbon tax and end Labor’s climate change obsessions to go further down the renewables path,” he said.
The Turnbull government has a one-seat majority in Parliament, underscoring the potential of Mr Abbott’s threat to do real damage to the government.
Limit the damage ASAP:
Asked by Ms Credlin if he would scrap subsidies for renewable forms of energy, Mr Abbott said: “We have to respect people who have made investments in the existing system. We don’t want additional sovereign risk factors bedevilling our economy.”
But he said there should be no further subsidies: “There should be no subsidies for further solar and wind because this is inherently unreliable.”
At this point our market is so screwed the government may have to build a coal plant, because the subsidies and weather-alchemy-rules have made it impossible for the private sector to do what they have done for most of the last century.
Mr Abbott also suggested governments should build coal-fired power stations.
“Power generation is an essential service and if the market won’t build coal-fired power stations, if the market won’t build base load power, the government has got to,” he said.
The unspoken problem here is how to unscrew the market so the government can get out of the generation business.
Let’s let people tick “green energy” or “coal” on their personal power bills and adjust their electricity prices accordingly. Then we’d find out how many Australians really want a renewable energy target. That’s true democracy where people vote with their wallet.
Send a message to your rep.
Keep reading →
9.5 out of 10 based on 101 ratings
You have to hand it to The Australian – they will publish both sides. Take this (please, take it): “Our energy policy still stuck in coal country”. This is Alan Kohler, bless him, who doesn’t get it and dreams of a nation of motor-heads “going electric”. But, wow, ouch, watch how he reasons it out… not with numbers and graphs (he’s the numbers man on the nightly finance report) but with pop psychology?
The idea of an Australian government banning petrol and diesel cars to promote public health seems especially remote right now: we can’t keep the lights on as it is, having closed a few fossil fuel power stations.
But you can bet that the Coalition government and its media supporters will argue that the electrification of transport makes it even more necessary for there to be more “baseload power” from coal-fired power stations — how could we possibly charge millions of cars, and run millions of airconditioners and fridges if we let Liddell close in 2022?
And you can fix that Mr Kohler, how?
Wait for it…
This is the underlying reality of Australia’s energy debate: a majority of the government does not actually believe the science of climate change. Not really.
Politicians are generally in it for the public good. If they all believed in global warming, there would be a bipartisan energy policy.
Fergoodnesssake, If politicians all believed in being skeptics there would be bipartisan energy policy too.
If half of Parliament are skeptical, it is exactly as it should be in a representative democracy. Fifty percent of Australians are skeptical, but too scared to say so on TV for fear the ABC will call them a denier.
If belief were baseload we could run our cars on polls instead of petrol.
9.4 out of 10 based on 74 ratings
It will only take 50 plants like this, and $15 billion spare dollars, to replace the Liddell coal station (8,000GWh), now slated for closure in 2022.
Australians are set to pay $300 million in subsidies to an outback solar farm owned by a Saudi Arabian billionaire in a new test of the federal government’s looming energy reforms, escalating a dispute over whether to cut the handouts to keep coal-fired power stations alive.
AGL’s controversial Liddell coal power station in the NSW Hunter Valley generates 50 times as much electricity as the Moree solar farm in the state’s north, which stands to gain big subsidies from households from higher electricity bills until 2030…
But we need more chinese-built glass panels that make green weather-controlling electrons.
Lucky solar power is so competitive. Look at the money roll…
The Moree solar farm generates 150,000 megawatt hours of electricity a year, about 0.08 per cent of the 200 terawatt hours produced on the national electricity market every year. The project is forecast to collect about $50m in payments over the next four years and $90m in the following decade under the existing RET.
Subsidies piled on subsidies? Does one gravy train know where the others are going?
These subsidies, funded by electricity customers, will add to taxpayer aid including a $101.7m direct grant from the Australian Renewable Energy Agency and a $60m concessional loan from the Clean Energy Finance Corporation.
AGL is getting even more:
The Australian yesterday reported that AGL stood to receive $589m from the grants and subsidies for two solar projects over the period to 2030,…
Solar is the future, my foot.
REFERENCE
Crowe, David (2017) Saudi solar tycoon’s $300m handout, The Australian, Sept 19, 2017.
9.8 out of 10 based on 94 ratings
Dr Duane Thresher who worked seven years at NASA GISS describes a culture of self serving rent-seekers, mismanagement and incompetence. These are the top experts in the climate science field that we are supposed to accept without questioning. Those who say they are working to “save the planet” care more about their junckets than they do about the data or their “best” model.
NASA GISS’s most advanced climate model is run from the Goddard Space Flight Center (GSFC). Thresher recounts a story from someone on the inside:
“NASA GISS’s climate model — named Model E, an intentional play on the word “muddle” — is called the “jungle” because it is so badly coded.” I know this to be true from my own extensive experience programming it (I tried to fix as much as I could…).
Thresher writes about how the team was happy to take taxpayer funds and spend it on unnecessary conferences which were “loads of fun” while they scrimped and saved on things like data security and incompetent tech staff. Secretaries and mail boys were hired for jobs they were not qualified for. At one point data was lost when exposed plumbing leaked in the computer room.
One of the guys hired/promoted to provide tech support was the NASA GISS mail boy. He was a good kid so why not give him a high-paying tech job?
Similarly, a NASA GISS secretary was hired/promoted to provide tech support. She was very nice but c’mon.
Another of the guys hired was so incompetent a bunch of the climate scientists finally got together and demanded Jim Hansen, head of NASA GISS then, fire him, WITHOUT REPLACEMENT. Tech support got BETTER after that.
While I was nearing completion of my dissertation at NASA GISS, an exposed water pipe to the bathroom overhead broke in the computer room, destroying thousands of dollars worth of computer equipment and data, including mine; the “data recovery” by incompetent NASA GISS tech support destroyed even more. To start, you should be shaking your head and saying, “why are there exposed bathroom water pipes going through a computer room?”
Even though flights are a large contributor to carbon emissions, climate scientists were keen to fly for fun:
Even though nowadays conferences could easily and more efficiently be done as teleconferences, climate scientists love to travel to FUN places for conferences, paid for by the taxpayer. We were no different, as we said in AGU’s “Climate Change: Believe It Or Else” Prize…
At some climate conferences, climate scientists can even donate some of their conference travel money to offset the carbon emissions from the travel. The tiny number of participants would make Scrooge blush.
He wanted to be a whistleblower but the media weren’t interested
I wanted to be like FBI agent Mark Felt, who was the Watergate informant Deep Throat, or Edward Snowden, the NSA informant. Secretly supplying inside information to bring down a government agency gone bad. (Due to lawmakers actually hating whistleblowers, Snowden isn’t covered by whistleblower laws, but I might be.) I even tried that at first (did you know that you can’t simply email information to WikiLeaks but have to use Tor, which can be a bit of a hassle?).
Journalists weren’t interested. This shouldn’t have surprised me. Read Glenn Greenwald’s No Place To Hide, which is about Edward Snowden and the NSA. Snowden practically begged Greenwald for months to take his information but Greenwald was too lazy. The Washington Post (which also stalled Snowden), The New York Times (“Pravda On The Hudson”), and the rest are worthless at this point so we became our own newspaper. Recognize our masthead font?
Thresher is pressing a case against Gavin Schmidt, current head of NASA GISS, for violations of the Hatch Act. (Quote: “…the Hatch Act, …forbids government officials from spending government time and money on political activities.”)
What usually happens is that money for specific projects is pooled to pay the grad students, although usually there is one big money project paying the lion’s share. That means that many grad students are paid off grants for specific projects but are not working on those projects. I remember once at NASA GISS having to write up a progress report for a project I didn’t really work on but was paid off of. That is the definition of “misspent”.
Our article, Top NASA Climate Scientist Uses Private Email To Avoid Oversight, describes well Gavin Schmidt’s violation of the Federal Records Act while at NASA GISS. But we’ve only briefly touched upon his violation of the Hatch Act. Here is my email to the NASA OIG agent that describes the Hatch Act violation best.
He advises skeptics and commentators to use FOI to go after the money instead of the data.
“The data is often fundamentally flawed. How you process it after that is irrelevant. Garbage in, garbage out. “
9.9 out of 10 based on 109 ratings
|
JoNova A science presenter, writer, speaker & former TV host; author of The Skeptic's Handbook (over 200,000 copies distributed & available in 15 languages).

Jo appreciates your support to help her keep doing what she does. This blog is funded by donations. Thanks!


 Follow Jo's Tweets
 To report "lost" comments or defamatory and offensive remarks, email the moderators at: support.jonova AT proton.me
Statistics
The nerds have the numbers on precious metals investments on the ASX
|


Recent Comments