…
|
|
||||
|
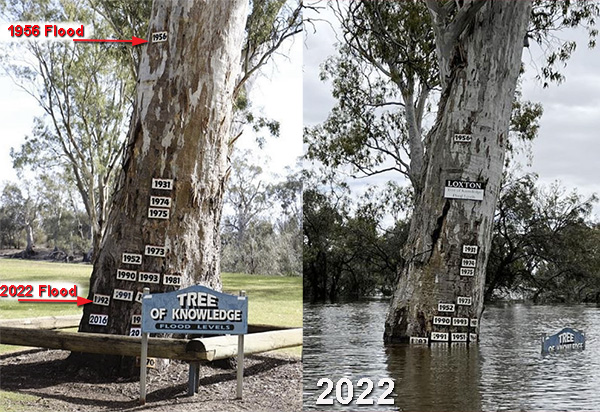
The Murray River was far higher in the 1970 floods and worse still in 1956 when CO2 was just 314ppm. Obviously, if all current floods are “caused by CO2”, we need more of it.* A photo of flood markers on a tree in South Australia has sparked a debate on Facebook. The only things we know for sure — floods were worse when CO2 was perfect, and censorship of banal truths is the only way to stop the climate change rort unravelling. Picture of tree at centre of furious flood debateNews.com.au A picture of a tree in regional South Australia has sparked a wild climate change debate.As floodwaters from the River Murray crept up the Loxton’s Tree of Knowledge, one local thought it was a good time to take a picture to put things into perspective. 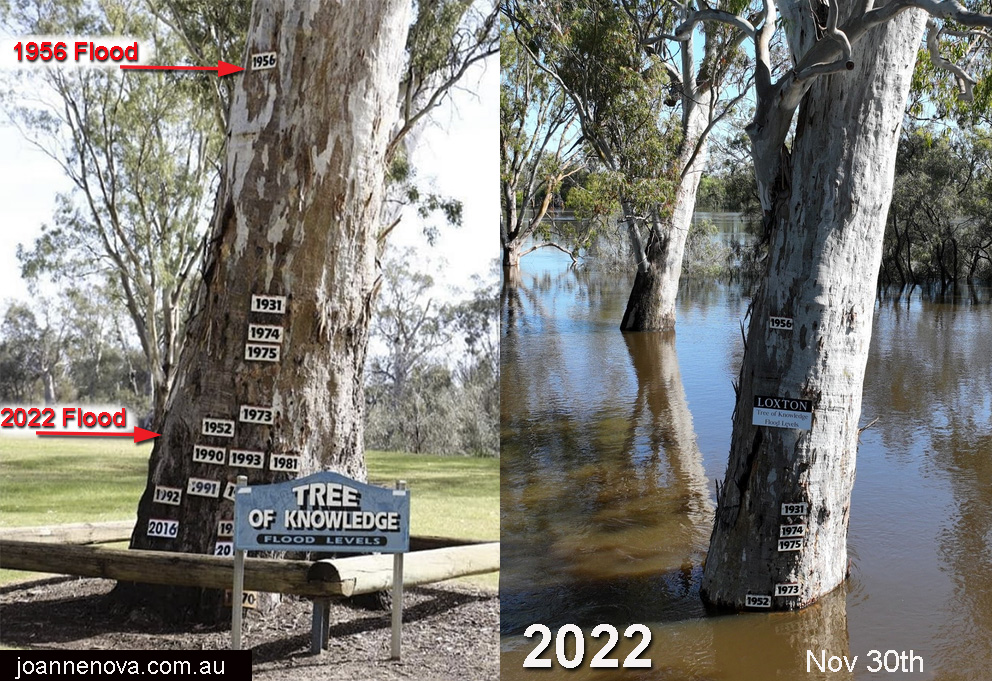 The updated flood markings of The Tree of Knowledge, SA, Nov 30th, 2022. Click to enlarge UPDATED: Dec 2, 2022. Previous photo Nov 28th. See future updates on flood levels (weekly) here. Thanks to Craig Thomas. The depth of the scientific response: “Using one tree as evidence to suit your agenda shows what level of intelligence we are dealing with,” one said. “There are many factors why areas have worse flooding. There is no denying though, with mass land clearing as one factor, flooding will only get worse under extreme climate events such as La Nina,” he continued. History speaks on the Land of Droughts and Flooding Rains: 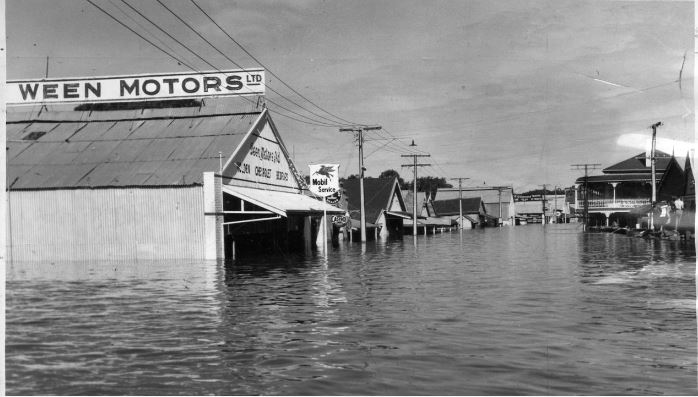 Main street of Mannum under 2.4m to 3m of water in 1956. As many as 4,000 homes may be inundated as flood waters rise, and our thoughts are with them. Because the Murray River drains a basin that covers one million square kilometers, the waters are flowing from up to two thousand kilometers away. The peak may not happen til later near Christmas.  Murray–Darling Basin Authority. Loxton and Mannum are in South Australia | Click to enlarge *Using Tim Flannery reasoning. h/t Richard C NZ and David We’ve never had another third quarter this expensiveDespite setting price records — averaging $200/MWh across the whole quarter for the whole five-state National Energy Market, there’s like a cone of silence around the price of brown coal. The ABC is happy to evangelize about 30 minute “renewable energy records”, but they don’t mention that the three-month total system costs went off like a bomb. Somehow Australia has all that free cheap green power and yet the wholesale costs exploded. The system broke: 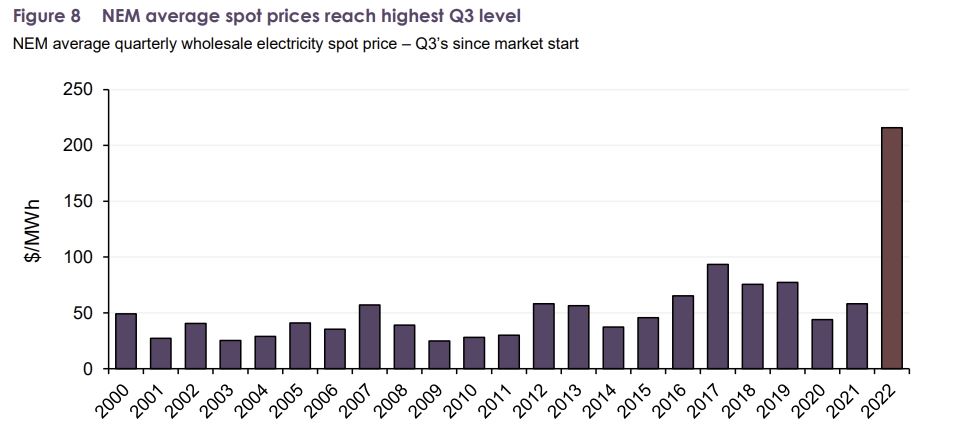 No other Q3 has ever been this expensive. But one unmentionable fuel type was still cheapThe average wholesale price for all generators last quarter was 20 cents a kilowatt hour (or $200 per megawatt hour), but brown coal generators were still able to supply during that same incendiary quarter for just at 4c a KWh. That was the average “winning bid”. So last quarter brown coal was one fifth the price of black coal, and one sixth the price of gas or hydro, and no one is talking about it. 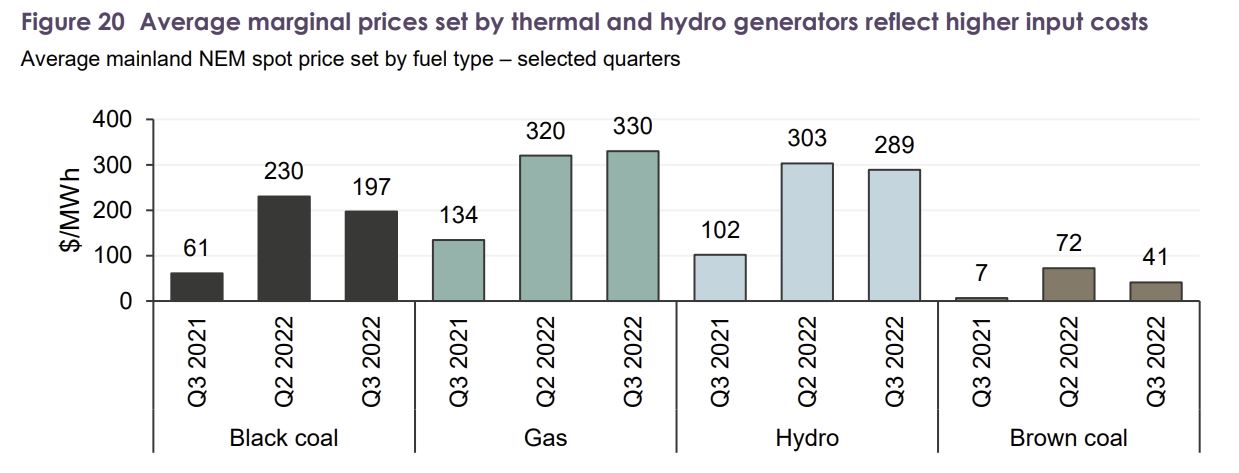 The cheapest prices were from brown coal. (Far right) Imagine if Australia had a free market in electricity?Ponder for a moment, if households were allowed to choose the generator they wanted to buy electricity from? Imagine if there was a company that sold brown coal power direct to the customers? Obviously the government would have to ban it, or regulate it away, or everyone would buy it. If nine out of ten households just wanted cheap reliable electricity, and they could get it, the free market grid would be full of coal plants. If the solar and wind plants had to pay for the extra transmission lines, the batteries, and the backup generators as one package, there would be a tiny niche market for rich-hipsters and Gucci-grid show-offs. Brown coal or lovely lignite, is immune to the international crisis in energy stocks. It can’t be loaded on container ships (it burns spontaneously). It is our insurance, our cheapest baseload power, our back-up in times of war or inflation. And we still have 300 years of coal left to burn (of both the brown and black stuff). If we started now, we could have cheap electricity in less than ten years. Keep reading → November 26th, 2022 | Tags: Coal, Free Markets | Category: Big-Government, Cost, Electricity, Fossil Fuels, Global Warming |  Print This Post | | Print This Post | |
See Rebel News and spread the word. Where was “the ABC”? — Good luck to Victorians. Reader Yarpos suggests Turning Point Australia to see how your preferences flow before voting. November 26th, 2022 | Tags: Election (corruption), Victoria | Category: Australia, Corruption, Election security | Print This Post | | … The latest State of the Climate Report is out to scare everyone with plucked esoteric records based on dubious datasets adjusted with secret algorithms.
The biggest crimes of this report are what they don’t say. The CSIRO and BoM must know, but don’t mention, that satellites don’t show any warming in Australia in the last ten years at all. Satellites track across all seven million square kilometers of Australia, and are calibrated against thousands of weather balloons. The CSIRO and BoM prefer to use thermometers in carparks, near runways, or close to incinerators, then they magically adjust trends at some sites up by as much as 2 degrees (that’s the whole century-long trend right there?!) They also don’t mention that scientists in Australia were reporting that Australia was cooling from the 1890s to 1952. (Deacon et al) The ghastly heat of 1896, the Federation Drought, and the 50C record temperatures all over Australia all go down the memory hole. 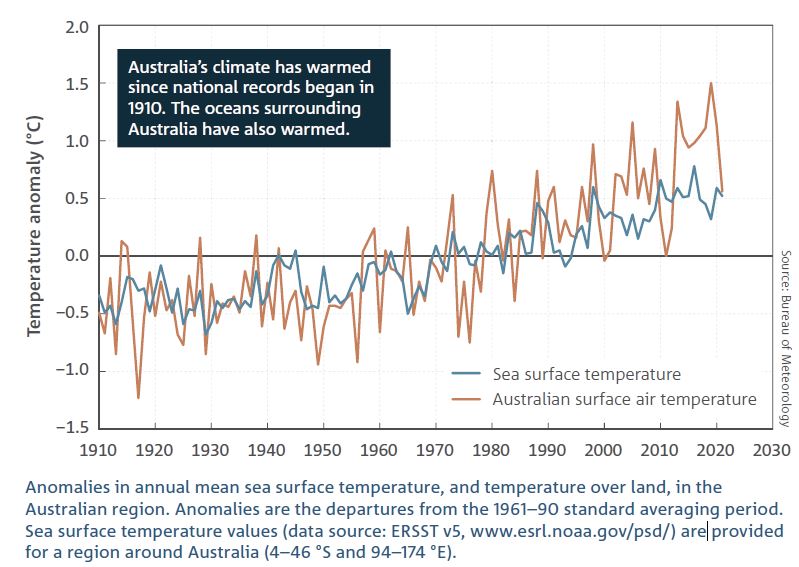 Big Scary Graph according to the Sun Herald. From the State of the Climate Report, 2022. But it makes sense in a non-scientific kind of way. Government funded scientists would get smaller grants if there was no climate crisis. There are a billion reasons to find “global warming” and none at all to find natural cycles of weather that no one can tax. The hapless researcher who finds that Australia has always been a land of droughts and flooding rains will find themselves sacked for being non-collegial, called a pariah and a climate denier. Just ask Peter Ridd. This is what we are panicking about?If the CSIRO and ABC were really serving Australians they’d mention that the best equipment there is shows that Australian temperatures are largely the same now as they were ten years ago. The UAH data is calibrated with thousands of weather balloons released by the very same BoM, but not calibrated (thankfully) with the incompetent thermometers on the ground. Wow, what a different picture this is? 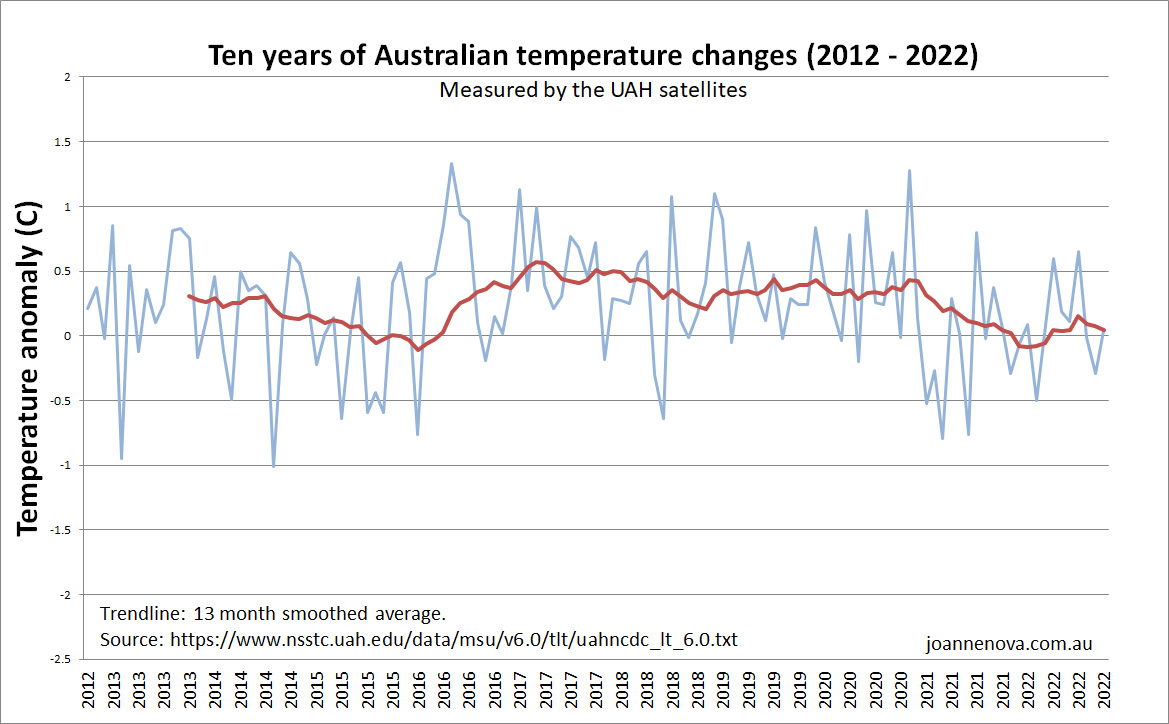 Australian temperature variation as measured by UAH satellites. (2012 – 2022) | UAH Data. In the same ten year period CO2 has increased from to 391 ppm up to 416 ppm. That’s a full 25 additional ppm of the planet-heating-gas yet who could tell? Part of the global warming seen in the top graph, but not recorded by satellites, is found with expert thermometers like the one in Maitland (SA) pictured here. This thermometer is not part of the official best 100 official ACORN sites, but it has been used to “correct” the data from at least six of those sites. Ken Stewart assessed hundreds of these sites and found many were not compliant with the Bureau’s own guidelines. 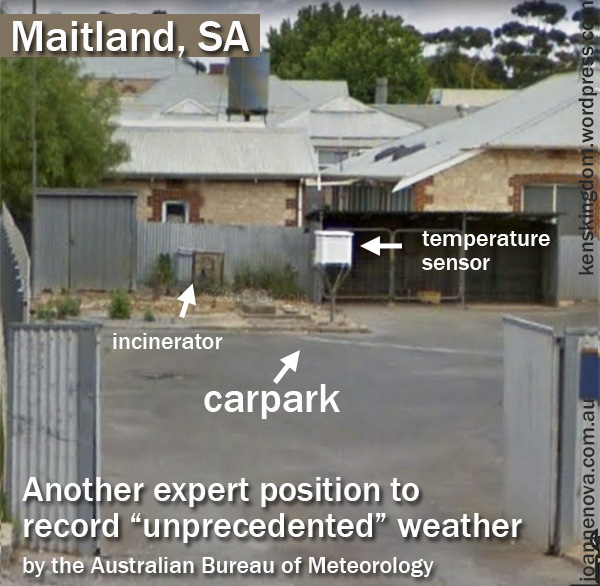 This Maitland thermometer will find global warming. Thanks to Ken Stewart. | Imagery ©2019 Google, Oct 2014. The same with Streaky Bay. It’s moved to a better home now but for 31 years it too was used to “correct” some official sites from this hot car park. How concerned were these meteorologists? We’ll spend a trillion dollars buying wind farms before we fix up our thermometer sites and records… 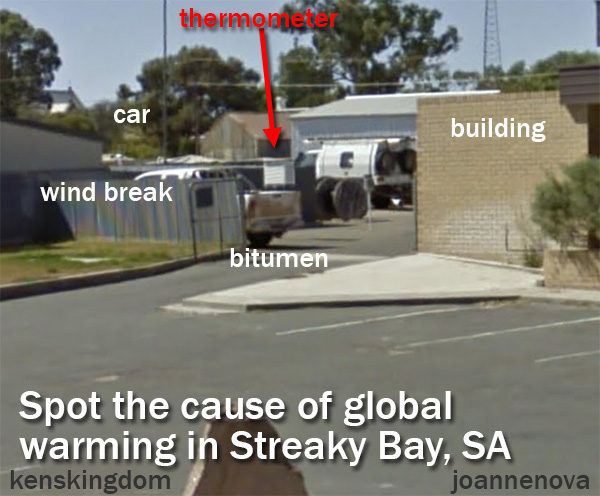 Streaky bay meteorology. More info at Ken Stewarts site. | ©2019 Google. Image Capture Mar 2010. 40% of our man-made warming was in the last eight (flat) years?Suddenly in the 2022 report the experts are saying Australia has warmed by 1.5°C since 1910. But in 2014 the very same experts said “Australia’s climate has warmed by 0.9°C since 1910”. So the BoM says we are 0.6 degrees warmer now than in 2014 and 40% of our entire century long trend happened in the last eight years. We know the science is settled and all, but according to the satellites Australia is the same temperature now as it was in 2014? (Still, it’s a bit unfair to think all the warming occurred after 2014. With the power of expert adjustments it’s quite possible in the last eight years the 1910’s got colder too. The poor sods of World War I! More frosts than they ever realized…) This seems a good point to remember those historic heatwaves.  Historic heatwaves. 50 degree temperatures were everywhere, right across Australia in the 1800s and 1900s.| Oops. The pace of warming has slowed, not sped upThe full satellite record shows Australia has warmed in the last 43 years, but the rate of warming has slowed since 2007 (draw a line with your mind’s eye). Rather than accelerate, as all the Chinese emissions of CO2 filled the sky, the warming in Australia slowed down. Not what the models predicted. Not accelerating. Not apparently affected by extra CO2. 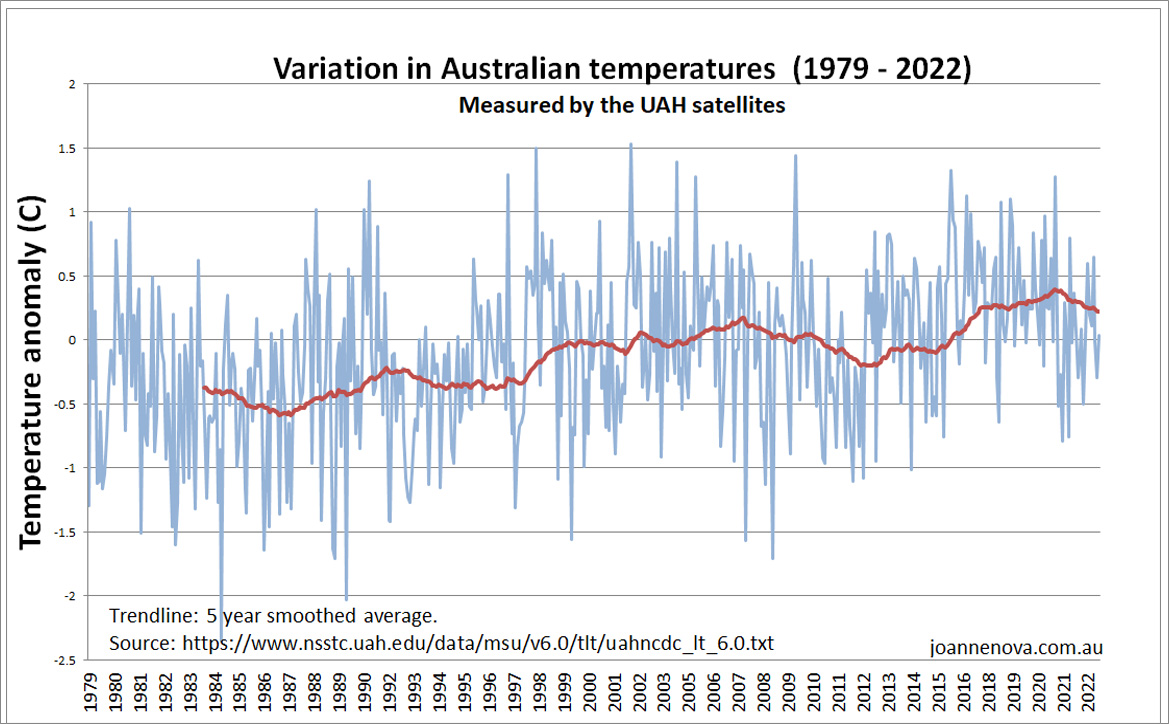 Australian temperature variation as measured by UAH satellites. (1979 – 2022) Something else, or several other things, are driving our climate and the modelers don’t know what they are. Finally, here’s a flashback just to remind us of why the UAH satellite system really is the best record of temperatures. Five reasons UAH is different (better) to the RSS global temperature estimates
Lastly The CSIRO budget is $1.2 billion a year and the BOM’s is $300 m. Why is it left to unfunded volunteers to provide the full story? Hat tip to Neville, RickWill, b.nice. But also thanks to Ken Stewart, Chris Gillham, Lance Pidgeon and all the BOM Audit team. Keep reading → November 25th, 2022 | Tags: Australian temperatures, BOM, CSIRO, UAH | Category: Global Warming | Print This Post | | The South Australian Health department must have known about the surge of young people with heart problems, but they did nothing. The only reason we have this data now is because Senator Antic filed an FOIA to get it and that’s a scandal in itself. The pattern is very similar to the pattern of excess deaths in the UK, in Germany and in the US — yet the media (or worse, some doctors) can’t seem to figure it out. In the US in almost the same three month period of 2021 there was a a 200% increase in excess deaths in 35 to 45 year olds. In South Australia the number of cardiac presentations (not deaths) — rose from around 1200 a month to 2172 — a rise of 180%. 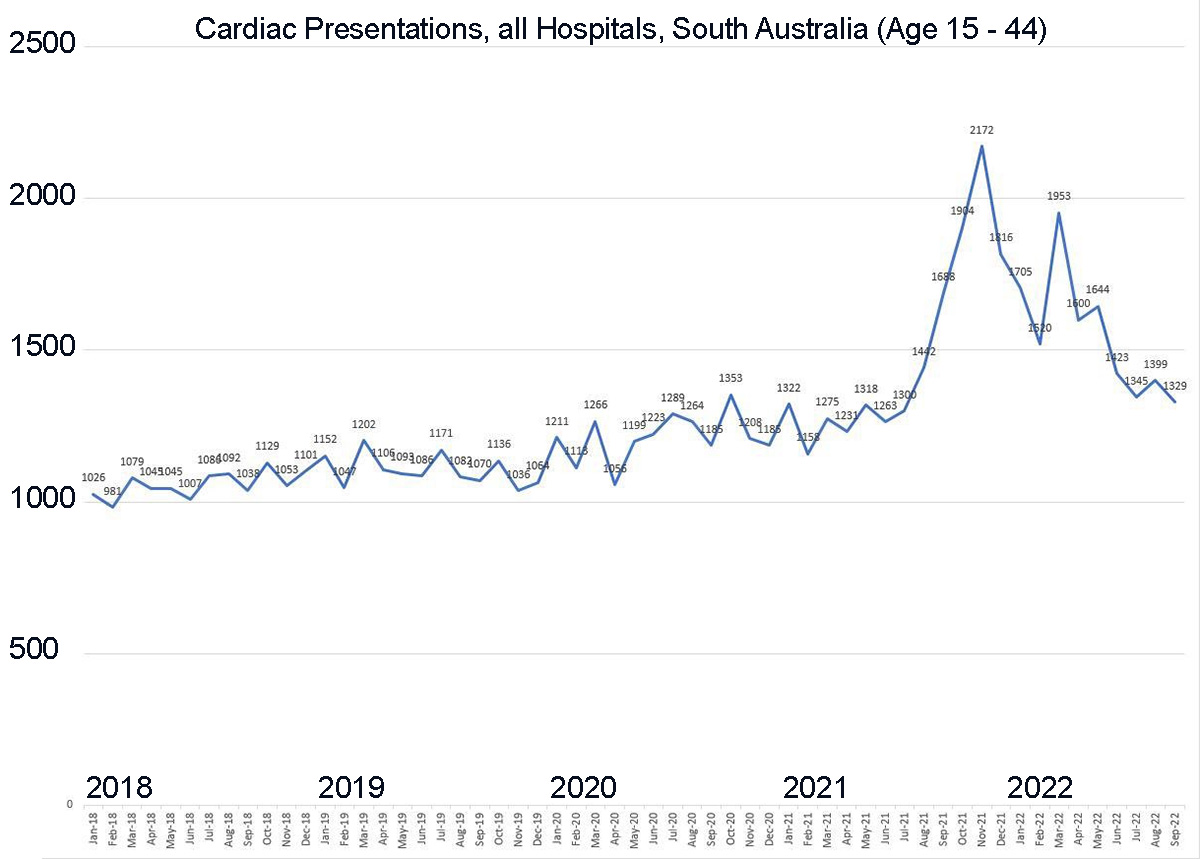 Cardiac presentations in South Australian hospitals . | Click to enlarge These cardiac events in 2021 were not caused by Covid.South Australia makes a tidy control case. Unlike most other nations there were virtually no cases of Covid at all until after New Years Eve 2022. So the entire first and highest peak in cardiac problems occurred months before the virus even started circulating. 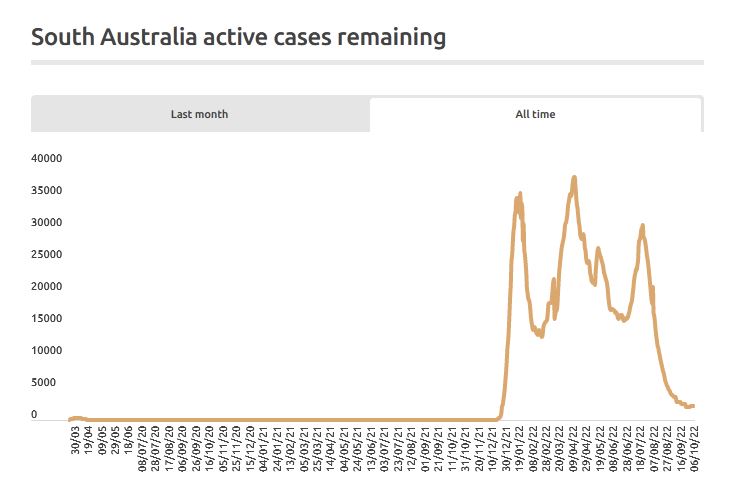 There were virtually no cases of Covid in South Australia until after New Year 2021. | Covid19data Senator Alex Antic*: Cardiac Presentations for 15 – 44 year olds in South Australia …almost doubled as the vaccines were rolled out. They are harming and killing young people. This injection campaign is going to go down as the greatest scandal in medical history and none of you said a thing. *Posted by Senator Gerard Rennick So many questions arise from this — when did the TGA, ATAGI and Federal Minister of Health become aware if this? Why didn’t they stop the vaccine rollout? The Premier and SA Minister of Health were forcing vaccine mandates on many people in this age group — isn’t data like this urgent and important so people have informed consent? If this data was available but withheld does that mean no one in South Australia (or anywhere else) could have given consent…? Past posts on excess deaths:
STICKY POST: Thursday December 1: Meet Jen Marohasy and myself tonight at the screening of two short films, Bleached Colorful, and Finding Porites, showing the real state of the Great Barrier Reef. It’s on at 6.30pm at The Windsor Cinema, Nedlands. Tickets here. Keep reading → November 23rd, 2022 | Tags: Marohasy (Jennifer), Social Events for Skeptics, Western Australia (WA) | Category: Australia, Event, Global Warming | Print This Post | | The would be King-Emperors of the world don’t just want to transform energy and change the weather, they also want to rebuild the entire financial system, no doubt to put the UN at the centre of the rivers of money. Make no mistake, the lauded “loss and damages” fantasy plan was but a shiny bauble to distract you. The bigger ambit is to get the West to pay for the whole world to become a solar and windmill paradise and — “obviously” that means they have to rebuild the entire world’s financial system. (They actually say that). Consider the numbers: The combined loss and damages claim for 55 countries over twenty years amounts to just $525 billion or a paltry $26 billion a year. But building all the useless renewable farms will supposedly require at least USD 4-6 trillion a year in investments. Sensible investors will notice that it is 200 times as expensive to try to control the weather with windmills as it is to pay for all the current (theoretical) damage. Sadly, nobody is talking about sensible investments. The UN announcement comes dressed up in a headline about the paltry Christmas fantasy payments to the third world. But a few paragraphs in are the “other details” about payments that are larger than most national GDP’s and the naked desire for the UN to be the conduit for the cash. UN COP27 Reaches Breakthrough Agreement on New “Loss and Damage” Fund for Vulnerable Countries[blah, blah, blah] The cover decision, known as the Sharm el-Sheikh Implementation Plan, highlights that a global transformation to a low-carbon economy is expected to require investments of at least USD 4-6 trillion a year. Delivering such funding will require a swift and comprehensive transformation of the financial system and its structures and processes, engaging governments, central banks, commercial banks, institutional investors and other financial actors. So much better to siphon from the centre, eh? Let me be your banker…Think about how obscenely large this claim is in the strangely aptly named Sharm el-Sheikh Implementation Plan. On page 6 we casually find that there are layers of trillions, and despite the enormity of the values, no one bothered to explain if these are different additive trillions or overlapping trillions. And since the first reference has 54 mentions of the word “trillion” it isn’t easy to figure it out either. What does it matter, it’s only money? They might be hoping for ten trillion per annum, with a 6 trillion one off bonus in the next eight years: Highlights that about USD 4 trillion per year needs to be invested in renewable energy up until 2030 to be able to reach net zero emissions by 2050,18 and that, furthermore, a global transformation to a low-carbon economy is expected to require investment of at least USD 4–6 trillion per year;19 Notes with concern the growing gap between the needs of developing country Parties, in particular those due to the increasing impacts of climate change and their increased indebtedness, and the support provided and mobilized for their efforts to implement their nationally determined contributions, highlighting that such needs are currently estimated at USD 5.8–5.9 trillion20 for the pre-2030 period; I defy anyone to explain the difference between a “renewable energy cost” and a furthermore category of… “low carbon global transformation cost”. Will that be $4,000 from every family or $40,000?Only a week ago the UN was asking “rich nations” for well beyond a trillion dollars a year to help the Global South. But even at that bargain price, effectively the UN is demanding $1000 US per annum from every man, woman, pensioner and baby in the West.* How many families of four will be happy to chip in $4,000 US (or $6,000 Australian) every year to build solar farms in Mogadishu is a question no one wants to ask. The bottom line is that the token offering of “loss and damages” to the world’s poor is nothing compared to the dark ambition of being the world’s Treasury and Energy Police. The UN is the enemy. The West conquered communism then gave its’ friends money and an office in Geneva. Keep reading → November 23rd, 2022 | Tags: Climate Money, UNFCCC, United Nations (UN) | Category: Global Warming | Print This Post | | … By Jo Nova They’ve simply announced a new category of globalist graft“…the text of the agreement leaves open a number of crucial details to be worked out next year and beyond, including who would contribute to the fund and who would benefit.” But there is no agreement yet over what should count as “loss and damage” caused by climate change – which could include damaged infrastructure and property, as well as harder-to-value natural ecosystems or cultural assets. A report by 55 vulnerable countries estimated their combined climate-linked losses over the last two decades totalled $525 billion, or 20% of their collective GDP. Some research suggests that by 2030 such losses could reach $580 billion per year. So even with all the exaggeration — with fifty five countries and twenty years of back-claims — the tally amounts to just 26 million per year in damages? “Loss and damages” is a plan to tax the West for bad weather in Somalia or a frost in UruguayIf it ever amounts to anything, nations of the West will just shift money from “foreign aid” baskets and funnel it through the UN to make it even less effective for the world’s poor. It will fatten up corruptocrats in third world enclaves and provide bread and honey for UN hollowmen and junketeers. There will be no incentive for the tin pot nations to build sea-walls, stop erosion or do hazard reduction to stop fires — because the worse the catastrophe is, the more money they can ask for in “losses”. So third world governments will be less accountable for their own incompetence as they blame-shift to the West, but they’ll get more dependent on the UN as sugar-daddy. All in all, it will be a win for creeping communism but a loss for the everyone else. It’s another road to One World Government. Thank the West for releasing all the CO2. Consider it a gift…The West doesn’t need to pay the world for imaginary “climate damage”. CO2 is a net benefit worth billions. It has increased crop yields, and plant growth and helped feed the world, it has thickened the forests, increased mangroves, and reduced desertification (Goklany, 2015). There are 18 million more square kilometers of greenery in the world. (Zaichun, 2016). If the temperatures do increase two degrees, and CO2 hits 700ppm, corn is estimated to grow 25% faster and soy beans will boom by 31%. (Qiao et al 2019) Let’s burn oil and feed the world.  Carbon dioxide fertilization (in ppm, horizontal axes) of C3 crop and C4 weed Nearly nine out of ten islands of 700 Pacific and Indian ocean are growing more than shrinking (Duvat, 2018), and the 11% that are shrinking are so small they have no human inhabitants. Zero. So let’s pay nothing to no one for sea level rises, but send a bill to the islands with extra real estate? What has the West ever done for you?The third world seems happy with cars, trucks, electricity, antibiotics, gas and planes. They like their fertilizer, poly-cotton, concrete, sealed roads and smart phones. The game of retrospective injuries and awards can be played by both sides. “There is no need to pay reparations. Our leadership of the industrial revolution brought prosperity to the world and led to increased life expectancy and better living conditions.” As CO2 grew, the population of Africa expanded from 155 million one hundred years ago to 1,500 million now. A billion more African lives… 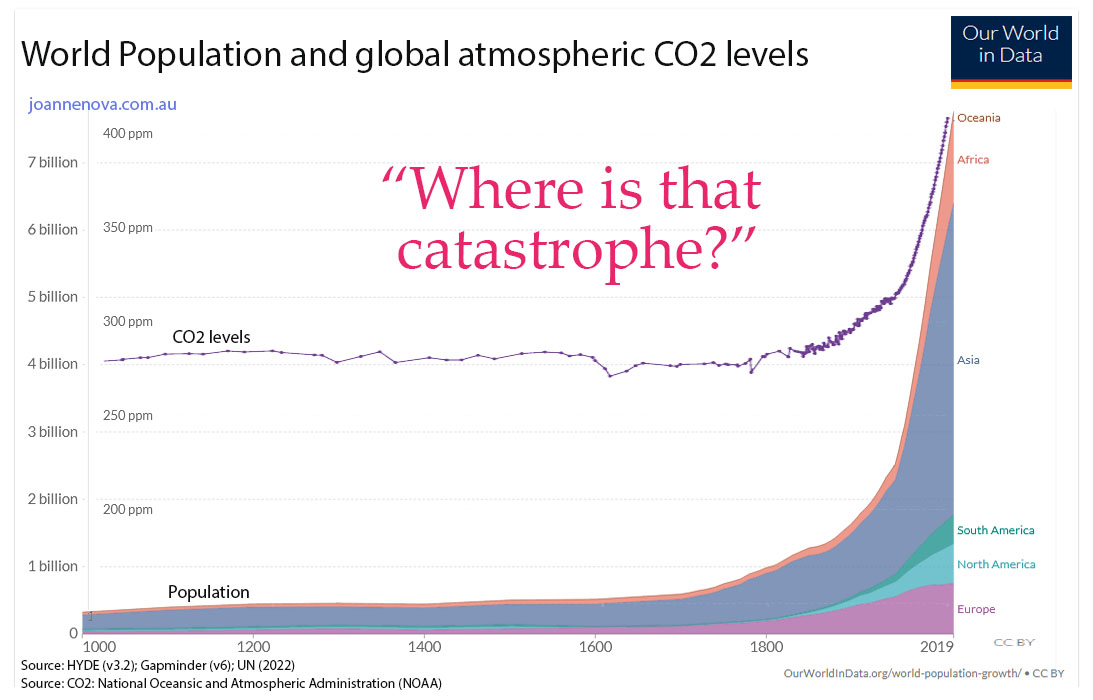 … CO2 is a net benefit to life on Earth, and so is the West. Keep reading → November 22nd, 2022 | Tags: Plant growth, UNFCCC | Category: Big-Government, Global Warming | Print This Post | | …
Elon Musk ran a poll on reinstating Donald Trump which was pulling in a million votes an hour at one point. Elon Musk then declared that Donald J Trump’s account will be restored. And it appears to be live, though missing 75 million followers, and Trump himself, who still says he’ll stay on Truth Social. Elon Musk tweeted, “Vox Populi, Vox Dei,” which means “the voice of the people is the voice of God.’ 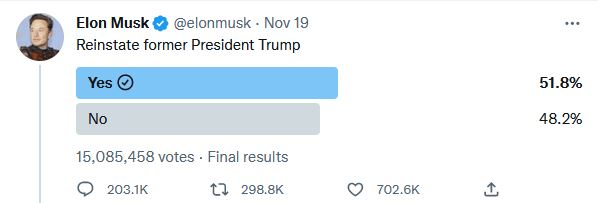 …. It’s is encouraging the vote was evenly split. It suggests Twitter might be able to be able to be a “town square”. However the Corruptocracy that depends on censorship are not finished yet, and an EU spokesman said Musk will have to open his algorithms (did the EU demand this of the last owners?). Thierry Breton the EU’s internal market commissioner said Musk will have to “fly by our rules” and that he will have to increase the number of moderators in Europe. Breton said “we will have control, we will have access, people will no longer be able to say rubbish”. Which means people in the EU will only be able to say or hear what the EU wants. The solution is for countries to leave the EU. November 20th, 2022 | Tags: Free Speech, Twitter | Category: Europe, Free Speech, Global Warming, USA | Print This Post | | .. Spock (Leonard Nimoy) was warning people about the next ice age coming in 1978: The world has cooled for the last 3,000 years. The glaciers have expanded. Temperatures have fallen dramatically in the last 30 years. If we are not prepared for the coming ice age, we’ll see hunger and death on an unprecedented scale…. In the documentary below there is footage of the “perilous state of Buffalo” in 1976/77 when it was hit with savage cold and snow (from about 13 minutes in). Today (in 2022) news is coming in from Buffalo, NY which has just had 5 feet of snow fall. Every 30 years the herd may panic in a different direction…News cycles follow the natural ones (and the money). So at the depths of the cooling from WWII to the 1970s there were ice-age stories. Then came the warming stories, and the IPCC extrapolates a thirty year trend to infinity…  Graph by Syan Akasofu hat tip to Climate Depot
November 20th, 2022 | Tags: Ice Age, Ice Age Scare, Little Ice Age | Category: Global Warming, Media-matters | Print This Post | | |
Jo appreciates your support to help her keep doing what she does. This blog is funded by donations. Thanks!
   |
|||
|
Copyright © 2026 JoNova - All Rights Reserved |
||||
 This is a public service announcement for Victorian voters in their election today.


Recent Comments