The latest State of the Climate Report is out to scare everyone with plucked esoteric records based on dubious datasets adjusted with secret algorithms.
 The star of the report is the 1.5 degrees of Australian “hockeystick” graph of warming (below). The Herald Sun calls it “Scary”.
The biggest crimes of this report are what they don’t say. The CSIRO and BoM must know, but don’t mention, that satellites don’t show any warming in Australia in the last ten years at all. Satellites track across all seven million square kilometers of Australia, and are calibrated against thousands of weather balloons. The CSIRO and BoM prefer to use thermometers in carparks, near runways, or close to incinerators, then they magically adjust trends at some sites up by as much as 2 degrees (that’s the whole century-long trend right there?!)
They also don’t mention that scientists in Australia were reporting that Australia was cooling from the 1890s to 1952. (Deacon et al) The ghastly heat of 1896, the Federation Drought, and the 50C record temperatures all over Australia all go down the memory hole.
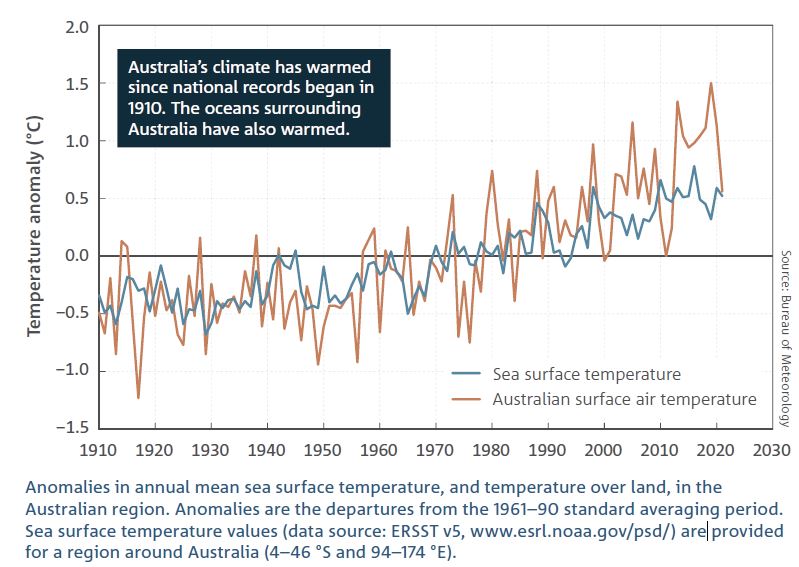
Big Scary Graph according to the Sun Herald. From the State of the Climate Report, 2022.
But it makes sense in a non-scientific kind of way. Government funded scientists would get smaller grants if there was no climate crisis. There are a billion reasons to find “global warming” and none at all to find natural cycles of weather that no one can tax. The hapless researcher who finds that Australia has always been a land of droughts and flooding rains will find themselves sacked for being non-collegial, called a pariah and a climate denier. Just ask Peter Ridd.
This is what we are panicking about?
If the CSIRO and ABC were really serving Australians they’d mention that the best equipment there is shows that Australian temperatures are largely the same now as they were ten years ago. The UAH data is calibrated with thousands of weather balloons released by the very same BoM, but not calibrated (thankfully) with the incompetent thermometers on the ground.
Wow, what a different picture this is?
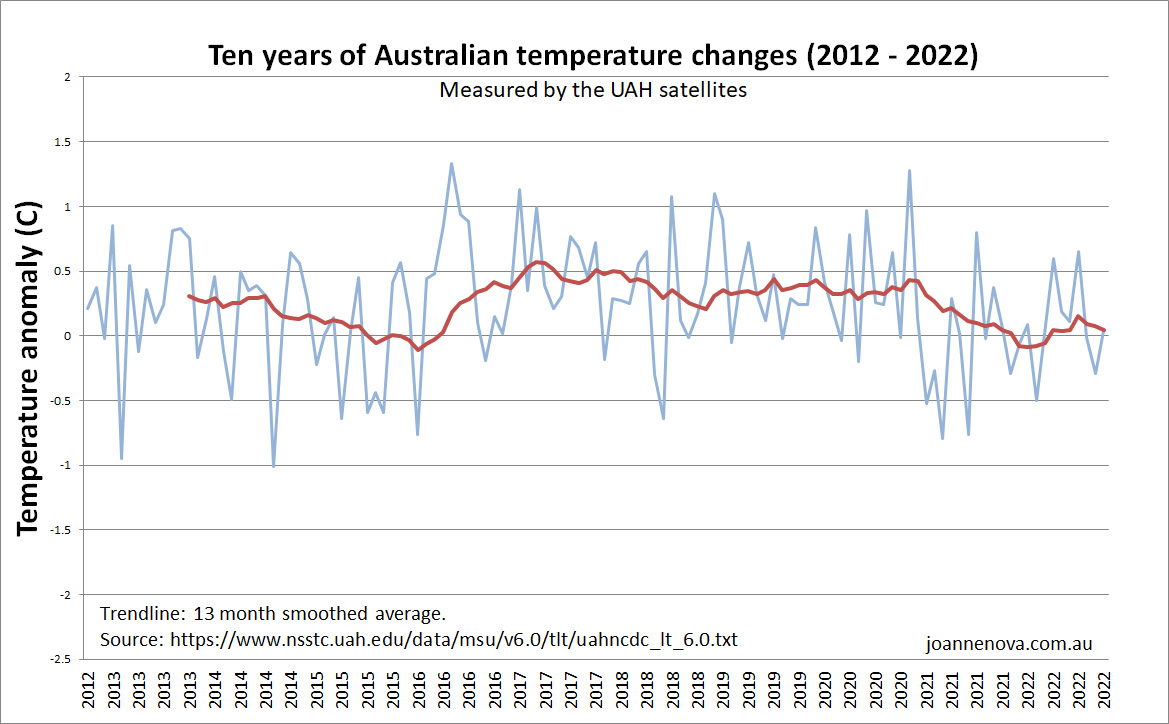
Australian temperature variation as measured by UAH satellites. (2012 – 2022) | UAH Data.
In the same ten year period CO2 has increased from to 391 ppm up to 416 ppm. That’s a full 25 additional ppm of the planet-heating-gas yet who could tell?
Part of the global warming seen in the top graph, but not recorded by satellites, is found with expert thermometers like the one in Maitland (SA) pictured here. This thermometer is not part of the official best 100 official ACORN sites, but it has been used to “correct” the data from at least six of those sites. Ken Stewart assessed hundreds of these sites and found many were not compliant with the Bureau’s own guidelines.
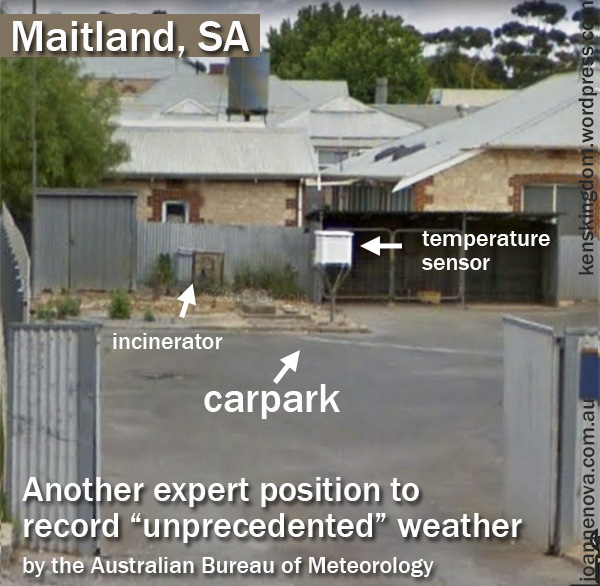
This Maitland thermometer will find global warming. Thanks to Ken Stewart. | Imagery ©2019 Google, Oct 2014.
The same with Streaky Bay. It’s moved to a better home now but for 31 years it too was used to “correct” some official sites from this hot car park.
How concerned were these meteorologists? We’ll spend a trillion dollars buying wind farms before we fix up our thermometer sites and records…
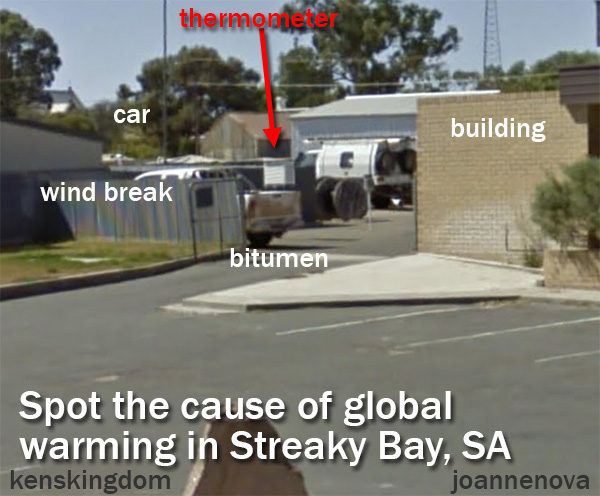
Streaky bay meteorology. More info at Ken Stewarts site. | ©2019 Google. Image Capture Mar 2010.
40% of our man-made warming was in the last eight (flat) years?
Suddenly in the 2022 report the experts are saying Australia has warmed by 1.5°C since 1910. But in 2014 the very same experts said “Australia’s climate has warmed by 0.9°C since 1910”. So the BoM says we are 0.6 degrees warmer now than in 2014 and 40% of our entire century long trend happened in the last eight years. We know the science is settled and all, but according to the satellites Australia is the same temperature now as it was in 2014? (Still, it’s a bit unfair to think all the warming occurred after 2014. With the power of expert adjustments it’s quite possible in the last eight years the 1910’s got colder too. The poor sods of World War I! More frosts than they ever realized…)
This seems a good point to remember those historic heatwaves.
Historic heatwaves. 50 degree temperatures were everywhere, right across Australia in the 1800s and 1900s.|
Oops. The pace of warming has slowed, not sped up
The full satellite record shows Australia has warmed in the last 43 years, but the rate of warming has slowed since 2007 (draw a line with your mind’s eye). Rather than accelerate, as all the Chinese emissions of CO2 filled the sky, the warming in Australia slowed down.
Not what the models predicted. Not accelerating. Not apparently affected by extra CO2.
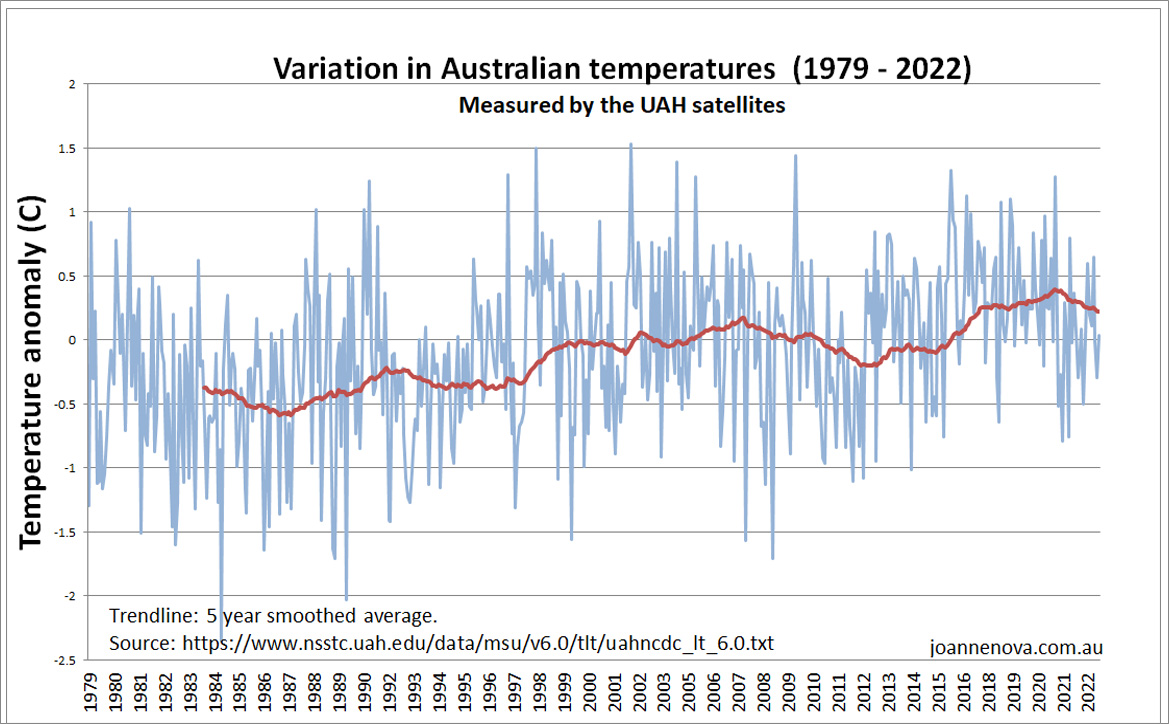
Australian temperature variation as measured by UAH satellites. (1979 – 2022)
Something else, or several other things, are driving our climate and the modelers don’t know what they are.
Finally, here’s a flashback just to remind us of why the UAH satellite system really is the best record of temperatures.
Five reasons UAH is different (better) to the RSS global temperature estimates
-
- UAH agrees with millions of calibrated weather balloons released around the world. RSS now agrees more with surface data from equipment placed near airports, concrete, air-conditioners and which is itself wildly adjusted.
- In the latest adjustments UAH uses empirical comparisons from satellites that aren’t affected by diurnal drift to estimate the errors of those that are. RSS starts with model estimates instead.
- Two particular satellites disagree with each other (NOAA-14 and 15). The UAH team remove the one they think is incorrect. RSS keeps both inconsistent measurements.
- Diurnal drift probably created artificial warming in the RSS set prior to 2002, but created artificial cooling after that. The new version of RSS keeps the warming error before 2002, but fixes the error after then. The upshot is a warmer overall trend.
- UAH uses a more advanced method with three channels. RSS is still using the original method Roy Spencer and John Christy developed with only one channel (which is viewed from three angles).
Lastly The CSIRO budget is $1.2 billion a year and the BOM’s is $300 m. Why is it left to unfunded volunteers to provide the full story?
Hat tip to Neville, RickWill, b.nice. But also thanks to Ken Stewart, Chris Gillham, Lance Pidgeon and all the BOM Audit team.
REFERENCES
Deacon, E.L. (1952) Climatic Change in Australia since 1880, Australian Journal of Physics, Volume 6, Pages 209-218. [PDF]
State of the Climate 2022, Bureau of Meteorology
State of the Climate 2022, CSIRO
State of the Climate Report CSIRO 2014. CSIRO
Previous State of the Climate Reports, CSIRO
And even more droughts and trends graphs here.
Mauna Loa CO2 levels: https://gml.noaa.gov/webdata/ccgg/trends/co2/co2_annmean_mlo.txt
UAH Data: https://www.nsstc.uah.edu/data/msu/v6.0/tlt/uahncdc_lt_6.0.txt


They have told such a complex web of lies that they have to keep telling ever more lies and fabricating or deleting even more data to cover up the previous lies plus keep the narrative going.
And the secret algorithm? If it’s not published, it’s not science. By definition.
And there was nothing wrong with pre-1910 data which was simply stricken from the record.
710
I recall the BOM commission hearing, where the investigators asked how the homogenisation process was implemented. It’s telling that they had to go to talk to a specified individual, not review the answers in documentation. Surely any quality process must be fully documented and available for review at any time.
250
Graeme,
Yes.
The adjustments must be authorised – under a general authorisation [documented];
and then specifically authorised [again documented], although perhaps at a lower level than the general authorisation.
As you note – this must be documented.
It must be available for review. As you note.
With record kept for a documented interval [Weather – surely at least 30 years; climate – well …..
[Personally, I would expect ALL records – original, and justification for adjustments] to be kept forever for climate. YMMV.]
And identification of those who approve adjustments, variation, homogenising, etc.
I have only audited weather observations on ships [part of internal audit] – but I would expect a lot traceability than appears at the moment.
As you do, too, I understand.
Auto
[Retired ISO 9001/2 Lead Assessor].
30
Arrrgh The BoM. Broad caster from this dept. claimed that even though we are currently undergoing a flood cycle in Victoria both Autumn and Winter were actually drier than average and that this “lack of rainfall” was an ongoing trend of Australia “drying”. No reference to history, no reference to annual rain fall totals which strangely, in my district, are higher than the long term average. No No No just believe the BoM. Australia as we know it is doomed.
550
Pure newspeak.
240
Tragically, of that, I have little doubt.
The Chicomms are salivating at the prospect that within probably no more than three decades they will march right in meeting no resistance.
For the present, they will continue to sponsor and promote climate hysteria among useful idiots of the Left throughout the West, and, continue to make vast amounts of money selling to Western billionaires solar and wind subsidy-harvesting equipment.
The traitors in the West will one day be given China’s International Science and Technology Cooperation Award 国际科学技术合作奖 .
362
Better start learning Chinese pronouns!
140
The spoken Mandarin word for he and she is the same, but the written characters are different. It’s definitely not a woke language. The character for “good” is symbolized by a mother holding a baby.
90
As Jo says Sambar:
And if you do find the evidence of natural cycles then the best time to release it under the current censorious green-left regime is when you’re retired and they can’t destroy your career.
In today’s “The Australian” we see a very telling letter from Prof Michael Asten (Geophysics; retired) who tells the readers that:
The CSIRO-BoM State of the Climate Report 2022 is lacking in recognition of a documented approximate 80-year cycle in rainfall and floods in southeastern Australia. The cycle is especially prominent in flood records of the Hawkesbury River and in related publications by Infrastructure NSW. It is an unfortunate omission that the CSIRO-BoM Report discusses an observed decline in rainfall since the mid and late 20th century, but fails to recognise that the observed 80-year cycle places their starting point during a flood dominant time, followed by recent decades being drought dominated.
https://www.theaustralian.com.au/digitalprinteditions
25 November 2022. Letters. Page 12.
You’ll not see that level of openness on their left-wing ABC or in their other rubbish printed media.
Another reason to subscribe to the Oz.
120
Don’t know who to attribute this comment
I followed the science to no avail so I followed the money and I found the scientists
100
That would be most of us probably.
00
From the ‘Ya gotta hand it to the buggers dept’.
In a neat nexus of nonsense, I read today that a potential explanation for the recent surge in excess deaths in Europe is … (cue drumroll)
Climate change!
Apparently, more than 20,000 excess deaths in Europe were due to the “hottest summer on record”. An expert (yeah, right) said, “Heatwaves are becoming more frequent and intense as the globe warms up, so we can expect more and hotter heatwaves in future. Scientists have linked many past heatwaves to human-induced climate change.”
So there we have it. The climate apocalypse is real and the vaccine is safe. Journalist of the century award?
https://www.dailymail.co.uk/sciencetech/article-11466325/More-20-000-excess-deaths-recorded-Western-Europe-summers-heatwaves.html
250
I would like to know what the ‘experts’ were saying at the start of the little ice age
60
So how come all those soccer players and fans travelling to the World Cup from Europe didn’t die “excess deaths” immediately on arrival?
140
How come they didn’t die? Coz someone planted a tree somewhere and Gaia was placated. Fossil fuel-free football – fantastica! ⚽️
The wackiest thing CCC causes? An expert on Te Radio NZ claimed ‘pot-holes’ in our roads & highways were now the result of our out-of-control carbon destruction of planet Earth… because… it rains, sometimes quite heavily. No mention of the lack of maintenance on said roads, or their D-minus construction in the first place.
The Climate Zombies are among us ⚠️
180
There’s a lot going on here and I’ll be following comments this morning.
People need the truth and our government is not being up front with us . .
221
And Australia’s present Federal Government is even less committed to the truth than the previous one.
And as we freeze in most parts of Australia in November, I can’t wait to hear of “The Bureau’s” pronouncement of it being one of the “hottest months evvveeerrr”, if not the hottest.
310
Hottest November this year!
190
The Report says there will be longer periods of drought on average in the south and east, also a longer fire season for the south and east, and an increase in the number of dangerous fire weather days.
This is pseudo science.
In reality the opposite is more likely, La Nina like conditions should banish drought and bushfires.
60
Remember the 2009 fires towards the end of the drought. Then came La nina for a couple of years and some wonderful water asisted, if uncontrolled, growth in vegetation. Then 2019/20 bushfires, enhanced by masses of drought dried fuel. If this pattern happens after this La nina will you retract this?
610
I will not.
In the decade ahead I see La Nina like conditions and Modoki El Nino, which as you well know means a wetter Australia.
Also, the 2019/20 bushfire season was exacerbated by a blocking high pressure system out of place for that time of year. BoM doesn’t mention it.
80
So it wont happen again for a long time? Noted.
23
Modoki is similar but different.
‘Most interestingly, the Modoki and non-Modoki El Niño events exhibit a marked difference in rainfall impact over Australia: while classical El Niños are associated with a significant reduction in rainfall over northeastern and southeastern Australia, Modoki events appear to drive a large-scale decrease in rainfall over northwestern and northern Australia.’ (Taschetto & England 2009)
20
This is fascinating, they can forecast Modoki El Nino 10 years in advance.
https://www.nature.com/articles/s41598-021-97111-y
10
One final point.
‘At centennial scales, high rainfall characterised the Little Ice Age (~1450–1850 CE) in subtropical eastern Australia, contrasting with oceanic proxies that suggest El Niño-like conditions prevail during this period.’ (Barr et al 2018)
I hypothesise that we are looking at Modoki El Nino during the LIA.
30
The CSIRO/BoM climate cabal relies heavily on the output of models so it’s worth seeing how well its models perform.
Dr Roy Spencer gives a good indication in 50-Year U.S. Summer Temperature Trends: ALL 36 Climate Models Are Too Warm where he discusses the trends in climate model output when predicting trends in US surface air temperatures for 1973-2022.
He includes two CSIRO models, ACCESS-CM2 and and ACCESS-ESM1-5. The output from the first gives a trend of about +0.505 deg C/decade, the second, close to +0.58 deg C/decade.
What was the trend calculated from temperature observations collated by NOAA? Just +0.26 C/decade.
The trend from one CSIRO model is just short of 100% too high and the other more than 100% too high.
280
UAH shows a clear warming trend. It is an irradiance proxy of tropospheric temperature. Thermometers measure surface temperature. They show an even stronger warming trend. Thermometer sites are strongly cross-correlated, so detection and removal and/or adjustment of erroneous data is straightforward. Multiple different homogenisation techniques yield the same results, which prove that the algorithms are reliable.
461
Where can we find this “homogenisation” algorithm and why is it necessary?
And without a time machine, how do you tell if historical data is erroneous and then generate a new supposedly more accurate measurement?
420
So reliable that we proles need not worry our pretty little heads by being allowed to look at them, right?
280
Simon,
Sure, satellites measure a band of air above the surface, and all the GCMs tell us that the air above the surface will warm even faster than the surface does (remember the hotspot), yet we see the opposite?
UAH is probably exaggerating the warming trend…
170
No, the troposphere is expected to warm at about the same rate, with the tropopause (the top of the troposphere) increasing in height. And that is exactly what is happening, at the rate of 50 meters per decade: https://www.science.org/doi/10.1126/sciadv.abi8065
Remember too that the troposphere is more affected by ENSO and there is more annual variation, which makes it easier to cherry-pick a non-trend.
418
Doh Simon, we are not talking about the height of the tropopause, we’re talking about the warming profile and you are 100% completely wrong. See here — from the IPCC itself. At every altitude above the ground from 1000hPa up to 100hPa the models predict the temperature trends (K) are positive and larger than at the surface.
See this post for details and references. https://joannenova.com.au/2013/04/ipcc-plays-hot-spot-hidey-games-in-ar5-denies-28-million-weather-balloons-work-properly/
The true surface warming trend is supposed to be smaller than what the radiosondes and satellites find. But the BoM artifically amplifies that to get headlines and records on the ground. That blows away their ratios from the upper trop to the surface though.
The warming is supposed to be fastest from GHG at 200hPa. It is supposed to warm there quicker than the surface. John Christy even came up with a scaling ratio between warming up high and the surface, and published papers on that ratio.
160
And in 2015, two separate papers determined that the tropospheric hotspot exists:
https://atmos.uw.edu/~qfu/Publications/jtech.pochedley.2015.pdf
https://iopscience.iop.org/article/10.1088/1748-9326/10/5/054007
You really need to come up with some new memes.
217
LOL
“To remove diurnal drift from TMTmeasurements, the RSS team uses the diurnal cycle simulated from five years of model simulation”
“Because it is possible that GCM-derived diurnal cycle corrections have biases, we develop a regression technique to derive a TMT diurnal cycle correction based”
ie they tweaked their climate models to fabricate the hot spot. !
And Sherwood.. used modeled wind shear to fabricate the hot spot.. That paper was debunked ages ago as a statistical farce.
The Connolly Father and son duo analyzed some 2 million sets of balloon data.. no hot spot exists .. period. !
Simon, a source of mirth.. as always !!
130
Simon links to Sherwood and Nishant (2015)
Maybe search the JoNova site with “Sherwood” first ?
40
Thanks Richard and b.nice. Exactly. Read this post of mine Simon?
https://joannenova.com.au/2015/05/desperation-who-needs-thermometers-sherwood-finds-missing-hot-spot-with-homogenized-wind-data/
The idea that Sherwood would throw away the temperature data and then use wind shear to “tell the temperature” better than the temperature sensors shows how desperate and delusional they are, and yes, we mocked that concept many times here.
Po Chedley published another paper just last week still trying to find the hot spot. I guess he forgot he definitively found it 7 years ago… or maybe he knows more than Simon, and realizes it is still missing?
https://tallbloke.wordpress.com/2022/11/24/new-analysis-attempts-to-reconcile-differences-between-satellites-and-climate-models/
Just natural variability. What bad luck!
30
Did you miss the photos above that show where the erroneous data comes from?
I looked up my local BOM site 023733 in Mount Barker, SA and found it in the front yard of a suburban house, well shaded and wind protected, tucked away in a corner next to a brick house and a timber fence.
I cannot find how to add my own images to this comment or I would have added the Google street photo (-35.0732, 138.8466)
170
And it was close to the air conditioner outlet 2 years ago when viewed.
Even the locals have noticed the big difference between what the BOM forecasts and reality. In fact the TV weather forecasts include Mt. Barker but the actual result doesn’t appear next day and is replaced by one from Mt.Lofty. (Except Ch10 which labels it as Mt.B even though the figures are the same as those given for Mt.Lofty. Even the thermometer in my car or the one outside under a bush is more accurate.
I’ve mentioned before chat with cash taker who was looking forward to next day off. I said the BOM is predicting fine sunny weather, as she came back with “I’d better pack my brolly”.
160
John, indeed I believe we have the photo you are looking for of Mt Barker. It is the site that kicked off the big Ken Stewart investigation into Australian BoM site compliance…
https://joannenova.com.au/2019/07/mt-barker-how-not-to-measure-the-temperature/
120
Simon plays the slick trick. Global warming is defined as an increase in surface temperature (look it up). UAH does not measure surface temperature so it does not count.
The surface statistics are junk even without all the warmth increasing fiddling. First it is a convenience sample, not a random one, so no statistical inference can be drawn about the overall population of temperatures. (Look up convenience sample.) Then second the method of area averaging violates the laws of statistical sampling because different thermometers have different weights. Then we get to a raft of things like inaccuracy, heat contamination, the nonsense of homogenization, etc. It is pure junk.
511
Well said, David.
130
David,
Simon is in training to be a mosquito – requiring an annoying sound and very, very small brain. I think he may be over qualified.
231
David >”Global warming is defined as an increase in surface temperature (look it up)”
I’ll bite. The increase in surface temperature is a secondary effect according to the IPCC, primary is the radiative balance at TOA which “controls the Earth’s surface temperature” apparently:
This is of course a contrived IPCC theory paradigm falsified by the fact that the measured TOA imbalance does not comport with the IPCC CO2-forced climate models TOA imbalance.
And neither does modeled surface temperature track observed after removal of cycles, ENSO i.e. natural variation.
In other words, the theory is busted.
110
>”the measured TOA imbalance does not comport with the IPCC CO2-forced climate models TOA imbalance”
IPCC science:
The global energy balance as represented in CMIP6 climate models – Martin Wild
https://www.researchgate.net/figure/Global-annual-mean-energy-imbalance-at-the-TOA-upper-panel-and-at-the-Earths-surface_fig11_341638531
Figure 11: Top Of Atmosphere Imbalance, Surface Imbalance
https://www.researchgate.net/figure/Global-annual-mean-energy-imbalance-at-the-TOA-upper-panel-and-at-the-Earths-surface_fig11_341638531
12 out of 36 on the money but don’t be deceived by an annual mean study – time series is what reveals the deficiency of the models (see next comment)
70
>”time series is what reveals the deficiency of the models”
No Consensus: Earth’s Top of Atmosphere Energy Imbalance in CMIP5-Archived (IPCC AR5) Climate Models – Bob Tisdale
https://wattsupwiththat.com/2015/08/11/no-consensus-earths-top-of-atmosphere-energy-imbalance-in-cmip5-archived-ipcc-ar5-climate-models/
Tisdale:
Meanwhile, the IPCC charade marches on.
80
Simon >”Thermometer sites are strongly cross-correlated”
Well yes, they are. Joanne explained why:
Hence the “cross-correlation” obviously – BOM’s circular methodology.
210
Do you ‘work’ for the ‘BOM’ or ‘CSIRO’ perchance. Or, are you really Simple Simon who met the Pie Man while going to the Fair?
150
Nah, his real name is Dunning Kruger.
41
Simon
When Jo submits this kraken for peer review, the scientific community will see the light.
31
Wrong AGAIN, Simon.
UAH shows warming ONLY at non-CO2 caused El Ninos.
For 39 of the 43 years.. THERE IS ZERO TREND
92
“Multiple different homogenisation techniques”
lol.. now that funny !! 🙂
All designed to homongenise rural non-warming stations to very urban affected “UNFIT FOR PURPOSE” sites.
At best , urban areas and airports take up a TINY proportion of land area, but , while they were once 40% of the global “fabrication,….
…. airports now make up 75% of the surface fabrication. !
The surface data measures air traffic at airports , and air-conditioners and tarmac in urban areas.
It is totally meaningless and any measure of global temperature.
91
There is only one pristine surface data set in the world, and that is USCRN.
UAH TLT is a very close trend match to this pristine data set.
This verifies that UAH temperature trend are far more accurate as a measurement of surface data than the sparse, heavily urban and airport effected fabrications.
80
Here is the data of number of GHCN sites , showing the massive decrease in sites used (almost all the loss from rural areas and remote sites in cold regions)
Note the almost doubling of the influence of urban sites at a time when air travel was massively increasing and jet airplanes becoming more and more powerful.
https://meteolcd.files.wordpress.com/2017/05/weather_stations_at_airports.jpg
90
However, thermometers do not directly measure the Global Surface Temperature. NASA GST claim that the temperature of the GST at any time is a fact, but in fact it is merely a modelled temperature calculated using non-statistical methods.
60
Actually Simon, the thermometers are sited around 1.2 metres above the ground and are measuring temperatures at the bottom of the atmosphere, not at the Earth’s surface.
80
‘Something else, or several other things, are driving our climate …’
Two main things that alter climate, energy from the sun and heat from the bowels of the earth, and the oceanic oscillations move the energy around.
This recent paper points to our variable star as the main driver over eons of time.
https://www.swsc-journal.org/articles/swsc/full_html/2021/01/swsc200108/swsc200108.html
140
I do not know about eons but on the decade to century scale nothing needs to drive climate change. Climate is average weather. Weather is chaotic. In chaotic systems the averages constantly change (they oscillate just like the weather being averaged). Successive days, weeks, months, years, decades and centuries vary. Hot v cold, wet v dry, windy v not, cloudy v not, and so on for all weather parameters. There are no constant averages at any scale.
201
Weather appears chaotic, but there is orderliness and BoM can forecast a week ahead.
Over decadal time scales we can see the large oceanic oscillations dancing to a harmonic rhythm which determines future weather. There is much we don’t know, why did Antartica and Southern Ocean begin to cool after the Great Climate Shift of 1976?
50
. . . and BoM can forecast a week ahead.
Nah I don’t think so. If you have tried the exercise to look at their 7th forecast day and notice the change in forecast as that day gets closer to today you can see how erroneous the forecast was originally. Their 7 forecast is a joke.
90
Bom’s seasonal forecast is woeful and they are very slow to forecast ENSO, but Weatherzone isn’t.
‘Further into the future, this outlook suggests that El Niño becomes the most likely state for the Pacific Ocean late in the Southern Hemisphere’s winter in 2023. This is the first time in around three years that the monthly CPC/IRI outlook has favoured El Niño as the most likely category in the Pacific Ocean.
‘It is important to point out that the U.S. CPC and IRI use slightly more relaxed threshold than Australia’s Bureau of Meteorology for identifying La Niña and El Niño.’
40
There is also this caveat –
“Also worth highlighting is that this outlook becomes less reliable the further it looks into the future, so predictions for the middle of next year should be treated with some caution. More reliable ENSO outlooks will become available early to mid-next year.”
40
…. But trust us, we know exactly what the global temperature will be in 100 years time unless you sell your car and stop eating meat.
50
el gordo re ‘Changes in the Total Solar Irradiance and climatic effects’ – Schmutz (2021)
6 Conclusions:
The IPCC dismiss this “science community” out of hand. A 6 W.m2 LIA – Modern Warm Period difference just cannot be entertained.
I put this to Mike Lockwood in respect to the IPCC’s preferred paper Jones Lockwood and Stott (2012) where they only look at least-case solar scenarios (see Fig 1: 0.96, 1.26, 2.55 LIA – MWP):
What influence will future solar activity changes over the 21st century have on projected global near-surface temperature changes?
https://agupubs.onlinelibrary.wiley.com/doi/full/10.1029/2011JD017013
Lockwood said he “didn’t understand their methodology”.
Note that at time of writing JL&S12 their projections were already well above observations (see Fig 5).
50
Lockwood has little confidence in the solar theory.
‘Even in the event of the Sun entering a new Maunder Minimum like activity state the climate response is very small compared to the projected warming due to anthropogenic influences (the probability of this within the next 40 years has been estimated to be 8% by Lockwood [2010].’
30
Lockwood >”the climate response [to Maunder-like] is very small compared to the projected warming due to anthropogenic influences”
The problem with that is that his study’s “projections” were junk at the time of writing as I noted previously (and see Fig 5 of JL$S12 previous).
If their projections were junk in 2012 then there’s zero credibility for their projections to 2100.
Re the probability of Maunder conditions actually occurring sure, plenty disagree and Lockwood only gives 8% but at least he has the solar-centric papers to back up his reasoning. Usually there are bland statements with a paucity of scientific study.
Zharkova, Landscheidt (deceased) and Abdussamatov are/were stridently warning of Maunder conditions with the science to back it up.
Example of bland statement in that article linked:
Time will tell. I’m inclined to think cooling is now underway beginning with the Southern Hemisphere.
30
Why does the BoM even pretend to do temperature measurements at all?
Isn’t actual measurement of environmental parameter oh so 20th century?
Today, you can just produce all the data you need with “models” that are finely tuned to produce whatever answer the Elites require.
You don’t even have to look out the window.
/sarc
280
“You don’t even have to look out the window.”
You’d probably get sin binned for doing that – maybe excusable if you reported that the window agreed with the forecast
50
They’re not permitted to gaze out the window in the mornings, because that would leave them with nothing to do in the afternoons.
50
The real question that needs answering is why, with all their funding, if they really wanted to measure the temperature properly…..
… why haven’t they set up a system similar to USCRN ?
40
I wonder if anyone from Their BoM reads this?
And are they ashamed or proud of their widespread alteration and deletion of scientific data, deception and invalid models, that have cost the country countless billions in massively increased electricity costs, destruction of industry, unused desal plants and floods due to no new flood mitigation measures because it was claimed it was hardly ever going to rain again?
Are you proud?
Frankly, I think you should all follow the example of Marcus Brutus.
230
One of my eldest son’s former schoolmates is a ‘forecaster’ at the Barrel Of Monkeys (BOM). My son, who has the same commonsense approach to the pseudoscience of climate change as most of those here, was, for a while, engaged in a very lively online discussion with this pompous loser, until finally, my son was ‘blocked’ as they say. Blocking now appears to be the last refuge of scoundrels.
100
I’m not sure that blocking/cancelling/firing/disappearing is the “last refuge these days, but their instinctive first reaction to the merest hint of contrary opinions. They’re even proactive in some cases, banning people before they even open their mouths, simply because they’re known to be conservatives or just logical, fact-based thinkers.
70
It’s such a surprise to learn that, when produced by an industry that depends on warming for its funding, every single miscalculation, error and mistake goes in the same way – exaggerating the warming. Surely, even if one accepts that models are estimates based on incomplete understanding, it would be reasonable to expect that the errors would be equally distributed both above AND BELOW the observed data?
240
There’s nothing dangerous about our global or regional climate today. Just look up the data.
In fact we’re living in the best of times for Humans and that’s why we’ve added another 7 billion of us since 1810 and everyone of us now live much healthier and wealthier lives because of the Industrial REV.
2000 years ago there were under 200 million global population and this increased to 1 billion by 1810.
In 2022 we’ve now reached 8 billion and this may increase to 10.3 billion before 2100.
But the rate of global pop increase has been falling since 1963 and many types of data to check out at the OWI Data link.
https://ourworldindata.org/world-population-growth#how-has-world-population-growth-changed-over-time
161
It’s not YOU, it’s not CO2…it’s the Sun.
90
Remember they’re not the BOM, they’re “The Bureau” now, like in the USSR.
150
Bureau: Desk, Writing table, Secretaire. All wooden.
100
So’s two planks.
40
But the planks are useful, as are those items of furniture
30
They still us the term ‘BOM’ and ‘BOM Weather’ on their website. So maybe they should use some of the $300m a year to update their website. As well as go get better weather forecasters…………………
90
When you work with corrupted data, adjusted data, modelled data in the absense of the raw data, it should come as no surprise that the BoM’s forecasters BoM out every time. GIGO.
30
Using anomaly as a base for determining changes in any natural phenomena is just junk science. Change your base of comparative period and all the trends change. Using 1910 as the earliest observation date is junk science. There ‘s perfectly sound data from many locations prior to 1910. Robust data from many lighthouses is available which often dates back to 1850’s and is also relatively free from adverse Urban Heat Island effects.
80
Cleaving Beginning? – Climate Change Policy Makes Europe Too Expensive for Low-Cost EV Manufacturing
November 24, 2022 – sundance
We have been closely monitoring the signs of a global cleaving around the energy sector taking place.
Essentially, western governments’ following the “Build Back Better” climate change agenda which stops using coal, oil and gas to power their economic engine, while the rest of the growing economic world continues using the more efficient and traditional forms of energy to power their economies.
Within the BBB western group (identified on map in yellow), the logical consequences are increased living costs for those who live in the BBB zone, and increased prices for goods manufactured in the BBB zone. In the zone where traditional low-cost energy resources continue to be developed (grey on map), we would expect to see a lower cost of living and lower costs to create goods. Two divergent economic zones based on two different energy systems.
This potential outcome just seemed to track with the logical conclusion. The yellow zone also represented by the World Economic Forum, and the gray zone also represented by an expanding BRICS alliance. Against this predictable backdrop we have been watching various events unfold, some obvious and some less so.
Today, we get an obvious example:
NEW DELHI, Nov 24 (Reuters) – Fiat parent Stellantis (STLA.MI) has concluded it can’t currently make affordable electric vehicles (EVs) in Europe and is looking at lower-cost manufacturing in markets such as India, its chief executive told reporters.
If India, with its low-cost supplier base, is able to meet the company’s quality and cost targets by the end of 2023, it could open the door to exporting EVs to other markets, said Carlos Tavares, CEO of the group whose brands also include Peugeot and Chrysler.
“So far, Europe is unable to make affordable EVs. So the big opportunity for India would be to be able to sell EV compact cars at an affordable price, protecting profitability,” Tavares told reporters at a media roundtable in India late on Wednesday.
Stellantis is investing heavily in EVs and plans to produce dozens in the coming decade, but Tavares warned last month that affordable battery EVs were between five and six years away.
On his first visit to India since taking over as Stellantis CEO, he said the company was still working out a plan regarding EV exports from the country and had not yet taken any decisions. (read more)
100
Dyson of vacuum cleaner fame gave up trying to develop electric cars recently. He gave it a good go, investing a lot of money. His conclusion was that it was too difficult to make profits. The only reason that Tesla is successful is via government subsidies. Plus now, old mate Elon is too big to fail. It also helps with any new tech or developer to be the first. Later entry participants in most new tech are rarely successful.
100
I would simply like to know why it was hotter when the Dinosaurs were alive and why we had Ice Ages and what caused all of these climatic swings? Can’t be Human Industrial activity as that was not around then.
Seems to me that we are all living in a sweet spot, for whatever reason. And it is far cheaper and easier to just do what Mother Nature does. And that is to just adapt and get on with Life.
140
My normal question to Greenies in OZ is,
The Dinosaur Stampede at Dinosaur Stampede National Monument at Lark Quarry Conservation Park
110 km (68 mi) south-west of the western Queensland town of Winton.
I ask them there are no Dinosaurs now?, what happened? – the Climate changed and NO Humans were involved
100
YES, the climate has always been changing, a gold thumb for you.
Did you listen to the scientists when they described how the current rate of change can only be explained by human activity ?, you dismiss them ?, we’ll submit a proper paper for review, cause that’s how.
20
The National Library of Australia has a photo – “Rabbits died in large numbers due to lack of water and feed – Cockburn Railway, SA, 1892”
Now we all know rabbits are tough customers and I’ve never seen any photographic evidence that anything like this drought and heat of the “Federation Drought” has been replicated – the bunnies survived myxomatosis and calisivirus better than they fared in 1891 to 1903.
When are people going to wake up ?
It seems the inevitability of un-affordable energy and food etc aren’t enough to scare them out of their idiotic belief there is a climate crisis – I despair for the gullibles !
150
Energy policy: where parallel universes are set to collide
Rafe Champion
There are parallel universes in energy policy and they are about to collide.
In one universe, the governments of Australia and most of the Western world are committed to the flight from coal to renewable energy. In the other, we have already gone as far as we can go in that direction with existing storage technology.
The combination of wind droughts and the lack of feasible grid-scale battery storage makes the green energy transition impossible for the time being, despite what we are told.
Several times a year, there are periods with next to no wind across the whole of south-eastern Australia (the National Energy Market).
These ‘wind droughts’ can be described as icebergs in the path of the RE Titanic.
Very few people pay close attention to the wind apart from cyclists, sailors, and spin bowlers.
For many years, dedicated wind-watchers have sounded a warning about these ‘icebergs’, but the captain and passengers on the RE Titanic remain blissfully unaware of the approaching calamity.
The supply of wind is critical for wind power in the way that the water supply is required for irrigation, but the wind power industry has apparently been built without properly contemplating the impact of these wind droughts.
People have developed a false sense of security because when Australia had more than enough conventional power from coal and gas to back up the renewables grid, it did not matter whether the sun shone or the wind blew.
However, over the last two decades a large number of coal power stations have closed in south-eastern Australia, while most of those that remain are approaching the end of their working lives. Then there is Liddell in NSW, which is being phased out.
We have reached a critical tipping point.
If we lose more fossil fuel capacity from the grid, Australia’s power supply will fail every time there is not enough wind or solar power available to meet the peak demands at breakfast and dinnertime. The records show quite clearly that these renewable energy droughts happen often and there will not be enough power.
Consequently, when the next coal power station closes, every wind drought will threaten the power supply integrity and prolonged wind droughts will be potentially catastrophic.
If the coal capacity is not maintained, then more gas will have to be burned at a crippling cost.
The official response is to accelerate the roll-out of windmills and solar panels but these make no contribution to the grid on windless nights.
Building more capacity does not help any more than having a big petrol tank in a car helps when it is empty. You can’t capture what isn’t there.
This would appear to be stating the obvious, but it seems to have been neglected in planning the electricity system that we have today.
90
THE DARK SIDE OF “RENEWABLE” ENERGY – 15 Page PDF
• Environment Destruction, Toxic Technology, Toxic Waste
• Inefficient Technology, Outdated Technology
• Solar Farms, Wind Farms, Batteries – Who Benefits? Who Pays?
ABSTRACT
The stated premise for the reduction in the man-made production of CO2, by the “anthropogenic climate change” believers, is to
prevent an existential threat to human civilization and the environment.
If this is the case, it is therefore critically important to consider the impact on human civilisation and the environment
caused by wind farms, solar farms and batteries.
70
The Menzies Research Institute is hosting a webinar forum on the protests from rural communities faced with the wreck and ruin inflicted by wind and solar factories and the transmission lines associated with them.
Register here. The date is 15 December at 6.00 Sydney time.
30
Okay, am I missing something here?
Every morning, I check in with Ed, the owner of my ‘home site’, and he lives in Harrisburg Pennsylvania. He replies an hour or so later, and there’s a fifteen hour time difference.
As one part of that checking in, we tell each other our local weather. Occasionally I will also send him an image from the local Weather Radar, Mt Stapylton, which is line of site just two kilometres from my front balcony, the ‘golf ball on the hill’.
I use the Weather Zone site for my daily weather report, and it’s set to Beenleigh, and even though that’s not where the weather is ‘done’, my local weather site is located at Redland, and here’s the anomaly I have been watching, and you might even think that this is totally unrelated.
Okay, here’s the link to my weather site.
When the site opens, what I want you to look at here, you’ll have to scroll down to see.
It’s the fourth data set down, and the title is (the default) ….. Recent Trends.
Look at the top right set of records ….. Last 12 Months – Temperature for Logan City, that huge Southern suburb of Brisbane, and where I live, Beenleigh, is part of Logan City.
This shows the temperature records for Logan for the last 12 Months. The light orange colour is the long term average, and the darker orange is for the Month of this past 12 Months year, and when you hover your mouse over the orange colours, the data shows for that Month.
Now, in the last 12 Months here in Logan, the (current) Monthly Average High shows eleven of the twelve Months LOWER than the long term average.
If it’s supposedly getting ‘warmer’, (or hotter, or dangerously hotter, or catastrophically hotter) then this shows the opposite really.
I mean, seriously, this could probably even be discounted, as it’s not the definitive BOM records, eh, but if it was supposed to getting hotter, then eleven of the twelve Months would be hotter ….. not cooler, eh!
Umm, just sayin!
Oh, and seven of the last twelve Months have had higher rainfall also.
Tony.
210
Been seeing the same here in my neck of the woods in Mogadishu-by-the-Yarra. Boggles the mind how the real data and what’s reported from the computer models differ.
70
But most people live on land in the Northen Hemisphere and the temperature there in January is increasing at an incredible rate.
This plot shows how fast the minimums are increasing – from almost MINUS 30C in 1950 and now approaching MINUS 20C.
https://i0.wp.com/wattsupwiththat.com/wp-content/uploads/2022/11/Screen-Shot-2022-11-17-at-9.35.21-am-1669325989.1403.png?fit=785%2C321&ssl=1
The January average for all land north of 40N has gone from -15C to -12C in the last 70 years. On AVERAGE the globe is warming up. Mostly in winter in the Northern Hemisphere.
You might think that warmer winters are a good thing but the reason they are warmer is due to more snow.
50
How do they calculate the “average” temperature for Australia?
Asking for a friend.
50
It depends on the they.
46
Phil they start with about 100 top ACORN sites, then do homogenizing which involved hundreds of other thermometers up to 1,500 kilometers away, and then they do weighted area averaging. Also because a lot of sites didn’t have thermometers back in 1910 they have to allow for a network that was sparse and changing. Screens would start new, then get neglected, urbanized and move to new sites. They also shrank from large white boxes to smaller ones in the 1990s and became electronic AWS systems. In theory there is a two year overlap (supposedly) when site changes happen but it’s impossible to get that calibration data. Indeed, when we ask the BOM for that raw data of two thermometers side by side so we could see what effect the shift to AWS had, they admitted that they deleted it.
They will not publish their full methodology of homogenisation. They will not explain exactly how they choose which magic combination of surrounding thermometers gets used one year and a different set gets used the next. No outside observer can replicate their method. It’s sacred guild stuff, not science.
However bad you think the BOM is, it’s far far worse…
180
This paper gives a reasonable explanation: https://rmets.onlinelibrary.wiley.com/doi/full/10.1002/gdj3.95
as does this technical report: http://www.bom.gov.au/research/publications/researchreports/BRR-032.pdf
211
Not reasonable enough to replicate the BoM homogenization.
If it can’t be replicated, it isn’t science.
150
absolute rubbish jo, the data is there in its unadjusted form, and available for download, the methods are there for anyone to use. The methods have also been approved by the WMO. but the answers, they do not fit your narrative now do they?
37
You are the one speaking rubbish.
Another BOM scandal: Australian climate data is being destroyed as routine practice
BOM admits it will not train anyone outside the BOM on how to homogenize. Read the quotes here.
UPDATE: Use this link — https://joannenova.com.au/2015/06/if-it-cant-be-replicated-it-isnt-science-bom-admits-temperature-adjustments-are-secret/
If only you read my site Peter?
80
Why do you need training when you can just read the paper or the technical manuals? If you don’t like the BoM methodology, you can always use someone else’s homogenisation techniques. The WMO has conferences on this stuff, it’s well understood science. https://community.wmo.int/climate-data-homogenization
The problem is that no-one if the ‘skeptical’ community has the statistics skills to interpret it properly.
35
The WMO is great to pushing the global warming scam.. a major part of it.
Homogenisation is their method of doing so.
All past records are cooled, everywhere, by every one of these fudging methods.
Again since you don’t seem to be determined not to comprehend.
.. the global surface temperature constructions are based mostly on URBAN and AIRPORT data.
They are not representative of the global temperature
40
” the data is there in its unadjusted form”
… and mostly it doesn’t show any warming except when affected by urbanisation. !
It is the homogenisation process using urban-affected references that creates the artificial warming.
30
“The problem is that no-one if the ‘skeptical’ community has the statistics skills to interpret it properly.”
LOL..
They are the ones finding all the fake statistics in the farcical BoM data manipulation and other climate nonsense.
They understand statistics far more than most of the BoM clowns.
The “alarmist” cult know so little about real statistics that they have to make up fake methodologies to try to justify their junk science.
But they invariably get caught out by people who do actually understand statistics.
30
The BOM is so smart only they can ultimately be privvy to why certain sites were included on any adjustment. This is magical science. It can’t be replicated. They won’t publish the methods in enough detail for anyone to follow. Probably because they sit around a table saying things like “what if we use Bourke to adjust Alice in 1923″ do we get the right answer?”
https://joannenova.com.au/2015/06/if-it-cant-be-replicated-it-isnt-science-bom-admits-temperature-adjustments-are-secret/
Here is the statement that no one can replicate them because only the BOM knows how it was done:
00
Homogenising to airport and heavily affected urban sites gives meaningless numbers.
Thanks for showing everyone that fact.
50
If you find the original data from those sites.. they look nothing like the final fabrication
MASSIVE adjustments are made to those site that are on the map.
eg https://i.ibb.co/ncY7TGS/alice-springs-temp-adj.png
Its a total farce to think that the current BoM [creation] is even remotely connected to actual measured temperatures.
50
Jo, we tried in 2013 and got very similar results for the BOM’s average daily maximum for each state and Australia using an excel spreadsheet. It was nothing but complicated nonsense but it worked. What we proved was that the BOM’s method must have also been nonsense!
It was all sparked by that occasion in January 2013 when Australia recorded its hottest ever day, beating the previous one in 1972 I think it was. Funny, I can’t recall that 2013 mark being beaten.
50
Ian Hill – You said [It was all sparked by that occasion in January 2013 when Australia recorded its hottest ever day,]
Not so Ian – according to BoM the National Highest temperature from
The BoM Extremes and records page
http://www.bom.gov.au/climate/extreme/records.shtml
SA 50.7 2 January 1960 Oodnadatta Airport 17043
So no daily max has ever yet beaten Oodnadatta @ 50.7 degrees C
10
All the data points are collected and converted to a binary system, then they are spindled, mutilated, and messaged. Then a mean (the average) is calculated, and the result is converted from binary to the real number system of base-10. You can be sure of the result because it is presented with 3 digits to the right of the decimal. 🙂
110
https://kenskingdom.wordpress.com/2020/01/16/australias-wacky-weather-stations-final-summary/
Here is Kens final summary of his exhaustive review of all the BOMs weather monitoring sites.
As a Quality auditor this is utterly disgusting. Most of the sites don’t meet WMO or BOM internal standards but are still used. And no effort made to correct these glaring problems, as that would reduce temperatures….
And what calibration routines are in place with all these BOM stations?
Its also worth noting that the change from glass thermometers to digital has resulted in higher temperatures as the glass thermometers were more resistant to chance increases, such as a gust of wind across a nearby road or field moving warm air into the unit, whereas the digital probes are not. Hey presto – global warming…
The BOM needs to be shut down and outsourced to an outside contractor with rigid standards being applied and monitored. The Bom is so captured by the woke climate change rubbish it is not worth trying to keep.
160
The US set up a system of pristine sites in 2005…
.. and lo and behold.. the warming stopped 🙂
Its essentially the same temperature now in the USA as it was in 2005.
(A slight upward linear trend, for the monkeys with rulers, because of the effect of the 2015/16 El Nino.)
100
Thank you Prophet, I spent ages last night trying to find that page on Kens site. Look at the date. Wow. Just days before first news of Covid hit the fan…
70
Thanks Jo. When Ken was putting out the updates I saw nearly all of them.
If the plants I audit had systems like the BOM does with their non compliant weather stations, but more importantly they use that data and pretend it is something it isn’t, I would have shut them down and told management that they needed to clean out their Quality team.
Dr Johnson and all the management at the BOM need to be terminated for gross negligence and technical incompetence. It was a sad day for Australia in 2016 when Greg Hunt (I would call him something else), WEF acolyte, persuaded Tony Abbott (another WEF acolyte) and others not to investigate the BOM. I am available anytime, for free, to carry out a full Quality audit at the BOM, but somehow know I would never be invited by our govt to carry it out…
40
The BOM was based on thousands of people measuring things across a huge continent. Post masters, school masters, railway station masters, public servants, not automated internet satellite connected weather stations and weather satellites and automatic balloon stations. And more thousands entering and analysing data and creating and communicating maps and tables. So much of our weather data comes from the oceans and satellites do an amazing job even over Antartica and the vast oceans of the Southern Hemisphere. So it is likely the whole of the BOM could be contracted out overseas or removed entirely. And they know it. After all most of the Southern Hemisphere is covered by water.
Man made Global Warming is the BOM’s only hope for importance, relevance, work and jobs, so it has to happen. But the government’s appointed Climate Commission created under Julia Gillard did not have a single meteorologist. Which tells you that even the Profiteers of Doom do not see meteorologists as having a job in the future.
90
More climate activists – this time at an airport.
https://twitter.com/disclosetv/status/1595825544762986496
Handy tip: it’s a BAD idea to superglue yourself to a runway. 🤣
60
We are indeed witnessing unprecedented climate change for human civilisation. However it is not unprecedented in geological time. The change that is occurring now was repeated 4 times in the last 500,000 years.
This dramatic climate change always begins when perihelion moves later than the Austral summer solstice causing the the solar intensity over the Southern Hemisphere to reduce and the solar intensity over the Northern Hemisphere to increase. That significant change began around J1400.
Since then the oceans in the Northern Hemisphere have been warming. The mid winter temperature on the land north of 40N has been increasing at a rate 3.7C per century – incredibly high rate. Greenland is increasing in elevation. The permanent snow cover on Greenland is extending. The maximum winter snow extent in the Northern Hemisphere is increasing.
What is now deemed “global Warming” was previously known as glaciation. We can now observe how it starts.
The modellers are starting to wake up to what they are observing. CO2 is still being blamed but that will not last much longer.
https://phys.org/news/2022-02-depth-trends-revealed-cmip6-conflict.html
The one certainty is that new snow records will be a feature of climate over the next 9000 years. Think about that if you currently living north of 40N
At this stage, there is nothing new under the sun. Interglacials have terminated at monotonous regularity over the last 100,000 years. The interglacial ends when the Northen Oceans start to warm up and the winter advection of latent heat to land cranks up.
This video gives some good insight into the process currently going on over Greenland:
https://sealevel.nasa.gov/resources/43/measuring-elevation-changes-on-the-greenland-ice-sheet/
No climate model captures the cooling of the ocean south of Greenland due to increasing calving. The next big climate change will occur when all the new glaciers make their way down to the ocean and cool the ocean water thereby shutting down the water cycle that feeds the the glaciers at elevation.
70
“The UAH data is calibrated with thousands of weather balloons …”
I think the satellites and the balloons are calibrated, but not with each other directly.
Dr. Roy writes of this: “Contrary to some reports, the satellite measurements are not calibrated in any way with the global surface-based thermometer records of temperature. They instead use their own on-board precision redundant platinum resistance thermometers (PRTs) calibrated to a laboratory reference standard before launch.”
Being pedantic, “consistent with” or “of a piece” might better express the notion. Not a big deal, I know.
70
John, I’d like to get to the bottom of that. A quick search turns up things like this:
John Christy
14TH SYMOPOSIUM ON METEOROLOGICAL OBSERVATIONS AND INSTRUMENTATIONS
“A system of high quality radiosondes distributed over the Earth has been proposed (GCOS 2004,
Folland et al. 2006). One function of such a system would be near-real time calibration of satellite retrievals for on-going operational weather forecast initialization. If the system is of high quality, the observations could also be employed to assess the stability of satellite sensors and even to aid in intercalibration of satellites.”
https://ams.confex.com/ams/pdfpapers/116715.pdf
50
The NOAA/Reynolds sea surface temperature uses moored and moving bouy temperature measurements with satellite interpolation in the regions not covered by the buoys. It is true surface referenced.
UAH and RSS imply temperature high in the atmosphere. Despite being termed lower troposphere they measure at an altitude near freezing. They have passing similarity to surface temperature but delayed by about a month in the tropics and less in higher latitudes.
This is the RSS temperature for the globe:
http://climexp.knmi.nl/data/irss_tlt_0-360E_-90-90N_n.png
Minimum increased from 268.5 to 269.5 and maximum from 272 to 272.5 over 4 decades.
The GHCN land 40 to 80S has no clear trend over the last 70 years:
http://climexp.knmi.nl/data/ighcn_cams_05_0-360E_-80–40N_n.png
By contrast the minimum temperature for land between 40 and 80N is rising quite fast:
http://climexp.knmi.nl/data/ighcn_cams_05_0-360E_40-80N_n.png
“Globalwarming” is occurring most notably on Greenland in January
https://i0.wp.com/wattsupwiththat.com/wp-content/uploads/2022/11/Screen-Shot-2022-11-17-at-9.35.21-am-1669325989.1403.png?fit=785%2C321&ssl=1
The temperature was nudging MINUS 30C before 1950 and has now warmed dangerously to almost MINUS 20C.
This last fact alone provides the true nature of “global warming” – Mostly warmer northern winters due to more snow. The CO2 demonisers will contrive a story why CO2 is causing more snow but the process has occurred 4 times in the last 500,000 years without much change in CO2. The interglacial is coming to its natural end. Calling it “climate change” is correct but “global warming” is a misnomer.
10
Satellites can’t measure temperature but they can measure irradiance. The measures have to be calibrated to something and that is usually radiosondes.
34
They get pretty darn close to a trend match to the only pristine surface data in the world.
No-one would expect them to match the homogenised fabrication of heavily affected urban sites and airports that the surface data is based on.
Those surface data fabrications are totally unrepresentative of actual global temperatures.
10
I have been observing our climate data now for around 25 years, ever since I rebelled at being lectured to on the subject by economists, lawyers and politicians (John Thwaites included now on the board of Melbourne water-heaven help us!). As a Geologist who learned about climate drivers in my degree course, I could not accept that these people are more expert than me on the subject and started to study the causes of “climate change” and found the science was poor and unconvincing. You must remember that the science was accepted in the 1980s and the purpose of the IPCC was to find ways to address the supposed problems, not to question the science. So when I was building my first house in Victoria 25 years ago – I noted that my work was constantly interrupted by heavy rain systems coming from the south. Then we had the millenium drought and everyone was crying about how the warming climate was pushing species further south due to the warming oceans. My house burned down in the 2009 bushfires when we had watched for years all the rain systems passing well to our south. Well, over the last couple of years, those climate systems now pass through us and well up to the north. My garden is the wettest it has been since we bought the property those 25 years ago. When will someone point out that these systems are shifting to the north being driven by the cold cycles coming out of the Southern Ocean as evidence that the cycle has turned and will drive us back to a cold pattern? This is the coldest I have experienced Victoria in more than 30 years.
130
No one remembers when the last ice age ended, 11,000 years ago when Mahattan was under a kilometer of solid ice, but if they did, it would be remembered as a great day, a very good thing.
And cave paintings from far below the current ocean surface on the French Meditteranean tell us that the sea has risen as the warming made Europe habitable. So people moved. And fish and sail and travel and trade great distances on ships.
But suddenly warming itself is very bad. Ice might melt. Sea level rise is not survivable, even for the Dutch. And even the tiniest change in an average for anything is a reason to kill off the industrial revolution which ended slavery for most people on earth.
At what point did humans go completely mad?
And at what point did the observers of the weather decide they were the most important people on the planet?
120
And could someone in our BOM tell me why their predictions are so bad that I have to go to a Norwegian web site to plan the day?
120
Two days ago I made three comments in The Australian regarding historic temperatures in the 1930’s and 1890’s that were higher than present and regarding the habit of the BOM, CSIRO and others to pick dates with low temperatures to start a graph of “increasing trend” and, of course, the fact that the BOM has homogenised the raw data to reduce historic temperatures. All my comments were based on known facts and none were caustic or rude about these two organisations.
All three comments were rejected – I really wish I could find out why but they never respond to queries about their censorship.
160
Was that the evidence you supplied because that is just rhetoric without substance.
113
In my experience the biggest purveyors of disinformation are governments. Whether it’s climate change, COVID, Energy policy or any other number of important issues. The worst of this untrue rhetoric in Australia emanates from the leafy suburbs of Canberra.
70
Peter, can you copy the rejected comments here?
50
That is exactly what the BOM and others do. If one starts a “trend” from 1979 to now one will see a distinct rise in temperatures. If the trend is commenced from 1939 (or 1897) it would show a decrease in temperatures as those times were hotter than now, according to the raw data, not the BOM homogenised data which shows an artificial upward trend.
The problem with the BOM today is that it no longer has the highly experienced meteorologists of yesteryear who were able to interpret the data of pressure, wind speed, etc and look at the historical trends to observe comparisons. Now we have younger people, with less real forecasting experience, who rely almost completely on what the models tell them. At times the BOM models are no better than the IPCC ones
If one looks at the “raw” data, as recoded directly from the thermometers, the hottest time in Oz in the last 100 years were the late 1930’s. It then got colder until the late 1970’s and has slowly risen since then, but not to the temperatures of the 1930’s. If one goes back to the 1890’s it was even hotter then (The Federation Drought.)
But the BOM has “homogenised” the raw data to remove the highs of the 1930’s in order to create a false warming trend from 1910, to match the models of temperature trends.
This is not science, it is politics.
There you go, Jo. Happy to be corrected if I am wrong on anything
50
Interesting, Peter.
You must have made the Oz feel it needed to do something follwing your queries, since it published a very good letter today on a similar topic. See 2.3 above.
20
Indeed. Looks like the sub-editor of the letter section is not the same as the crew of ex SMH staff who monitor the comments!
20
That site even knows about our one pub town!
20
Bruce Rock?
00
Different rock
00
But we are still doomed, aren’t we?
30
This CSIRO/BOM report is a shocker. As No and others note, the slant is to emphasise what supports a global warming hypothesis and downplay or ignore inconvenient observations.
An example follows.
WUWT today reports interesting discussion about what can cause planet Earth to warm and cool. See under W Eschenbacb.
There are measurements supporting cooling processes and warming processes that are not exclusive to CO2. In some important comments, Rick Will notes that most global warming in the last few decades has been over land, in the northern hemisphere, at latitudes noth of 40 degrees N in January. 6 Why are these regions warming faster than the rest of the globe? Answer, increased latent heat advection leading to snowfall. But read Rick’s words.
In Australia, CSIRO/BOM note that Australian land is (allegedly) warming faster than the global rate. They do not propose a mechanism, they just infer that this is scarey so build more renewables. Their ideology is so strong that science is downplayed, which is unforgivable for science organisations.
Time to call for an audit. I am working on it.
Geoff S
80
[…] By Jo Nova […]
10
The Madden Juklian Oscillation to bring momentary relief from damp conditions in Oz.
‘The east-shifting MJO allows Australia to turn drier which is a rare event in the La Nina-driven wet climate of the past several years.’ (Climate Impact Company)
00
It’s worth noting that Australia’s land station mean temperatures have also been cooling since July 2012, based on averaged ACORN anomalies in the first and second halves of the period from July 2012 to October 2022.
http://www.waclimate.net/australia-cooling.html
In summary, ACORN mean temperature anomalies from July 2012 to August 2017 averaged +1.037C, and from September 2017 to October 2022 they averaged +1.032C – a cooling of 0.005C.
In a shorter timeframe, ACORN mean temperature anomalies from March 2017 to December 2019 averaged +1.515C, and from January 2020 to October 2022 they averaged +0.814C – a cooling of 0.701C.
This shorter timeframe includes 2019, Australia’s driest year on record when the ACORN mean annual temperature anomaly was +1.50C – which seems to be the 1.47C warming since 1910 claimed in the 2022 State of the Climate report and is the same level of warming claimed by the BoM for the past two to three years.
The significantly adjusted ACORN mean temperature anomaly in 1910 was -0.49C. It was +0.56C in 2021. 0.56C plus -0.49C equals 1.05C.
The report says most of the 1.47C warming has occurred since 1950. The average mean ACORN anomaly in 1910-1949 was -0.42C and in 1950-2021 it was +0.22C. That adds up to +0.64C.
Perhaps they’re splitting it all down the middle. The average mean ACORN anomaly in 1910-1965 was -0.37C and in 1966-2021 it was +0.35C. That adds up to 0.72C, which is about half the scratched record claim of 1.47C warming.
Strip away the homogenised adjustments of ACORN and the original RAW temperatures at the 104 non-urban stations used by the BoM to estimate Australia’s temperatures show an averaged mean of 19.045C in 1910-1949 and an averaged mean of 19.330C in 1950-2021 : a warming of 0.285C.
Alternatively, the mean RAW temperature at the 104 ACORN in 1910 itself was 19.230C and in 2021 it was 19.485C : a warming of 0.255C.
Note … academics, politicians and media should ignore above because apparently the science is settled.
10
[…] The Australian Climate is Fine — but the State of the CSIRO and the BOM is a Crisis […]
00