|
|
||||
|
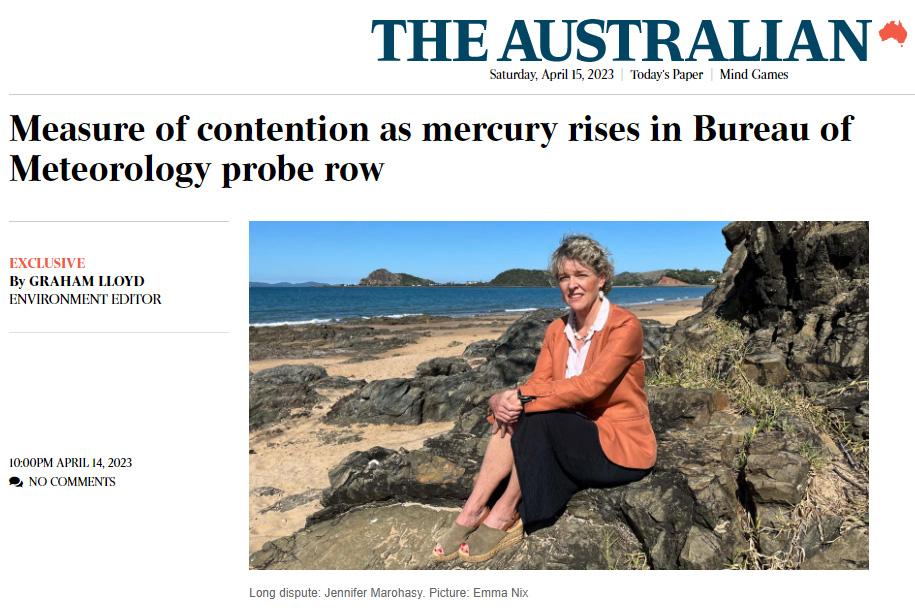
By Jo NovaElectronic thermometers may read up to 0.7 degrees higher than glass ones.Sometime in the mid-1990s the Australian Bureau of Meteorology replaced many of their glass thermometers with electronic sensors. They claimed they were carefully verified to match the slow way the old glass thermometers worked — after all, we wouldn’t want to use gizmos that recorded new all-time *Hottest Ever Records* that were actually just one-second gusts of hot air, would we? Our newspapers would be full of meaningless headlines about how Climate Change made us hotter than ever in history, when really it was just a mistaken effect of a new type of thermometer. Imagine that disaster of public policy… Of course this question is so easily solved. The BoM just needed to keep the two thermometers side by side in the same boxes and record all that data. Then they could release it, showing how well the electronic gadgets mimicked the glass thermometers, and Australians everywhere would feel confident that BoM was the sterling agency they thought it was. Instead Skeptics have been asking for comparison data for nine years and the BoM has refused, hedged, asked exorbitant fees, destroyed data and when the FOI requests came — fought them tooth and nail to stop Australians from seeing what their thermometers recorded. Climate change threatens life on Earth, but the BoM isn’t that interested in accurate data, doesn’t want to convince the skeptics, doesn’t care if the trends are affected by equipment changes and can’t afford some extra flash drives, even though it gets nearly a million-dollars-a-day. Sure. Jennifer Marohasy and John Abbott have doggedly pursued the BoM for three years with FOI requests. Finally the BoM have released a tiny fraction of the total, and it is as we suspected — electronic sensors can measure flickering changes in temperature that glass thermometers don’t pick up. Other agencies around the world average out the data from electronic gizmos but the Australian BOM says they have special thermometers which are designed to mimic the old thermometers, and they work so well the BOM can’t let you see any of that data….
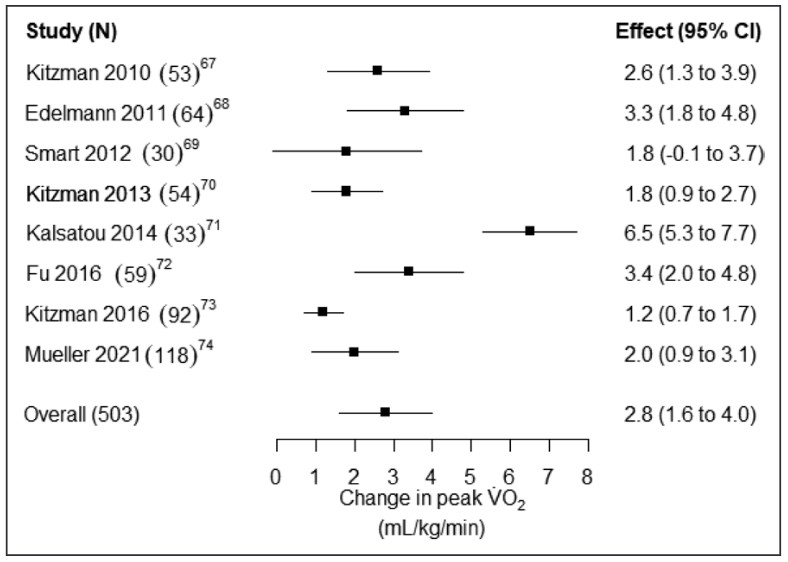
Mercury rises in Bureau of Meteorology probe rowGraham Lloyd, The Australian The documents, released after a years-long Freedom of Information campaign, show temperature measurements taken using updated BOM probes in automatic weather stations at the Brisbane Airport site could be up to 0.7C warmer than the temperature taken using a traditional thermometer at the same time at the same site. More than three years after a FOI request for parallel data was lodged by scientist John Abbot, the BOM released three years of data on Easter eve after the matter was taken to the Administrative Appeals Tribunal. The BoM says there’s no significant difference: Yet analysis of the data by scientist Jennifer Marohasy has found a statistically significant difference exists. Over the three-year period for which records have been made available, probes returned temperatures higher than the mercury thermometers placed alongside them 41 per cent of the time… and lower 25.9 per cent of the time. Dr Marohasy said the BOM had not disputed that the probe at Brisbane Airport had recorded up to 0.7C warmer than the mercury at the same site at the same time. Once again, the BoM releases it in the most inconvenient way possible — 1,000 sheets of paper?The documents released by the BOM under the FOI request included 1094 A8 reports with the handwritten daily maximum and minimum temperatures from both probes and traditional liquid-in-glass thermometers recorded from instruments in the same shelter/Stevenson screen. They represent about 20 per cent of the parallel records held for the Brisbane airport site, one of 38 sites originally requested under FOI. So does the BoM collect electronic data, and write it by hand on paper? They don’t digitize it and run it through the supercomputer — they analyze it with pen, paper and slide rule? Or perhaps they have all the handy digital files, but they don’t want to hand over all the nuclear launch codes, I mean “top secret” thermometer readings… Dr Marohasy said the data represented just three of the 14.5 years (January 2008 to July 2022) of parallel data that the bureau held for Brisbane Airport. “It is also just a fraction of the 760 years of parallel data the bureau holds for 38 different locations spread across the landmass of Australia,” she said. Trust us, our thermometers are so good we can’t tell you:The rest of the world averages electronic temperatures over longer periods, but the Australian BOM has better thermometers: Bureau chief executive Andrew Johnson has told her the probes were specifically designed to have a long response time to mirror the behaviour of mercury in glass, making numerical averaging unnecessary. Dr Marohasy said the lack of numerical averaging despite the use of probes made the BOM measurements unique in the world. If Climate Change is caused by electronic “thermometers” it’ll be cheaper to solve… UPDATE: The effect the electronic sensors can have is so much more complicated than “mean temperature” deviations. Even if the average temperature recorded by an electronic sensor was the same as as a glass one, the extremes could be quite different. And the behaviour of air, turbulence and variability at 3pm when maximum temperatures are recorded is different to the pre-dawn minimum hour of day. At the very least, electronic sensors could be offering up many more “Headline” records for heat, and increasing three day, five day, week long heatwaves, plus hottest nights, more days over 35C — there are many cherries to be picked here. Potentially, the electronic sensors offer a bonanza of propaganda headlines for the Green Blob to pick from, especially when “coldest ever days” get ignored by the media. Read it all in The Australian. A charge that needs to be laid, –Ruairi April 15th, 2023 | Tags: Australian temperatures, BOM, Marohasy (Jennifer) | Category: Global Warming |  Print This Post | | Print This Post | |  Image by DanaTentis from Pixabay By Jo Nova A new review of studies came out a few weeks ago pointing out that trials of 700 people with the most common kind of heart failure show they did better after an exercise program than they did with drugs. I’d like to say “Big Pharma won’t be happy” but Big Pharma probably couldn’t care less. The money, the industry, the regulatory agencies, Hollywood, and a lifetime’s habit means most people will keep returning to largely well-meaning but busy doctors who will prescribe the latest something, whatever it is. But ultimately the people who get out there and do supervised exercise of any kind a few times a week get more benefits than those taking the latest patented drug. They’ll also have a higher quality of life. In this study they’re looking at people with the most kind of common heart failure called HFpEF. The exercise is supervised because there is some risk in people who may be quite unfit or unhealthy. How much of our lives is spend working to pay for a bloated health-care system that finds expensive ways to employ many people to do what we could have done better ourselves? This, from the abstract, is medical-speak for “the drugs were useless”, and we already know exercise works much better: Until recently, most pharmacological intervention trials for HFpEF [a common type of heart failure] yielded neutral primary outcomes. In contrast, trials of exercise-based interventions have consistently demonstrated large, significant, clinically meaningful improvements in symptoms, objectively determined exercise capacity, and usually quality of life. Exercise therapy is safe and helps improve recovery, study findsBy Annie Lennon in Medical News Today Heart failure occurs when the heart can no longer pump blood and oxygen around the body. The condition represents around 8.5% of heart disease deaths in the United States. Heart failure with preserved ejection fraction (HFpEF) causes around half of heart failure cases in the U.S. It happens when the heart’s left ventricle stiffens, increasing pressure inside the heart. For the study, the researchers analyzed results from 11 randomized controlled trials investigating supervised exercise therapy on HFpEF outcomes. The studies included over 700 participants, mostly aged between 60 and 70 years old. Participants engaged in various activities, including walking, Greek dancing, and high intensity training three times per week for 1-8 months. We can’t get exercise in a pill: “The benefits of exercise cannot be duplicated by medication or procedures. Regular exercise of 2.5 hours weekly or that equivalent increases life expectancy, reduces the incidence of heart disease complications, and has been linked to reduced risk for some cancers, such as colon. A similar review 5 years ago in Europe showed much the same thing. Except in that case, they studied mortality too and an increase in peak oxygen uptake of 13% translated into 11% lower all-cause mortality. The European study saved lives: Mortality was down 11%More than 14 million Europeans suffer from heart failure (HF). Despite significant improvements in the treatment of HF, morbidity and mortality remain unacceptably high [1]. In addition, the costs for HF care approach 2% of the healthcare expenditure in Western Europe. One of the hallmarks of HF is severe exercise intolerance with pronounced fatigue and dyspnoea, even at low workloads, resulting in a markedly decreased quality of life. With regard to benefit on exercise capacity, a meta-analysis of 29 randomised controlled trials (RCT) including 848 patients revealed a mean improvement of VO2peak of 2.16 ml/kg/min [4]. Although modest in absolute terms, this means an increase of 13% which translates into a considerably better quality of life [5]. This study showed in an intention-to-treat analysis that exercise training was associated with an 11% lower adjusted risk for all-cause mortality or all-cause hospitalisation and a 15% lower adjusted risk for cardiovascular mortality or HF hospitalisation. Any kind of exercise will help: Supervised exercise called better than drugs for common type of heart failureMarch 21 (UPI) — Supervised exercise like walking, stationary cycling and even dancing about three times per week was more effective than drugs in helping people with symptoms of one of the most common types of heart failure, according to a new scientific statement. The studies that were examined looked at numerous types of exercise, from walking, stationary cycling, high-intensity interval training, strength training and dancing in facility settings and home-based training. The statement characterized supervised exercise therapy as being conducted three times per week, and the duration of the programs varied from one month to eight months. “Exercise capacity is an independent, clinically meaningful patient outcome, and research has indicated that guided exercise therapy is actually more effective at improving quality of life for people who have [heart failure with preserved ejection fraction] than most medications.” From the paper itself: Peak oxygen capacity was improved in every study in this latest review: Peak oxygen capacity is so important it actually predicts all cause mortality.And the US study improved VO2 almost exactly the same amount as the European one, so presumably it would have saved lives too: [The Review] found that supervised exercise training may lead to increased peak oxygen uptake 12 to 14%, increased total exercise time by 21% and improved quality-of-life scores on the Minnesota Living with Heart Failure questionnaire 4 to 9 points. Earlier this month, a University of Cambridge study suggested that brisk 11-minute daily walks can be enough to lower a person’s risk of heart disease, stroke and cancer. The kind of patients this study was aimed at were: Dr. Hermel added: “Supervised exercise programs such as cardiac rehab have demonstrated significant benefit for patients with recent heart attack or another acute coronary syndrome, chronic stable angina, congestive heart failure, pulmonary hypertension, after stent placement, coronary artery bypass surgery, heart valve surgery or cardiac transplant.” As usual, the most important scientific work is often done by volunteers: This scientific statement was prepared by a volunteer writing group on behalf of the American Heart Association and the American College of Cardiology. In the three weeks since this important review was released the article metrics tell us it was picked up by 24 news outlets, bogged by 2 and tweeted by 144. In other words, hardly anyone. REFERENCE Sachdev et al (2023) Supervised Exercise Training for Chronic Heart Failure With Preserved Ejection Fraction: A Scientific Statement From the American Heart Association and American College of Cardiology, Circulation April 13th, 2023 | Tags: Big-Pharma, Corruption (Medicine), Health, Mental Health | Category: Health | Print This Post | | 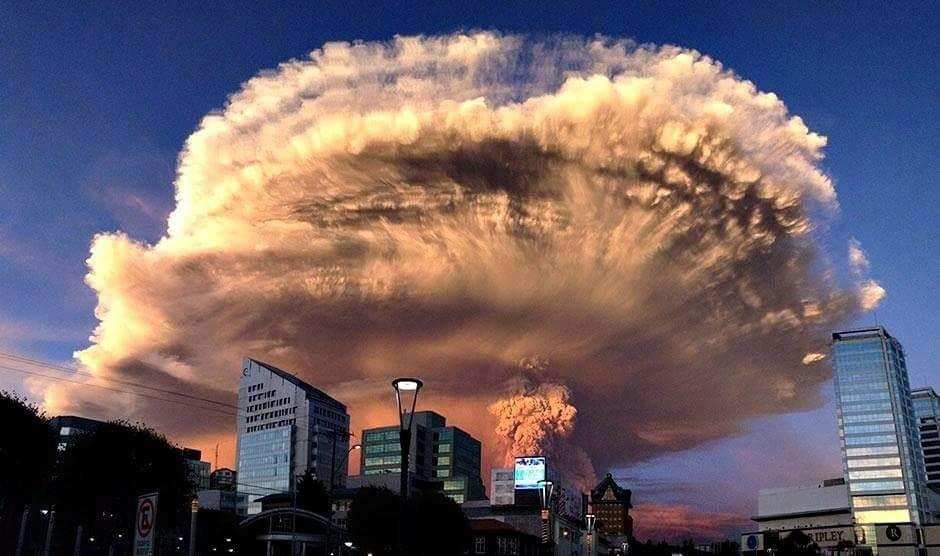 Photo of the 2015 explosion of Calbuco Volcano in Chile, by Keraunos ob, posted on the Earth of Fire blog by Bernard Duyck.
By Jo NovaA year ago I wrote about the odd link between the Hunga Tonga volcanic dust and floods in Australia, but perhaps volcanic dust also played a role in the savage rain bombs of 1893 that caused the infamous floods of Brisbane? After Hunga Tonga erupted last year, about a week later unusually heavy rain started falling over Australia — even washing out the Indian Pacific Railway line connecting East and West Australia. A month later and the dust had gone around the world and returned to give us glorious sunsets followed by more rain bombs. So it may be just a coincidence, but the second heaviest Australian rain bomb was on Feb 3, 1893. And three weeks earlier on January 7th the Calbuco Volcano in Chile had its largest eruption in the last 130 years? In 1893 an astonishing, flabbergasting day occurred, where 907mm of rain dropped from the sky on Crohamhurst in Queensland (that’s nearly 36 inches!). It came in an astonishing week, where the heavens dumped 2 meters of rain (6.6 ft) in just four days subsequently causing some of the worst flooding Brisbane has ever seen as the waters collected and flowed downstream. 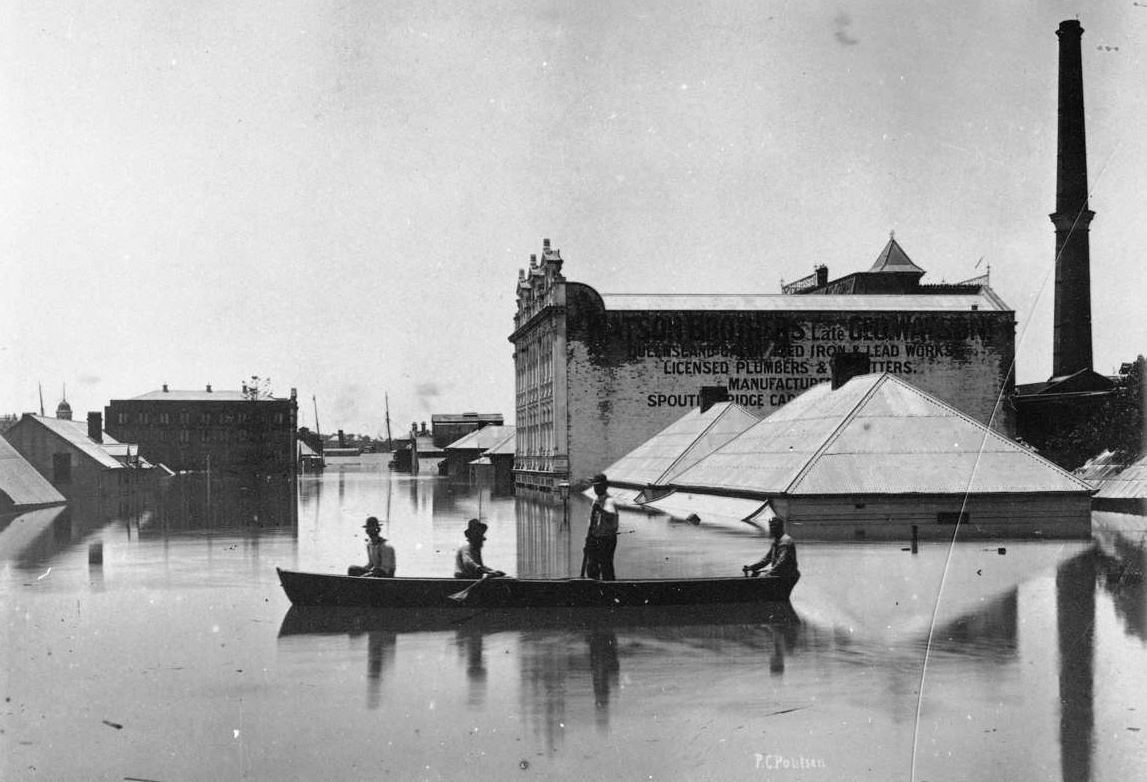 Brisbane floods 1893, Poul C Poulsen. | ANMM Collection | From February 1 to 4 a total of 1,964 mm of rain fell. There were cyclones in the area, but these were two weeks earlier, so unlikely to be the cause of such a downfall. Was it seeded by volcanic dust? Maybe. h/t El Gordo for suggesting Calbuco Volcanoes in Chile can certainly send dust over AustraliaIn 2011, the ash from a volcano-next-door in Chile, Puyehue-Cordon Caulle, shut down flights in Sydney a week after going off. The ash then travelled right around the world and came back to shut flights down again 10 days later — this time at a lower altitude. 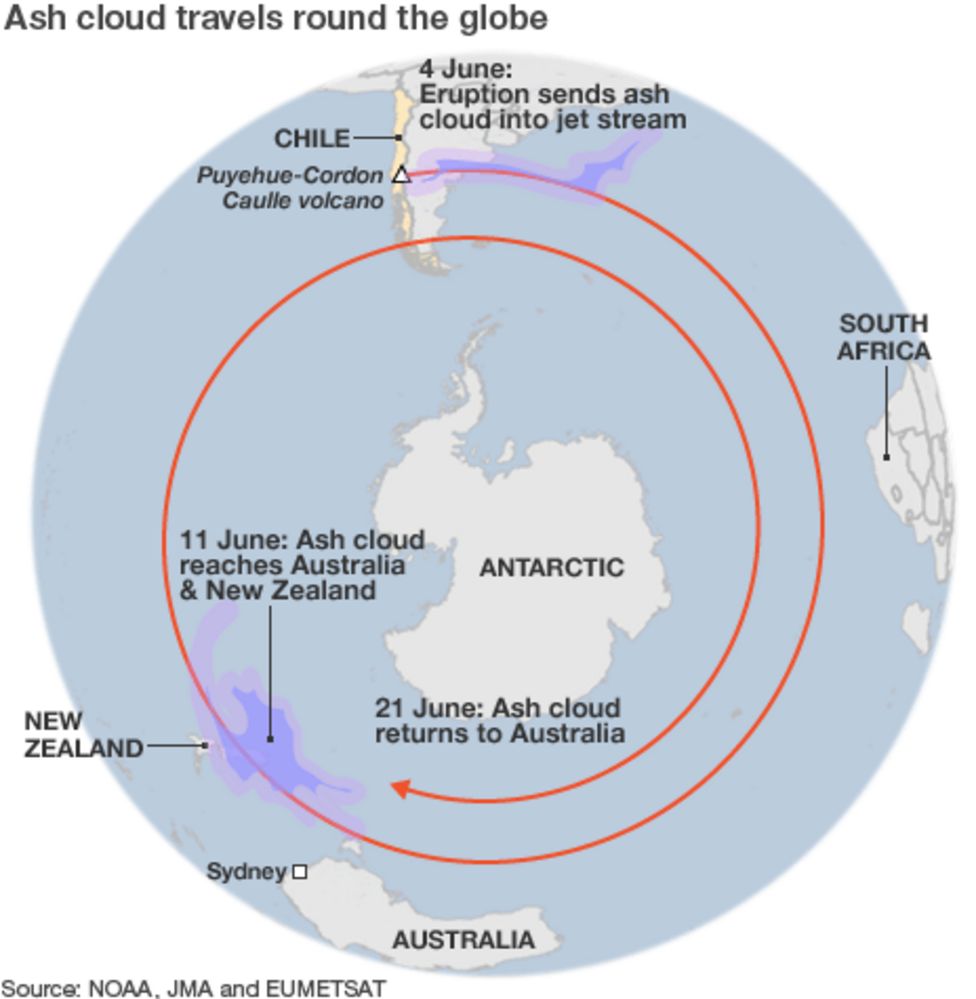 In 2011, ash travelled around the world twice — taking 7 days and then another ten to do the second lap. BBC So this track (through Sydney) would have been too far south to reach Brisbane, but other times volcanic dust travels north. (The path in the map above seems figurative, not literal…). The two volcanoes we are discussing in Chile lie at 41 degrees south compared to Crohamhurst in Queensland, Australia, which is only 27 degrees south and much closer to the equator. But in a smaller 2015 explosion, the dust from Calbuco was tracked moving north from 41°S up to about 30°S within just a few days — putting it a lot closer to the right latitude for Southern Queensland. With no satellites in 1893, we don’t know where the dust went, but we know there was probably a lot of it, and it went somewhere… In 1893 the Calbuco explosion was a large one:According to the Department of Geological and Mining Engineering at Michigan Tech: The first historically documented eruption began on 7 January 1893 and lasted until mid-January 1894. The initial phase of this eruption was violently explosive and led to the generation of destructive lahars. During the later stages of the activity, the volcano may have extruded lava although this is not certain. Minor eruptions occurred in 1895, 1906, on 22 April 1907, in March 1909, and in 1911-1912; none of these events produced lava flows or lahars. In 2015 a smaller eruption at Calbuco in 2015 sent dust to the North: On 23 April at around 2330, a third period of activity resulted in ash plumes rising 2 km and drifting NE and E. On 24 April the ash plume continued to rise 2 km and explosions were detected. News articles noted that international travel was disrupted; flights in and out of several major cities were delayed or canceled. Thermal anomalies, based on MODIS satellite data, were also observed during 23-24 April. According to one news report, ash from the eruption reached southern Brazil on 25 April, prompting some airlines to cancel flights in and out of Santiago, Buenos Aires, and Montevideo. Some houses in areas near the volcano had collapsed from the weight of the ash. Sporadic explosions caused continued ash plumes 25 April, but to a lower height of 400 m. Seismicity declined during 26-27 April; ash rose 1.5 km, and drifted NE and SE. By 28 April, a satellite-based estimate of sulfur dioxide emissions was 0.3-0.4 Tg (Tg is one million metric tons), detected as high as 21 km altitude. NASA tracking shows the plume from Calbuco can travel north quickly.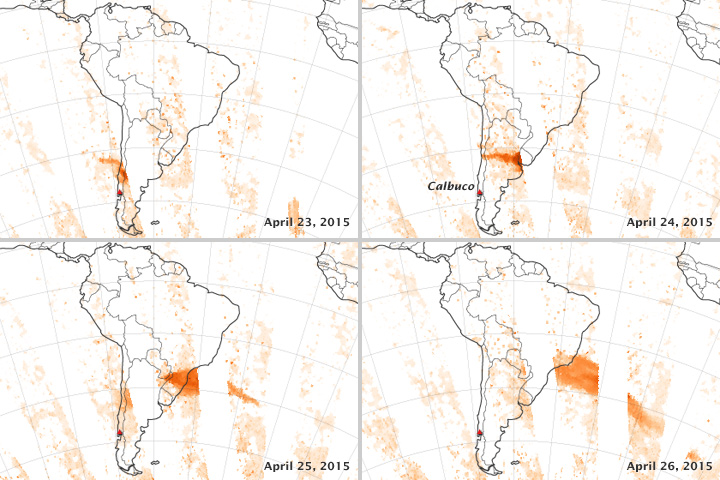 Tracking the Sulfur Dioxide from Calbuco, NASA The CSIRO discusses the extreme weather events of 1893 but doesn’t mention any volcanoesAccording to the CSIRO there were a series of tropical cyclones (TC) in Jan and Feb 1893, but none of the dates fit the monster downpour on Feb 1-4. The cyclone on Jan 22 would have soaked the ground, but not caused big rain nearly two weeks later. A TC during 21–22 January 1893 passed just east of Brisbane where gusts reached 57 knots (28 m/s) with the MSLP down to 985.1 hPa at 1700UTC 22 January 1893 (Fig. 2). There was a large storm surge in Moreton Bay to 0.58 m (Gourlay 1981) with widespread sea damage at Sandgate, Cleveland and Southport. Heavy rain fell across SEQ with the heaviest 24-h total of 179.8 mm at Mount Tamborine. There were two deaths in northern NSW with heavy gales at Lismore, Casino, Grafton and Sydney. For Brisbane, the monster rain collected into a major flood. Indeed, many floods in 1893 — on the 5th, 12th and 19th February, and again on the 12th of June. The flooding on the 5th of Feb was the second highest after the 1841 floods. 3.3 First 1893 flood – possibly the worst in Australian historyThe largest recorded flood in Brisbane City was 8.35 m on 5 February 1893 (Brunt 1958; Newman 1958) and the unprecedented conditions resulted in at least 30 fatalities. Early on 3 February a 15.2-m high wall of water was observed to roar down a Brisbane River gorge. The water tumbled down the Stanley River to its junction with the Brisbane River. Nearby was Caboonbah, the residence of grazier Mr. H.P. Somerset. Caboonbah (Fig. 3a ) is on high ground, with a view of the Brisbane River below its junction with the Stanley River. Crohamhurst (on the Stanley River) recorded 907 mm of rain in the 24 h to 9 am 2 February 1893 and this was an Australian record for 24-h rainfall up until 1979. The location of Crohamhurst and the 96-h rainfall is shown in Fig. 3b . For whatever it’s worth there were no mass rain events in 1893 in Melbourne or Sydney. If La Nina was the main culprit (or widespread volcanic dust) we would have expected to see major rain there too. We can’t say much about a path of a dust cloud 130 years ago — only that it might have been in the right place at the right time. Related:
April 12th, 2023 | Tags: Australian rainfall, Rain, Volcano | Category: Geology, Meteorology | Print This Post | | By Jo Nova
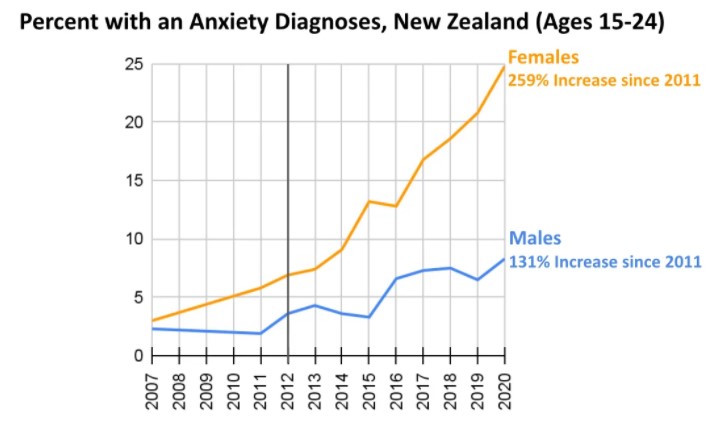
Rausch and Haidt make a compelling case that this coincides with the rise of smart phones and selfie-culture, and perhaps that is all the rocket-fuel we need. But the rise of the Glorious Victimhood Era of Woke was surely the guidance system that pointed a whole generation in a race to climb Mental Disability Mountain. Teenage girls are magnets for fashion — not just in clothes but in ideas too. They may be collecting diagnoses like teenage boys collected football cards, but self-poisoning is not a sport. The culture that acts like a teenage girl seems to be having trouble breeding healthy women. Substack: After Babel The Teen Mental Illness Epidemic is InternationalZach Rausch and Jon Haidt In sum, all five Anglosphere countries exhibit the same basic pattern:
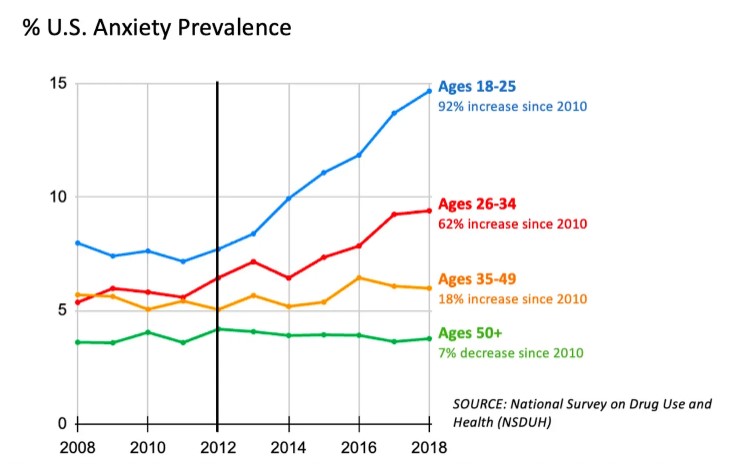
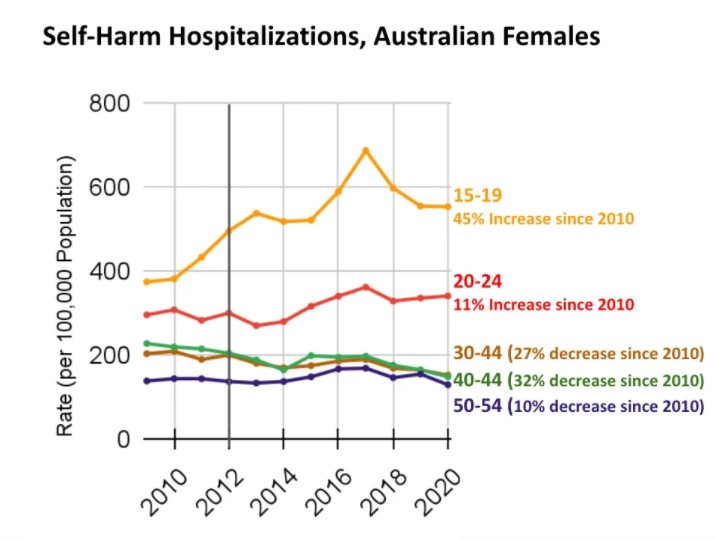
Why did this happen in the same way at the same time in five different countries? What could have affected girls around the English-speaking world so strongly and in such a synchronized way? At this point, there is only one theory we know of that can explain why the same thing happened to girls in so many countries at the same time: the rapid global movement from flip phones (where you can’t do social media) to smartphones and the phone-based childhood. The first smartphone with a front-facing camera (the iPhone 4) came out in 2010, just as teens were trading in their flip phones for smartphones in large numbers. (Few teens owned an iPhone in its first few years). Facebook bought Instagram in 2012, which gave the platform a huge boost in publicity and users. So 2012 was the first year that very large numbers of girls in the developed world were spending hours each day posting photos of themselves and scrolling through hundreds of carefully edited photos of other girls. If you suddenly transform the social lives of girls, putting them onto platforms that prioritize social comparison and performance, platforms where we know that heavy users are three times more likely to be depressed than light users, might that have some impact on the mental health of girls around the world? We think so, but if anyone can offer another explanation that fits the graphs we’ve shown in this post, we’d love to hear it. What Happened to Teens in the Five Anglosphere Countries? There are 17 figures in the full post, graph after graph — all similar variations on young women in trouble. Women with anxiety, women harming themselves, in psychological distress, visiting psychiatry emergency departments, and generally feeling unhappy. Perhaps shattering the glass ceiling isn’t all it’s cracked up to be? Perhaps the freedom to have meaningless one night stands and compete in the tinder date race, isn’t freedom at all?
Figure 3. Percent US Anxiety Prevalence. National Survey on Drug Use and Health (NSDUH). …
Percent US Anxiety Prevalence. …
Figure 14. “Have you ever been told by a doctor that you have an anxiety disorder? This includes panic attacks, phobia, post-traumatic stress disorder, and obsessive-compulsive disorder?” New Zealand Ministry of Health, New Zealand Health Survey 2020. .. 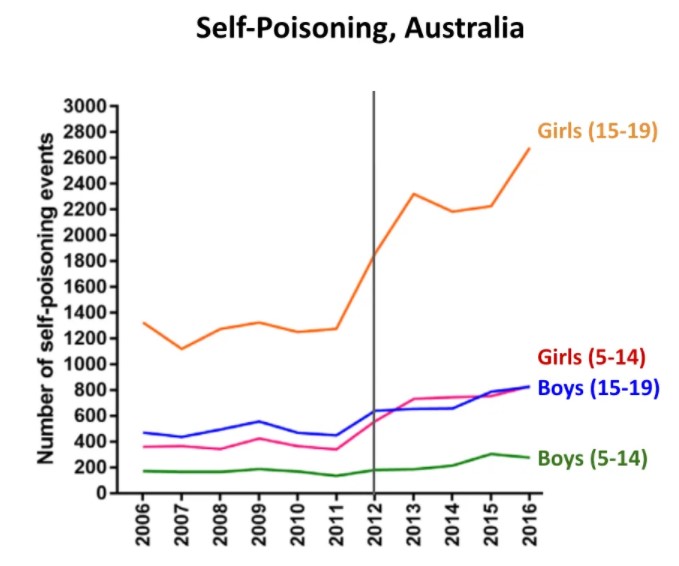 Figure 13. Trends in intentional self-poisoning, ages 5–19 years, 2006-2016. Rates per 100,000. See 1.3.14 in The Coddling of the Australian Mind? Graph created by Cairns, Karanges, Wong, Brown, Robinson, Pearson, Dawson, & Buckley (2019), with text added by Zach Rausch. …
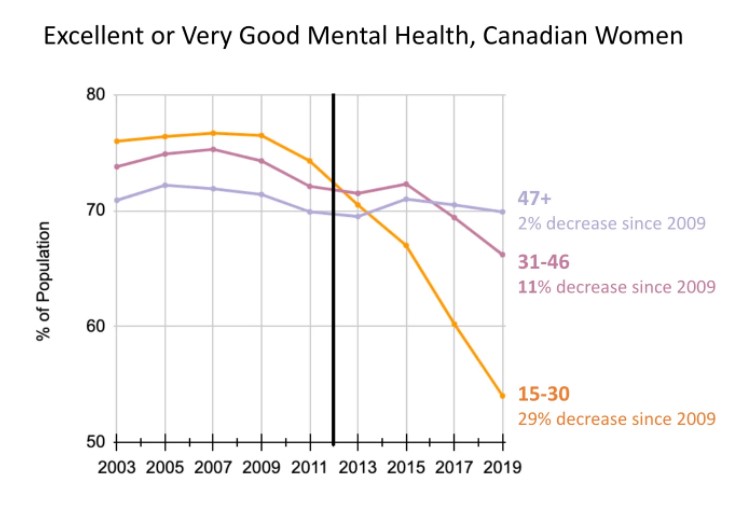
Figure 5. Excellent or very good mental health, Canadian women. Canadian Community Health Survey (2003-2019). See section 1.3.2 of The Coddling of the Canadian Mind? A Collaborative Review. This graph is poignant — these girls are as young as 10.
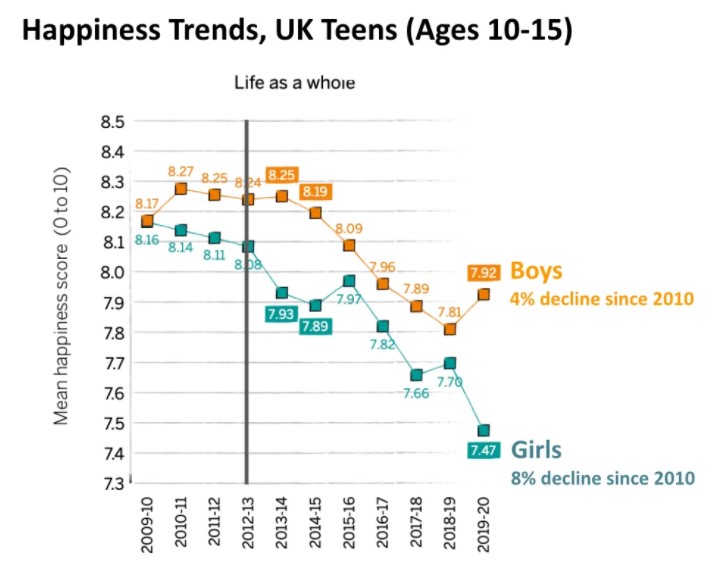
Figure 8. Trends in children’s happiness with different aspects of life by gender, UK, 2009-10 to 2019-20, graphed in The Good Childhood Report (2022)—data from Understanding Society survey. Photo of girl by Surprising Shots. April 11th, 2023 | Tags: Gender Studies, Psychology | Category: Global Warming | Print This Post | | Well, nearly. Two weeks treatment costs $3.75*In Tunisia from February to May last year 470 people with Covid were randomly either given 50mg of zinc each day for two weeks or given a placebo. In the zinc group, after 30 days, 6% had died, and 5% had been admitted to intensive care. Meanwhile in the placebo group 9% had died and 11% had gone to the ICU. People taking zinc got out of hospital a few days before the people who didn’t. Since there were no serious adverse effects in anyone from taking zinc, it’s obvious that good governments were handing out zinc tablets in carparks, schools and shopping malls, thus saving lives, millions of dollars, and keeping hospitals half empty. The rich world looks to healthcare systems like El Salvador. Shame about the other sclerotic swamps and backwaters of crony medicine. Sometimes countries have too much money to get good treatment. In Australia, the government spent billions on experimental barely-tested vaccines with hidden results and secret contracts. Our TGA told everyone the vaccines were safe and useful but fined someone $8,000 for advertising on their website that ivermectin and zinc lozenges were effective against Covid. But who fines the TGA? The error bars are large in the little Tunisian study (below), and we could debate the meaning of it except that there are 40 other studies on 45,000 patients in 16 countries which largely say that same thing. Early treatment with zinc reduces deaths by 40%, or even more. 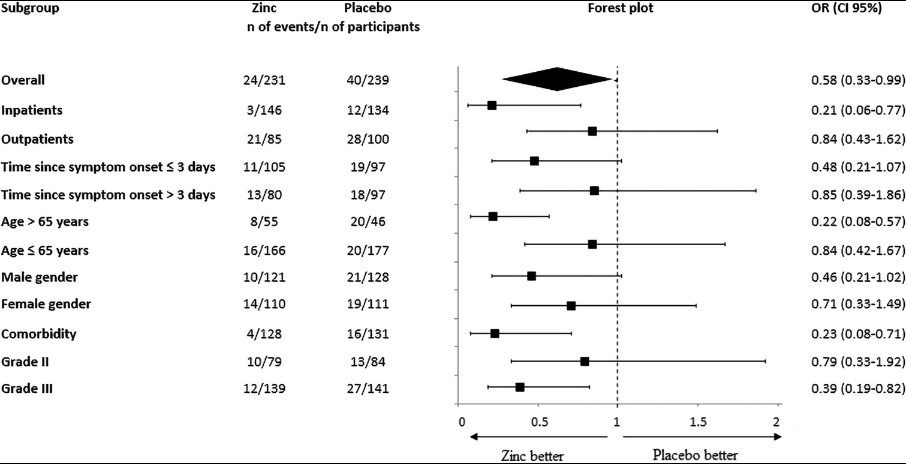 https://academic.oup.com/cid/article/76/2/185/6795268?login=false
With viruses every day countsIn larger study (Mayberry) 940 patients start zinc a week before or within 48 hours of getting hospitalized, and those people were 50% less likely to die. In the Tunisian study people who got treatment in three days were vastly better off than those who didn’t start til 4 to 7 days. This also makes it fairly easy to design other studies to fail simply by starting treatment too late. For any virus, ideally, we’d have figured out a plan with our legally approved doctor and have it in the cupboard ready to use. 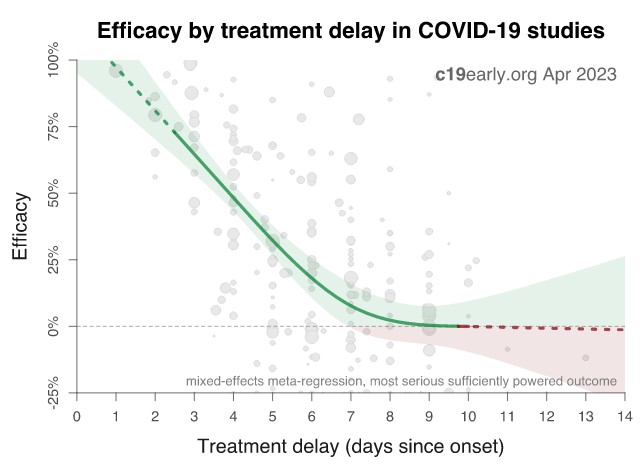 Every day counts. https://c19early.org/zmeta.html Nationally, those delays waiting for an appointment, a chemist, or a test result mean we need bigger hospitals. But then, hospitals probably don’t mind that. With the whole system profiting from treating sick people, not stopping them getting sick, it’s “probably” not an accident that cheap solutions get forgotten on the side of the stockholder’s super-highway. Billions of dollars depends upon it. Zinc is useful in so many waysZinc is used in about 100 different enzymes. Without enough zinc, immune cells don’t work properly. Zinc prevents the virus getting into cells preserving the tissue barriers. It slows the viral factory assembly line that is trying to churn out baby viruses. Zinc is needed to stop our immune cells from dumping too many of the reactive oxygen and nitrogen species that do so much damage to our tissues. So zinc reduces inflammation storm — mostly just by helping our immune system do what it is supposed to do.
 Source: Wessels et al Click to enlarge. Wessels even suggests that quite a few Covid symptoms might be related to zinc deficiencies. The most common symptoms of COVID-19 are impaired smell and taste, fever, cough, sore throat, general weakness, pain as aching limbs, runny nose, and in some cases diarrhea (10). In the subsequent chapters, we will associate most of those symptoms with altered zinc homeostasis and explain how zinc might prevent or attenuate those symptoms, as summarized in Figure 1 Indeed, most of the highest risk patients for Covid are also conditions where zinc deficiencies are common: …the intersection between risk groups of COVID-19 and zinc deficiency is impressive. In patients with chronic obstructive pulmonary disease (COPD), bronchial asthma, cardiovascular diseases, autoimmune diseases, kidney diseases, dialysis, obesity, diabetes, cancer, atherosclerosis, liver cirrhosis, immunosuppression, and known liver damage low serum zinc levels are regularly observed Long term higher dose zinc may cause a copper deficiency, which has its own problems. But during illness, needs for zinc probably dramatically increase as our immune system ramps up. For whatever it’s worth, the RDA is 11mg for men, and 8mg for women. And the upper tolerable intake is 40mg according to Harvard. Zinc has been used for healing infections since ancient Greek times. It’s not like we didn’t get some warning. The best sources of zinc are meat, fish and seafoodSix oysters will give you 50mg. A 5oz chuck steak — 15mg and a cup of lentils has 3mg. Oysters are way out ahead. The largest source of zinc for most people is probably steak, and yes, vegetarians are more likely to be deficient. *The cost of $3.75 was calculated on Australian Chemist Warehouse prices. But currently bulk zinc trades for $3,000 a ton (US) so the base cost is one hundredth of a cent per dose. There is some room for bulk savings, not that anyone in government seems interested in saving taxpayer funds or stopping them dying of basic nutritional deficiencies… REFERENCEAbdalla et al (2022) Twice-Daily Oral Zinc in the Treatment of Patients With Coronavirus Disease 2019: A Randomized Double-Blind Controlled Trial, Clinical Infectious Diseases Mayberry et al (2021) Zinc use is associated with improved outcomes in Covid-19: Results from the Crush-Covid registry, Critical Care Medicine 50(1):p 81, January 2022. | DOI: 10.1097/01.ccm.0000807104.82650.d6 Wessels I, et al. (2020) The Potential Impact of Zinc Supplementation on COVID-19 Pathogenesis. Front Immunol. 2020 Jul 10;11:1712. doi: 10.3389/fimmu.2020.01712. PMID: 32754164; PMCID: PMC7365891.
h/t CraigKelly April 9th, 2023 | Tags: Antiviral, Zinc | Category: Big-Government, Health, Microbiology | Print This Post | | For those wondering, I decided the Open Thread heading was unnecessary. Look at “Recent Posts” top left, simpler is better…
Bankers are just nice peopleA major banker, worth $2 billion, says the government needs to take land away from poorer people and build machines on it to change the weather. CEO Jamie Dimon says he “is a red-blooded, patriotic, free-enterprise and free-market capitalist” while he promotes government control of markets, land, clouds, wind and rain. ” We simply are not getting the adequate investments fast enough for grid, solar, wind and pipeline initiatives” he complains, suddenly unhappy with the free-market, and sounding like a red-blooded communist on steroids instead. Even the Soviets didn’t try to micromanage the planet’s weather. Dimon’s annual letter to Shareholders starts with all the right catchphrases. He comes in “defense of democracy and essential freedoms, including free enterprise”, but he doesn’t seem too interested in private property rights. He’s exasperated with people who won’t consider a carbon tax to stem climate change, though he doesn’t say anything about people who have considered it and think it’s Shamenistic VooDoo. h/t To John Connor II, Climate Depot and Marc Morano
Seize property to build wind and solar farms, says JP Morgan chiefby Simon Foy, The Telegraph, UK The chief executive of JP Morgan has suggested that governments should seize private land to build wind and solar farms in order to meet net zero targets. Jamie Dimon, the longstanding boss of the Wall Street titan who donates to the Democratic Party, said green energy projects must be fast-tracked as the window for averting the most costly impacts of global climate change is closing. In his annual shareholder letter, Mr Dimon said: “Permitting reforms are desperately needed to allow investment to be done in any kind of timely way. “We may even need to evoke eminent domain – we simply are not getting the adequate investments fast enough for grid, solar, wind and pipeline initiatives.” Eminent domain is when a government or state agency carries out a compulsory purchase of private property for public use and compensates the asset holder. The bankers just want to save the worldFrom the letter to shareholders itself: As you know, we are champions of banking’s essential role in a community — its potential for bringing people together, for enabling companies and individuals to attain their goals, and for being a source of strength in difficult times. The window for action to avert the costliest impacts of global climate change is closing. Massive global investment in clean energy technologies must be done and must continue to grow year-over-year. Policies like the Bipartisan Infrastructure Law, the Creating Helpful Incentives to Produce Semiconductors (CHIPS) and Science Act, and the Inflation Reduction Act (IRA) — that hold the potential to unlock over $1 trillion in clean technology development — need to be implemented effectively. JPMorgan Chase has financed more than $170 billion in green initiatives in the last two years, which presumably will do better if the government slaps on carbon taxes and offers up easy land. But it probably has more to do with the unholy alliance of corporate power and Big Government, both feeding off each other in a cosy arrangement that fears only that the masses might figure it out.
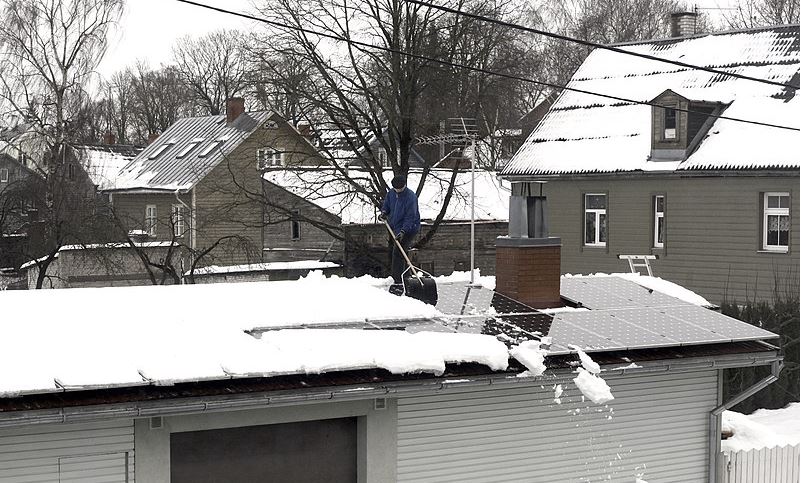
By Jo Nova The transition is happening, it’s just not the Green one. Only one in ten Germans still believe solar and wind power can meet Germany’s energy needs. Three quarters of the people who used to be optimistic about Green energy have changed their mind. But right now, the people are ploughing the snow off the solar panels while the government is ploughing along with the plan… “The Germans have realized their government is on a suicidal ghost ride.”— AUF1 Editorial team Thanks to Pierre Gosselin at NoTricksZone :Germans Overwhelmingly Fed Up With Move To Green EnergiesAs the government gears up to try to pass legislation that would force most homeowners to carry out extensive renovation to their homes and upgrades to their heating systems, the Energiewende is suddenly no longer looking like a bargain and is no longer welcome by the vast majority of Germans, according to a Forsa survey. Skeptics are the majority. Majority of Germans have doubts about a complete energy transitionDie Welt, Germany Germans do not believe that the country’s energy needs can be met entirely by renewable energies. Amazing: Far fewer people believe in the energy transition than twelve years ago. In Germany, skepticism has increased that the energy demand can be covered solely with renewable energies in the foreseeable future. According to a Forsa survey, only ten percent believe this, while 88 percent do not. In 2011, the value measured by Forsa was still 39 percent for “yes” and 61 percent for “no”. People may call the punters stupid, but six out of ten Germans have realized that natural gas and nuclear power are good things. The unwashed masses can figure things out. AUF1 Editorial Team
Majority for natural gas and nuclear power59 percent are still in favor of using natural gas as a source of energy, 57 percent are in favor of retaining nuclear energy – even significantly more than 10 years ago. The Germans have realized their government is on a suicidal ghost ride. Despite this, Chancellor Scholz continues to fabricate that the energy transition will succeed and that by 2030 80 percent of electricity will come from renewable energies. Therefore, heating bans and building renovation obligations are being adhered to, the installation of heat pumps – and above all the shutdown of the last three remaining nuclear power plants this month. The federal government is using the crowbar to continue a policy that has already failed and is rejected by an overwhelming majority of its own population. Do 10% rule over the 90 — Who exactly does Chancellor Scholz answer too? Photo by Sillerkill Man-made weather control is such unscientific witchcraft it needs professional teams of coaches to maintain the mythology. It’s not enough to pump the doctrine in the nightly news, they have to nudge them while they get a cut n’ color. We’ve now descended to the Pravda School of Hairdressing Science in order to keep the climate bubble floating above cold weather and shocking power bills. According to The Guardian customers are “embarrassed” that they don’t understand climate science, and can’t wait to have their hairdresser to explain radiative physics to them. Sorry, I mean, to sell them a solar panel or teach them how to lose money with an environmental pension fund. Sounds like a fun haircut, eh?
But who has the time (or money) to train 400 hairdressers in Sydney? The Climate Council of course. Tony Thomas does a deep dive into the media machine that they are. They have an $8.3 million budget from donations, and a staff of 50, including 20 full time media professionals. As well as hairdressers the Climate Council trains firefighters, farmers, vets, surfers, football players, Aboriginal indentifiers, and of course “the media” itself. The team who are supposed to expose the industry lobbyists are trained by them to parrot their message. Tell your friends, if the evidence for climate change was so overwhelming, why do they need $8 million dollar professional communication machines to teach hair-dressers and journalists how to respond to skeptical questions? We didn’t need a Gravity Council or a committee to explain the science of passenger planes. For thirty years children have been bombed with the permitted climate lines at school. If Climate Science wasn’t a leaking ship sinking in the Bay of Reality, the climate cartel wouldn’t be so afraid of skeptical hairdressers.
 Tony Thomas On Climate, the Media is the MassageQuadrant Magazine The Council’s 2022 annual report boasts of its “drumbeat” of climate calamity, citing the planting of more than 22,000 stories in the media last year intended to influence “millions” of Australians. That’s 800 items a week obligingly regurgitated by stenographers identifying as journalists, plus a further 20,000 media items “supported” via third-party climate enthusiasts.[3] The Council not only spoon-feeds alarmism to reporters, it actually trains them with union help to propagate the narrative: in 2022, it teamed up with the Media, Entertainment and Arts Alliance, to provide expert advice to journalists nationwide on accurately and responsibly reporting on the climate [supposed] crisis. The engine room of the Council is its Climate Media Centre. It likes to keep its dark arts there under wraps: You won’t see the Climate Media Centre mentioned in the media, but you will have heard the voices of the dozens of everyday Australians we support” and “You won’t read about the Climate Media Centre in the news.” (Annual Report 20-21 p30), These days the Council’ has 50 staff – including close to 20 media spinners [4] Just appreciate how embedded and networked the climate meme is in the layers of government and organisations: The Council mini-mes push its messaging from multiple directions. ♦ The before-mentioned Emergency Leaders for Climate Action (ELCA) has 40 emergency workers using their credibility to lobby all levels of government, while “facilitating countless media moments”. The Council actually counted ELCA’s “countless” media mentions, citing 78,000 from the 2019-20 fire season alone. (AR 20, p16). ELCA people might be good at their emergency jobs, but their expertise doesn’t extend to the merits of reconfiguring Australia’s electricity grid and net-zero CO2 by 2035 or 2050. The Emergency Leaders also scamper around the UN’s useless COP conferences parading Australia’s fires and floods survivors as icons for the world media. ♦ Another Council success is its “Cities Power Partnership”, with about 175 councils, shires, cities and capitals signing up to push climate follies onto ratepayers. The Climate Council spends 10 per cent of its budget coaching these green-captured entities, leveraging into 69 per cent of the Australian population. These councils are now replete with “climate emergency declarations” and multiple “Sustainability Officers” on six-figure pay. The Climate Council can readily mobilise 17 local mayors to lament climate’s alleged role in the floods and fires (605 media hits). It has also packaged all ten Hunter Valley shires to spruik anti-emissions on the coalfields. The Climate Council was created by a Labor Prime Minister in 2011. It was closed by the following conservative government in 2013 whereupon it was rebirthed as a charity and funded by donors so it could continue producing Labor Green political material and supporting the industries that need Big Government support. What a coincidence… Part of their income comes from the foreign Rockefeller Philanthropy Advisors, but they have some local billionaires too. Presumably anyone standing to profit from solar, wind, batteries, desalination plants, carbon farming, eco-tourism, transmission line construction, precious metal mining, “ethical” investment, and electric vehicles has plenty of reasons to invest in the propaganda. It’s like tax-deductable advertising. April 5th, 2023 | Tags: Climate Council, Religion, Thomas (Tony) | Category: Global Warming | Print This Post | |
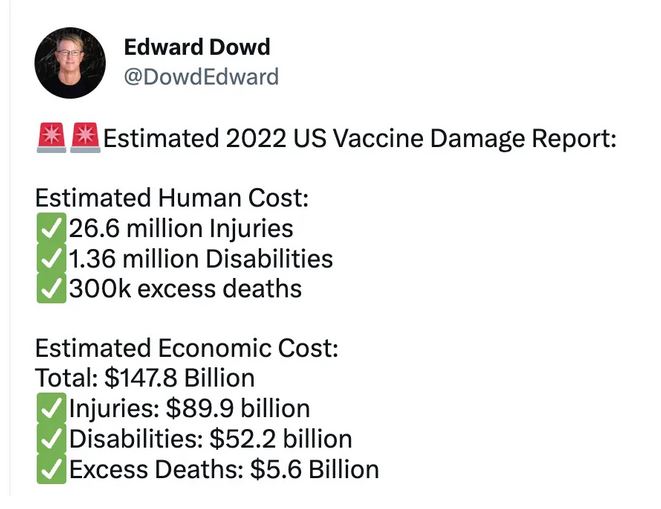
By Jo NovaThe crime of the century“Perhaps the most extraordinary thing about this state of affairs is that most Americans don’t know it’s happening.” — John Leake Ed Dowd’s Vaccine Damage Report is finally here. It looks at excess death in the healthy working age population of the US — the 148 million Americans aged 18 – 64 who are employed. Shockingly, an estimated 300,000 people have died due to Covid vaccines, and another 1.4 million are now classed as disabled. Around the world this would translate to about 5 million deaths and 46 million with disabilities and as many as 900 million people with some injury. A Rasmussen poll just out, corroborates that something awful happened in America.* It shows 10% of people in the US say that someone in their own household died and they suspect their death was caused by the vaccines. This number was spread evenly across Democrat and Republican voters showing it is not a politically driven response but probably just a sad reflection of the UPDATE: The Rasmussen poll surely reflects a protest vote, not actual deaths. All the people (from both sides of politics) who suffered harm, or saw harm, or know someone who suffered, presumably ticked the box because they felt voiceless in the face of the worst corruption. Think of it as an emergency flare over a crime scene.
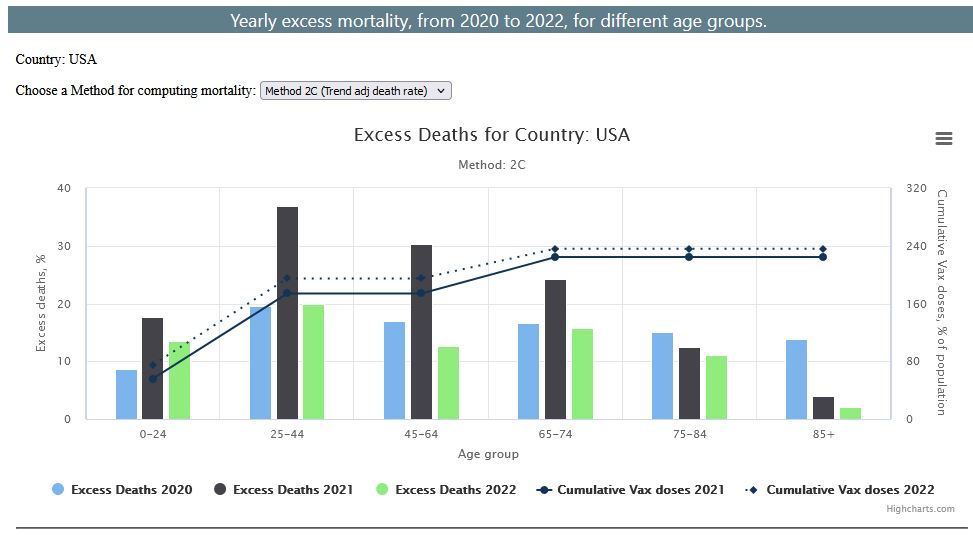
@DowdEdward via Peter McCullough This isn’t going to go away, the numbers are just too big. If one in ten lived with someone who has died, far more than that would know of them. A similar survey in January found a quarter of those polled said they personally knew someone who had died, they believed, of the vaccines. Shocking rates of injury in people in the prime of their lives:Essentially, 82% of people suffered no ill effects following the vaccine (at least as shown in this data). But about 18% suffered a mild to moderate injury. This remarkably high figure is corroborated by data on absentee rates from work in 2022 which were 29% higher than in 2019. As Ed Dowd reminds us this is off the charts — an 11 standard deviation from the norm. It’s a radioactive red hot signal. Nothing like this has occurred in the data before. Nothing like this has occurred to the workers of the USA before. Almost 1% suffered some kind of disability, and worse, 0.05 – 0.1% died — perhaps as many as 1 in 1,000 people died, and this is from the healthy 18-64 age group. It represents a 23% increase in excess deaths in this otherwise healthy group during 2021 and 2022. In his interview with Tucker Carlson a few weeks ago Ed Dowd explained then that the excess deaths were higher in the healthy working age part of the population than in the unemployed — probably due to medical treatment mandates that applied to workers and not to unemployed people. 2021 was a terrible year for people under 75Four different levels of harm were categorized, explained in this chart: 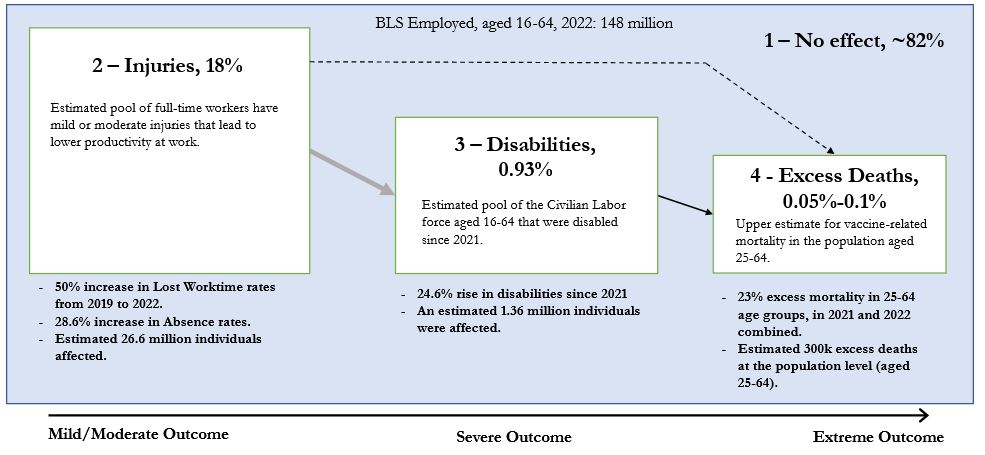 Click to Enlarge Edward Dowd is calling for support to perform this analysis on other countries, like Australia, Canada, Israel, Japan and others. Governments should be doing these assessments, but they’re not. In Australia the largest medical vaccine safety trial is being dropped only one year after it was started. 14,000 Australians died of something mysterious last year and no one wants to research it. If the vaccines were safe and effective they’d be doing a hundred studies. Instead private citizens need to do the research the government won’t. Keep reading → April 4th, 2023 | Tags: Excess Deaths, Mortality, Vaccine | Category: Global Warming | Print This Post | | |
Jo appreciates your support to help her keep doing what she does. This blog is funded by donations. Thanks!
   |
|||
|
Copyright © 2024 JoNova - All Rights Reserved |
||||


.jpg)
Recent Comments