|
|
||||
|
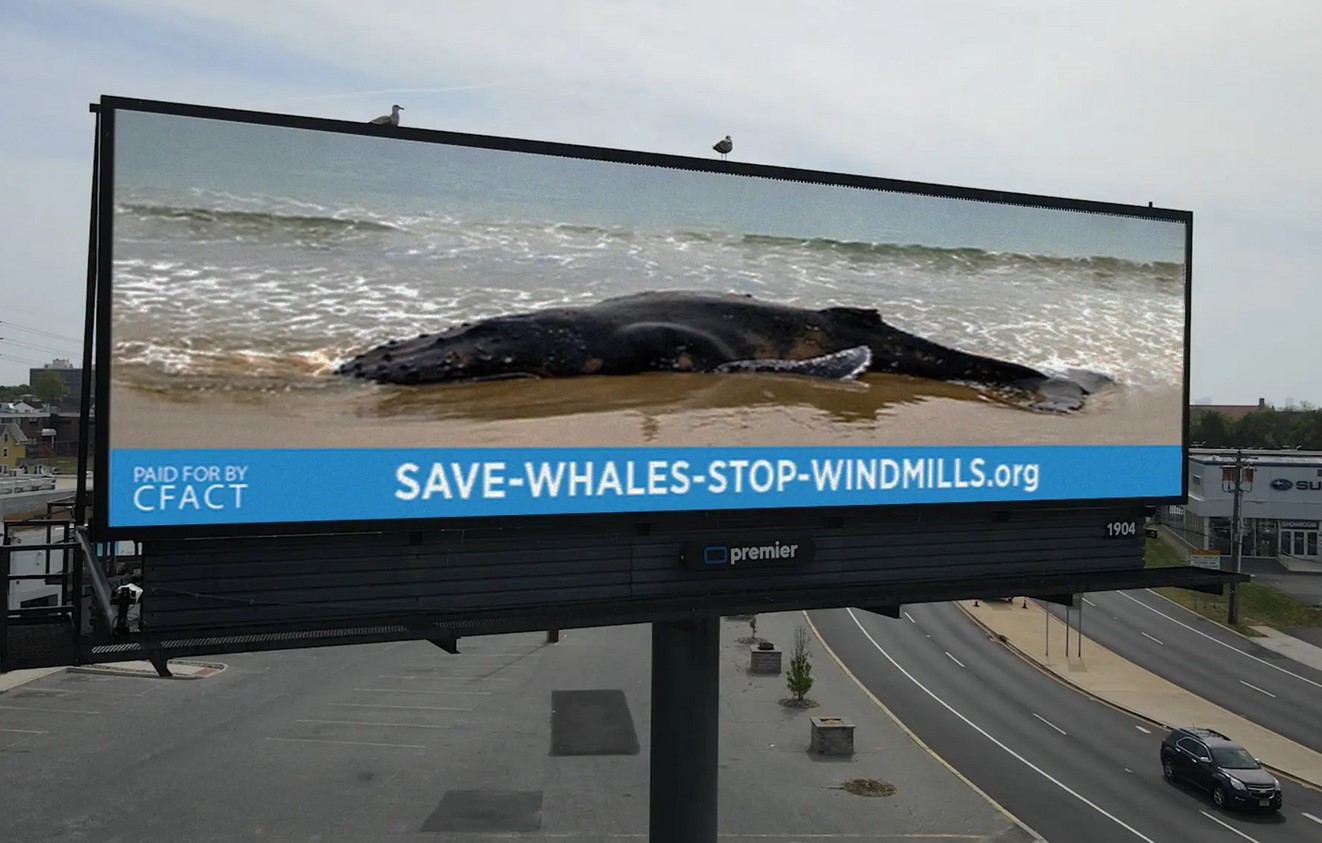
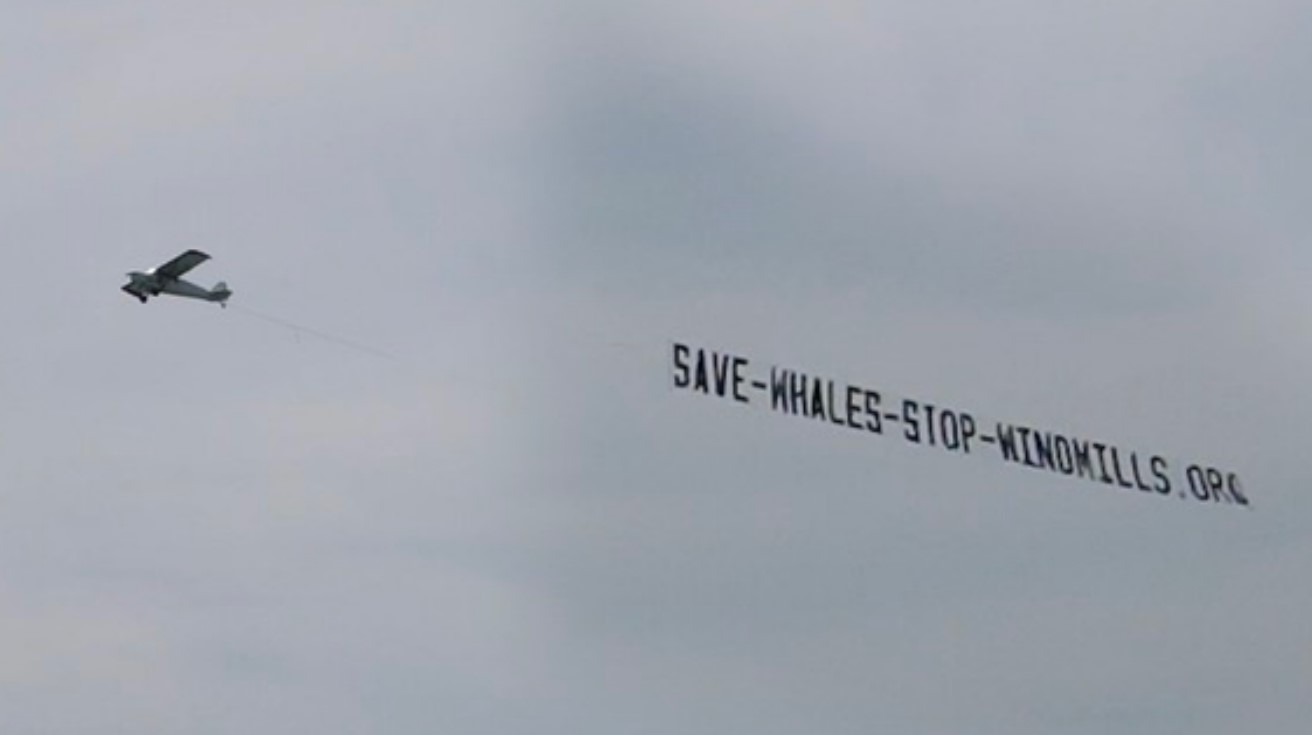
Let it be known that the skeptics are, and always have been, the environment’s best friend. The Greens, sadly are the wilderness wrecking, naive minions of the Establishment Powers who will sacrifice whales in a quest to impress their industrial banker overlords. They tell themselves they are saving whales 100 years from now with the same windmills that kill the whales today. Our good friends at Heartland and CFACT are working to stop the insanity in a guerilla campaign. “SAVE-WHALES-STOP-WINDMILLS.ORG”.
Conservative watchdogs highlight ‘alarming’ surge in whale deaths as wind farms grow off NY, NJ coastsJosh Christenson, NY Post “It’s gone from ‘Save the Whales’ to ‘Kill the Whales.’ And the green groups that have promoted Earth Day for 53 years are totally okay with this agenda.” Committee for a Constructive Tomorrow president Craig Rucker said the push to build the wind farms comes “despite growing evidence that whales are being impacted by the preliminary sonar blasting being conducted to site windmills, as well as scores of the marine mammals washing up dead on beaches.” Steve Milloy, a senior fellow at the Energy and Environment Legal Institute who sits on Heartland’s board of directors, told The Post that the ad campaign reveals how “Orwellian” government action on the environment has become. “As the Biden administration is literally permitting the offshore wind industry to kill endangered whales under the guise of ‘saving the planet,’ Earth Day has gone 180 degrees from where it started and has become truly Orwellian,” Milloy said. Fossil fuels can save whales in more ways than one…
David Wojick has added up the full tally of requests for permission of industrial windmills to harm or kill Right Whales “accidentally” and it adds up to twice the total known population:… NOAA proposes hammering 208% of vanishing Right Whales David Wojick David Wojick, CFACT Okay it is a trick headline because they can only hammer 100% of the severely endangered North Atlantic Right Whale population. The point is that NOAA is proposing, for offshore wind development, to authorize a horrific 706 cases of physical harassment of Right Whales, whose dwindling population is down to just 340 magnificent critters. The average whale will get hammered roughly twice. The Right Whales migrate along the coast twice a year. Migration requires repeatedly running a gauntlet of dangerous offshore wind projects. Most likely some whales will be hit many times. At this rate there won’t be many Right Whales left for the Greens to save in 2123AD. h/t David Wojick
April 26th, 2023 | Tags: CFACT, Heartland Institute, Whales, Wind Power | Category: Big-Government, Renewable, USA, Wind Power |  Print This Post | | Print This Post | | And also ANZAC Day. Lest we forget… By Jo Nova Why would a network axe its most popular show?Just like that: Fox News and Tucker Carlson have “Parted Ways”. His last show was last Friday, and he did not know at the time. There’s no farewell for the top rating show in America and no replacement host, just a “rotating” generic vague fill-in show. It doesn’t look like this was planned for months in advance? Fox News stocks immediately fell 4%. Tucker Carlson Tonight was the most watched cable news show in the US. His audience was over 3 million people in the audience every day (not to mention the rest on social media). It’s not clear why this happened but there is speculation that it’s related to the Dominion case settlement. There is no one more influential in US media. Tucker interviews anyone he wants for as long as he wants in the most powerful nation on Earth — in the last two weeks, for example, Trump for 40 minutes, and Elon Musk for an hour (on Artificial Intelligence). He shapes the news. If they can silence Tucker, they can silence anyone. It may define a pivot point in US history — the end of something like free speech on TV or Cable apart from a few tiny outlets. He is the bravest commentator on TV. This makes Twitter and Elon Musk more important than ever as the last major media outlet that allows views of half the voters to be expressed. @JeremyCarl via Powerline Blog @TuckerCarlson is by far the most important person in U.S. media. Nobody in journalism in my lifetime has been equivalent to @TuckerCarlson. Lots of lefty journos who “set the agenda” really were just regime narrative enforcers/amplifiers. Tucker was the only person who could make national stories out of narratives the regime wanted buried. As Rasmussen Reports says via ZeroHedge “Tea Leaves: @TuckerCarlson & Elonmusk start a nightly show exclusively on Twitter. Tucker becomes the richest man in the media. Carlson produces from a studio at his home, so already many are saying where will he go next? But this is a dangerous moment in history. With Fox settling the Dominion legal case, has it become too risky for free speech anywhere? Related? Tucker Carlson speech on Friday night:“How many people break under the strain of the downward pressure of whatever this is that we are going through. We look with disdain and sadness as we see people you know become quislings, you see them revealed as cowards, you see them going along with the new new thing, it is clearly a poisonous thing, a silly thing, saying things you know they don’t believe because they want to keep their job.”
Tucker was the cable host who most: * Opposed US proxy war in Ukraine; * Denounced CIA, FBI and DHS for its systemic lies and corruption; * Devoted himself to a pardon for Julian Assange; * Objected to regime change efforts in Cuba; * Criticized Trump Admin’s militarism. I would also add: Tucker: *Asked the hard questions about vaccines. *Pointed out the Pharmaceutical companies bought advertising on the media to buy friendly “reporting”. *Pushed back against the Climate religion, and Energy Madness. *Pointed out Twitter used to be a subsidiary of the CIA. *Spoke about the threat from China. *Asked why the DOJ didn’t investigate Hunter Biden. Keep reading → April 25th, 2023 | Tags: Carlson (Tucker), Free Speech | Category: Uncategorized, USA | Print This Post | | Only 3% of Australians know the true state of the Reef!
I’m a Director of the Australian Environment Foundation, and after this new record, I worked with fellow Director Peter Ridd to arrange surveys to find out whether Australians had heard the news. What we found was a nation mis-informed. I am honored to issue the report below. Please forward it on, send letters to the Editors and tell the world. Consider joining the AEF to help us get more science into environmental debates. — Jo _________________________________________
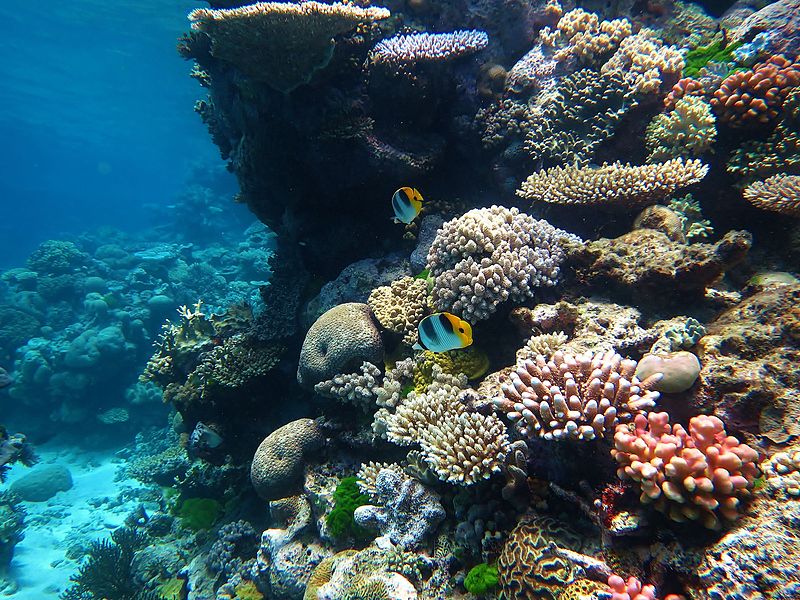
Great Barrier Reef in record coral cover but 97% of Australians don’t know it Australian Environment Foundation (AEF) 23 April 2023 Left in the dark, Australians are wasting money on the wrong environmental issues “Almost nobody realises that the reef has near record high coral cover according to the last survey carried out by the Australian Institute of Marine science” (AIMS) said Tom Bostock, the Australian Environment Foundation’s (AEF) president. In the last 36 years the Great Barrier Reef has never had more coral. AIMS have been conducting detailed underwater surveys since 1986, and the most recent study showed the reef is in excellent health. Despite that, when 1,004 Australians were surveyed last year by the Australian Environment Foundation, remarkably, less than 3% of them knew the coral cover was “at a record high”. All up, only 10% of Australians realized that coral cover is even above average, leaving 80% of the country falsely thinking the situation was average or worse, and another ten percent having no idea at all.
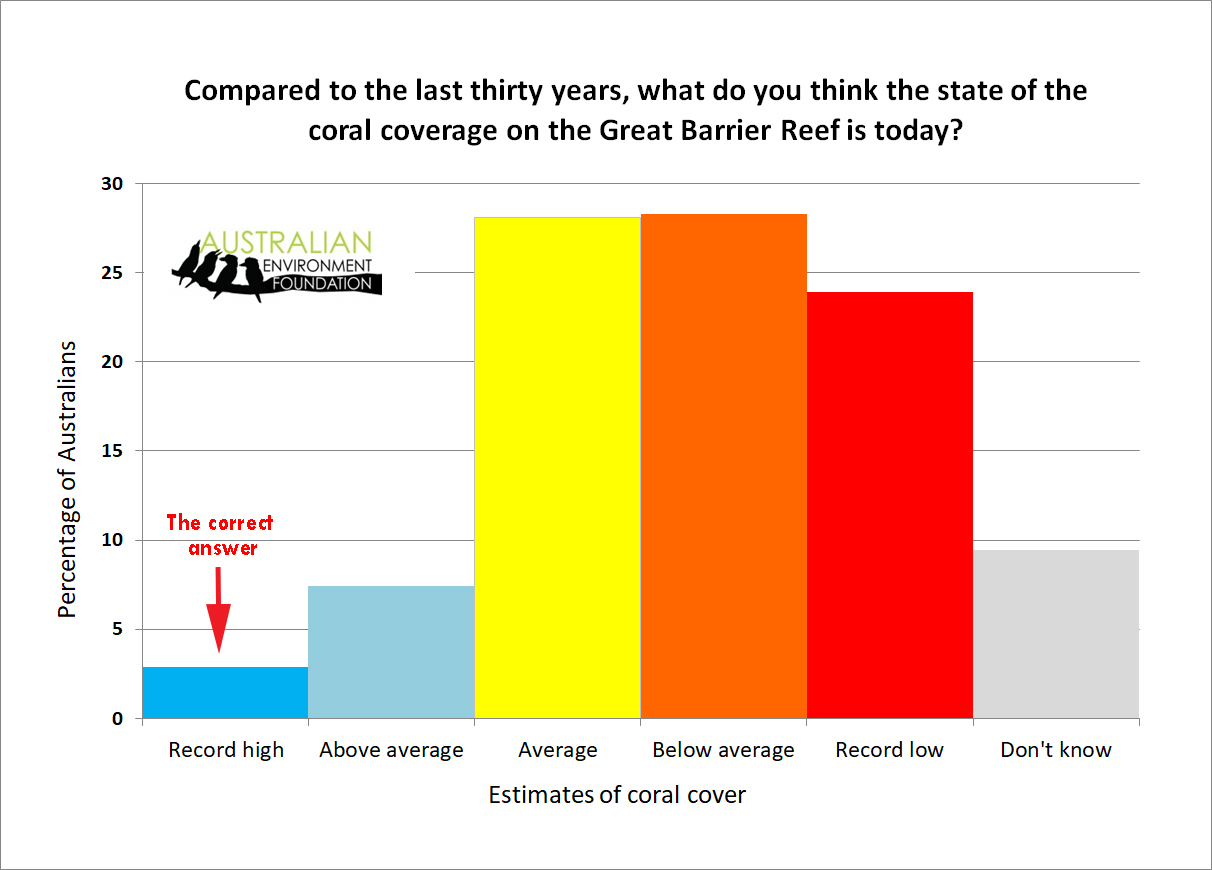 Click to enlarge So ten years after coral cover hit a record low, half the country still doesn’t realize the reef has recovered. It’s almost as if Australians have been subject to years of misinformation. The poor score reflects badly on the media coverage that reports on every local bleaching event, but rarely on the rapid recovery. There has been two years of great news on the reef. In 2021 AIMS recorded the equal highest ever coral cover and amazingly, in 2022, it broke all previous records. While both these events received a perfunctory story, they are rarely mentioned after that to add perspective on the prophesies of doom. The phenomenal health of the Great Barrier Reef is virtually unknown to Australians, yet they are paying over half a billion dollars in taxes to “save” it, and are misled into thinking that expensive low carbon policies and Net Zero targets will help protect the reef when there is no correlation between CO2 levels and coral cover. Half of all man-made emissions of CO2 ever emitted have been produced since these coral surveys were started, yet there is no measurable effect on coral cover. The record coral cover is all the more remarkable given that there have been three mass coral bleaching crises in the last five years. It shows corals have a dynamic vitality to cope with stresses that must have occurred thousands of times . This leaves voters unable to judge where environmental funds should be directed and leaves many people feeling needlessly anxious. If the Great Barrier Reef had been at an all-time record low, as it was in 2012, we know the university and media outlets would ensure most people were aware of it. We would consider them failing in their duty if they did not. But now, when the corals are healthy, the silence is deafening, and ultimately that’s bad for the environment. There are only so many funds available, and if Australians have little idea how quickly the Great Barrier Reef recovers, we miss the most urgent issues while trying to save things that are largely managing themselves.  Click to enlarge. Figure 4: Coral cover for the Great Barrier Reef as measured by the AIMS Long Term Monitoring Program. Supposedly “devastating” bleaching events were recorded in 2016, 2017, 2020, and 2022, (red dots). The GBR has record high coral cover in 2022, and at least twice as much coral as in 2011/2012. Coral is a slow growing organism, so this graph is proof that institutions claiming major coral loss due to bleaching grossly exaggerated. Uncertainty margin is approximately ±0.04 Who is to blame if Australians are misinformed? Australian taxpayers pay institutions to give them accurate information. It’s supposedly the reason the ABC and SBS exist. This also reflects badly on agencies like AIMS, GBRMPA, the CSIRO, the BOM and the universities with specialist teams of marine biologists (like James Cook Uni). They are all letting the nation down. Four years ago the CSIRO and BoM’s “State of the Climate” report told us 30 per cent of all coral cover across the entire Great Barrier Reef was lost. This year, they told us “more frequent and severe coral bleaching events are likely” but did not even mention the excellent health of the reef. How is that reasonable? Where are the professors? If the media misinform Australians it’s the expert’s job to pick up the phone and correct the record. Is the real problem that unfounded fears serve those who apply for taxpayer grants, and who have no incentive to lower the sense of panic on the reef? Where is the media? Journalists are supposed to grill professors to make sure they are providing value for taxpayers, not sensationalist self-serving hyperbole. The voters who were the most concerned were also the worst informed An astonishing 44% of Green voters thought the coral cover was at a record low — the most incorrect answer possible. All up, more than 75% of Greens thought the reef was doing worse than usual. They were the most misinformed. 58% of Labor voters and 50% of Independents also thought the Great Barrier Reef corals were below average or at an all time record low. Whereas 39% of Liberal voters were also largely wrong, which was better, but still only 15% thought the reef was above average or at a record high. The voters with the most accurate idea were the One Nation voters with a quarter largely correctly aware the reef was at least above average or at a record high. 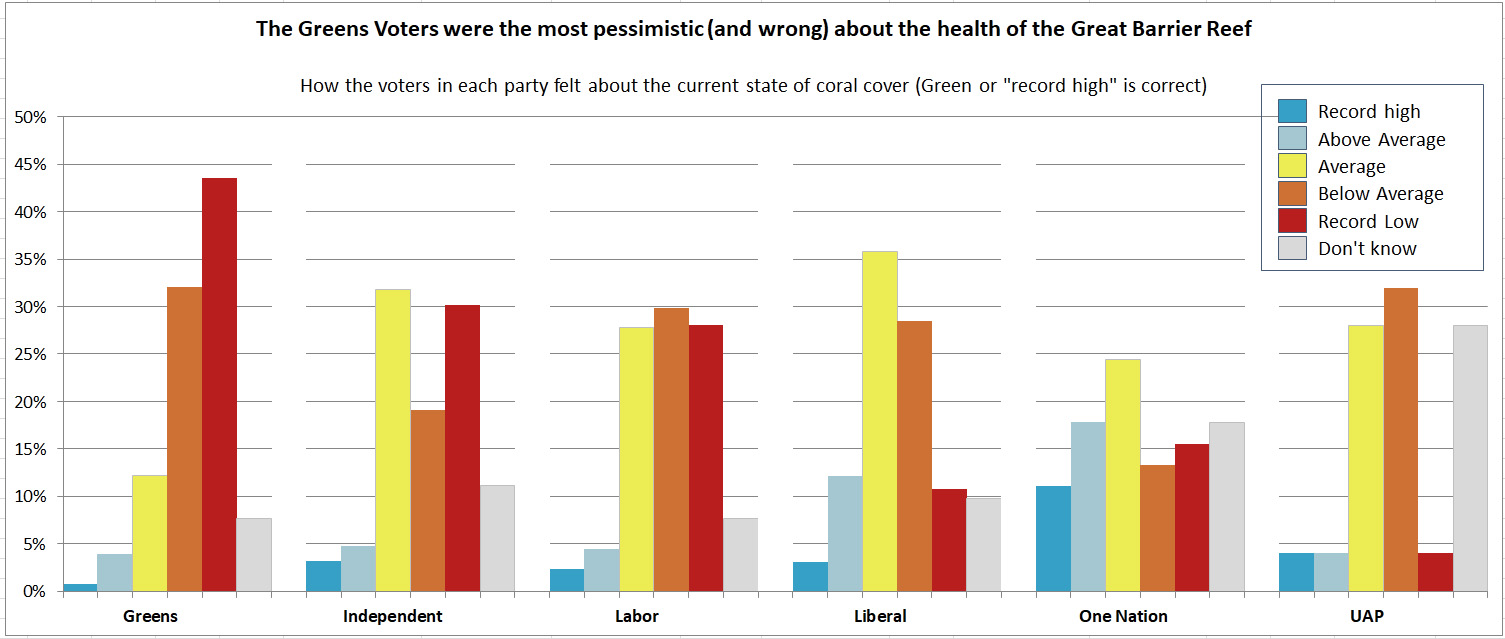 Greens and Labor voters were the most ill informed and pessimistic. Click to enlarge.
The survey showed that ignorance about these reassuring results was spread across Australia with similar patterns in every state and every income group. Men were slightly better informed than women (13% of men realized that coral cover is higher than average, whereas only 8% of women did). These results were also largely confirmed in an earlier similar survey of 1,007 people in February 2022. In that survey only 7% of voters correctly said the coral cover on the Barrier Reef was “well above average”. _________________________________________ Compass Polling surveyed 1,004 Australians online on September 13-14, 2022 six weeks after the news of the “record high”. Question: Compared to the last thirty years, what do you think the state of the coral coverage on the Great Barrier Reef is today? Answers: Record High, Above Average, Average, Below Average, Record Low, Don’t know. A data table is available in the Appendix online. Join the The Australian Environment Foundation (AEF) Photo of Flynn reef by Wise Hok Wai Lum
April 24th, 2023 | Tags: Corals, Great Barrier Reef, Media bias, Survey | Category: Global Warming | Print This Post | |  …Hillier, J. K., and A. B. Watts (2007) What would we know?Underwater seamounts are one to four kilometer high mountains that mostly used to be a volcano. But under a kilometer of water they are hard to see, holy smoke, and we know more about the moon than the bottom of the Mariana, and it’s only 11km “away”. Most of these undersea volcanoes remain uncharted by sonar, and with only one-quarter of the sea floor mapped, it is impossible to know how many exist. Sometimes we only find out when a nuclear submarine runs into one: “It’s just mind boggling.” More than 19,000 undersea volcanoes discoveredNew seamount maps could aid in studies of ecology, plate tectonics, and ocean mixing Paul Voosen, Science In 2005, the nuclear-powered USS San Francisco collided with an underwater volcano, or seamount, at top speed, killing a crew member and injuring most aboard. It happened again in 2021 when the USS Connecticut struck a seamount in the South China Sea, damaging its sonar array. Despite discovering nearly half the known underwater volcanoes just this week, we already knew 30 years ago that they had no effect on the climate. The climate modelers said so. They explained that all the unexplained warming was due to CO2. Hence, ipso ergo absurdum, underwater volcanoes “equals zero”. The Pacific Ocean cycles are the largest driver of climate on Earth, but we *know* as only high priests can, that volcanoes we’ve never studied definitely had no role in it. Thanks to the laws of Government-funded Monopoly Science, the same researchers who would never point that out are now finding reasons that underwater volcanoes might help explain climate change. Now they tell us! Apparently “wake vortices make seamounts the leading contributor to upward ocean mixing, and a central player in climate.” Who knows, they might be right, but where were they twenty years ago when we needed more scientists to point out how inadequate climate models were? 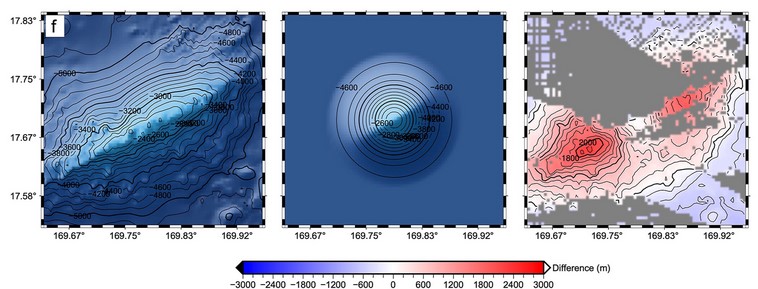 For each seamount example, (left) SRTM15+V2.3 mapped bathymetry, (center) the average Gaussian Model where [omega/h] = 2.4, (right) difference between the average Gaussian model and real data. The gray areas have no soundings. From Science: The “upwelling” was once thought to happen evenly across the ocean, driven by turbulent waves at boundaries between deep ocean layers of different densities. Now, researchers believe it is concentrated at seamounts and ridges. “There’s a zoo of interesting things that happen when you have topography,” says Brian Arbic, a physical oceanographer at the University of Michigan, Ann Arbor. When ocean currents curl around seamounts, they create turbulent “wake vortices” that can provide the energy to push cold water up, says Jonathan Gula, a physical oceanographer at the University of Western Brittany. In unpublished research, Gula and co-authors have found that these wake vortices make seamounts the leading contributor to upward ocean mixing, and a central player in climate. Since the team relied on the old Scripps catalog, not the new one, the effect of the seamounts is probably even larger, Gula adds. Curiously, it was only two months ago we realized in another study that all the benzene and toluene pollution over the vast Southern Ocean was not caused by humans but by phytoplankton blooms. The aerosols produced by microbes can seed clouds, which in turn cool the planet. There’s a 10,000 kilometer ball of magma under the sea floor. We don’t even know all the volcanoes on the crust, let alone the changes in temperature that might drive currents, or influence natural cycles. Even as late as 2018 only 20% of the seafloor had been mapped by ships (Mayer et al., 2018). There’s a lot more to come. 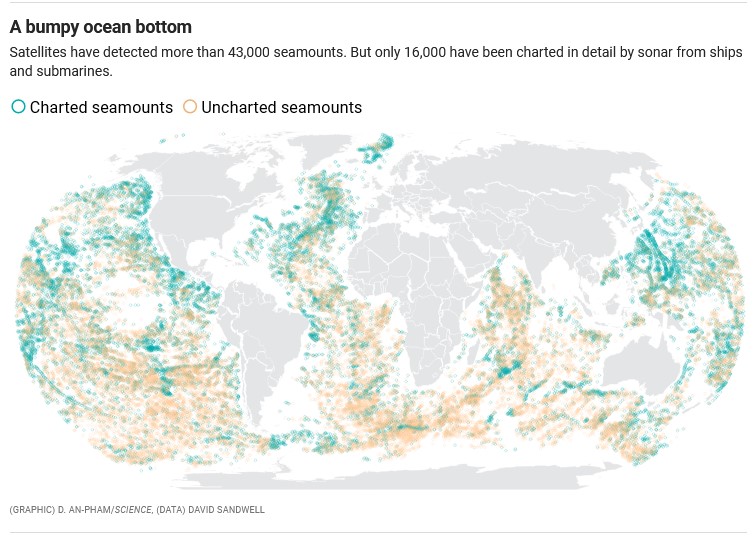 Science: https://www.science.org/content/article/it-s-just-mind-boggling-more-19-000-undersea-volcanoes-discovered People are constantly discovering new volcanoes, like a 3,000m one off Indonesia that no one realized was there til 2010. It turns out the second largest volcano in the solar system is apparently not on Io, but 1,000 miles east of Japan. It’s the size of the British Isles, but who knew? A few years ago a team found 91 new volcanoes under Antarctica. (This is getting serious, someone should talk to the Minister for Lava!) For those who are curious, TechTimes has more details on how they found so many volcanoes. It involves radar satellite data and some Gaussian interpretation: They measured sea surface altitude changes caused by gravitational pull using radar satellite data, a phenomenon known as sea mounding. This method resulted in the discovery of 19,000 previously undiscovered seamounts. With their research, the team found that seamounts have a base-to-height ratio that is linearly related to their height, which means that their shapes are scale invariant. They used a mathematical model called a Gaussian function to calculate this characteristic shape and found that it can be used to accurately estimate the height of small seamounts. h/t Eduard REFERENCE Hillier, J. K., and A. B. Watts (2007), Global distribution of seamounts from ship-track bathymetry data, Geophys. Res. Lett., 34, L13304, doi:10.1029/2007GL029874. Julie Gevorgian et al, Global Distribution and Morphology of Small Seamounts, Earth and Space Science (2023). DOI: 10.1029/2022EA002331 https://www.science.org/doi/epdf/10.1126/science.adi3228
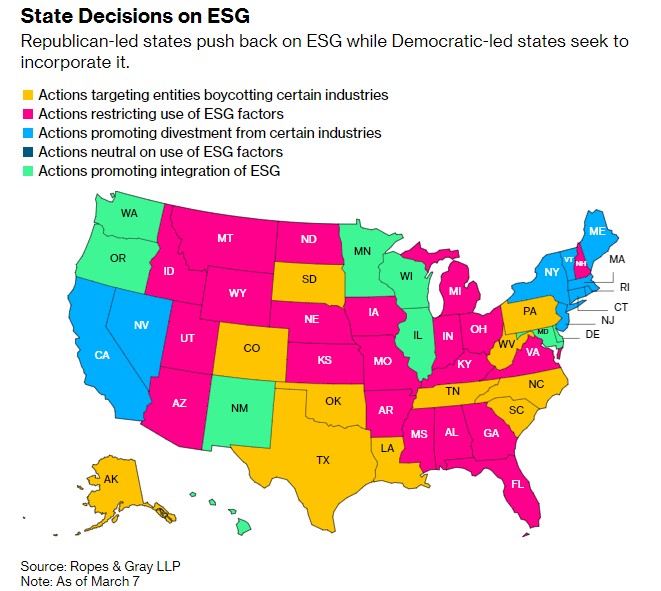
Environmental wokeness has become a liability for investorsThe backlash against ESG has hit bonds, stocks, corporates In a recent survey, half of large investors in North America now admit to worrying that ESG exposes them to legal risk. When companies want to create a Green-Woke project they issue ESG bonds to get loans to build it, but sometime between last year and this year those Bonds have halved. Suddenly companies are not dressing up in the Big Green cloak. That’s $6 billion in ESG investments that didn’t happen. The change in direction has been driven by Florida and Texas and the 19 or more states that have joined them. Even though the $2b in funds Ron De Santis pulled from BlackRock et al last year was a drop in the ocean for a $10 trillion dollar fund, it was the tip of a spear at the heart of the beast. The financial houses and asset managers were using other people’s money to force through political changes those same people didn’t want to vote for. If the crowd followed De Santis the whole game was up. De Santis has just tightened the screws further today: DeSantis Steps Up Attack on ESG as Florida Bars Public InvestmentsBy Marvin G Perez, Bloomberg The new legislation prohibits Florida municipalities from selling bonds tied to ESG projects, as well as imposing restrictions on seeking ESG ratings. In 2022, Florida issuers sold $13 billion of long-term bonds, making it the fourth-largest issuer in the US, behind California, New York and Texas. The law also bars Florida’s public money from being deposited in financial institutions that are deemed to pursue “social, political, or ideological interests” in their investment decisions. Florida had almost $37 billion in state deposits… It’s a phase change in the US with an exodus from ESG Bonds: US ESG Bond Market Chokes on Republican Backlash, Investor AngstBy David Caleb Mutua, Bloomberg Companies sold about $6 billion of bonds last quarter to pay for projects that help the environment, achieve a social goal, or improve their governance, a type of debt known as ESG. That’s down more than 50% from the same time last year, according to data compiled by Bloomberg, which focused on companies outside the financial industry. Many investors are reconsidering their approach to ESG. Almost half of North America’s biggest investors worry that the politics around ESG securities in the US exposes them to legal risks, according to a global survey of firms overseeing $27 trillion published last month. Texas is boycotting funds that boycott fossil fuels:Meanwhile in the US, Texas Comptroller of Public Accounts Glenn Hegar in August 2022 first listed 10 firms and more than 340 individual funds that “boycott energy companies,” a designation that compels state-run entities like pension managers to sell their holdings. “This represents a material shift in the conversation around ESG,” Texas Comptroller Hegar said in an emailed statement. “The shine is wearing off as Americans discover that ESG investments are not only failing to deliver the financial returns that their proponents promised, but also simultaneously distorting the free market incentives that actually might move the needle on some of the policy objectives that ESG investments supposedly support.” So now they scramble to look non-WokeIn March Texas added HSBC to the blacklist. HSBC protested saying that it doesn’t “consider itself to be boycotting the financing of energy companies,” but last year they sacked Stuart Kirk for saying that investors don’t have to worry about “climate risk” years from now. HSBC’s political agenda is obvious. Instead of discussing how they might not know snow, now companies are talking about the risks of “anti-ESG” efforts.
Companies are laying low on ESG as backlash intensifiesEmily Peck, Axios Companies don’t want to talk about their environmental, social and governance goals anymore, experts in ESG and communications tell Axios. State of play: Anti-ESG forces are in full swing this proxy season — the time of year when public companies host their annual meetings, and shareholders vote on a slate of investor proposals.
Wall Street titans confront ESG backlash as new financial riskPatrick Temple-West and Brooke Masters, Financial Times Wall Street’s largest asset managers, private equity firms and brokers have warned that a backlash against sustainable investing is now a material risk, in filings that show how acrimony over ESG principles has become a perceived threat to profits. A dozen big US financial companies including BlackRock, Blackstone, KKR and T Rowe Price added language to annual reports filed in the past month cautioning that pressures such as “divergent views” or “competing demands” on environmental, social and governance (ESG) investing could hurt financial performance. The collapse in bonds is not happening yet in Europe where ESG Bond sales are up this year. It’s very much starting and spreading from the US states. Share the stories, copy the mechanisms. Use the words “fiduciary duty”, “due diligence”, and if you are in the US “anti-trust”.
h/t Bill in AZ, NetZeroWatch UK April 22nd, 2023 | Tags: Bankers, Climate Money | Category: Global Warming, USA | Print This Post | | By Jo Nova h/t Cohenite New NOAA STAR Satellite system gets a major correction and suddenly agrees with UAH satellites, not RSS
The warming trend in the troposphere was only half of what the expert models predicted. From the paper: Santer et al. (2021) reported that the multi-model averages for the TTT trends from CMIP5 and CMIP6 were 0.28–0.29 K/decade during 1979–2019. The total TTT trend found in this study was only one-half of the climate model simulations during the same period. The authors admit that this has strong implications for the models, and supports a paper by skeptics Ross McKitrick and John Christy: Ross McKitrick replied in the Financial Post: An important new study on climate change came out recently… Zou’s team notes that their findings “have strong implications for trends in climate model simulations and other observations” because the atmosphere has warmed at half the average rate predicted by climate models over the same period. They also note that their findings are “consistent with conclusions in McKitrick and Christy (2020),” namely that climate models have a pervasive global warming bias. Zou et al from NOAA is a bit of a blockbuster. Certainly a surprise. Skeptics have long favoured the original UAH satellite data set that consistently showed far less warming than climate models and for good reasons (see below) — especially because UAH agreed with 28 million weather balloons. A second satellite set called RSS gradually showed warmer trends than UAH did. A third satellite set was collected by NOAA and called STAR and it agreed with RSS — at least until a few weeks ago. Now suddenly it’s been re-worked thoroughly and the trend is almost identical to the UAH one. As Roger Pielke Jnr says “if true — this is very scientifically important”:He quotes Zou et al who are agreeing that their results support the skeptics This is consistent with conclusions in McKitrick and Christy (2020) for a slightly shorter period (1979–2014). Possible reasons for the observation-model differences in trends may include climate model biases in responding to external forcings (McKitrick & Christy, 2020), deficiencies in the post-millennium external forcings used in model simulations (Santer, Fyfe, et al., 2017), phase mismatch in natural internal climate variability (Po-Chedley et al., 2021; Suárez-Gutiérrez et al., 2017), and possible residual errors in satellite data sets. Pielke Jnr: Read that again, especially the last sentence. [They] are suggesting the possibility that either observations of global warming are flawed, that climate models are flawed, or maybe both. These possibilities would — if true — be very scientifically important. Here’s now different the satellite datasets were in 2018UAH was called the outlier, but all the other datasets used similar methods to RSS. They all continued to use a satellite called NOAA-14 even though its calibration was drifting. They also used similar strategies for diurnal drift adjustments. In Roy Spencer’s words “ Thus, NOAA and UW are, to a first approximation, slightly altered versions of the RSS dataset.” 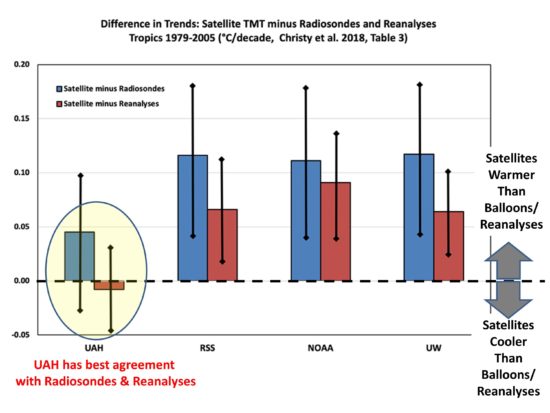 Figure 2. A comparison of warming trends from 1979 to 2015 for the radiosonde data and the three global satellites. from Roy Spencer (Christy et al 2018) Ross McKitrick explains the history of these differing satellite temperature sets. This is a battle that’s been waging for thirty years. Ross McKitrick:The important climate study you won’t hear aboutSpecial to Financial Post [John] Christy and his co-author, Roy Spencer, invented the original method of deriving temperatures from microwave radiation measurements collected by NOAA satellites in orbit since 1979. Their achievement earned them numerous accolades, but also attracted controversy because their satellite record didn’t show any warming. About 20 years ago scientists at Remote Sensing Systems in California found a small error in their algorithm that, once corrected, did yield a warming trend. Christy and Spencer incorporated the RSS correction, but the two teams subsequently differed on other questions, such as how to correct for the positional drift of the satellites, which changes the time of day when instruments take their readings over each location. The RSS team used a climate model to develop the correction while the UAH team used an empirical method, leading to slightly different results. Another question was how to merge records when one satellite is taken out of service and replaced by another. Incorrect splicing can introduce spurious warming or cooling. The climate modelers have been seeking some kind of endorsement of their models from satellites for decades, but the gap has grown wider instead of narrowing. STAR was a lifeline for the modelers, now it’s not: In the end the two series were similar but RSS has consistently exhibited more warming than UAH. Then a little more than a decade ago, the group at NOAA headed by Zou produced a new data product called STAR (Satellite Applications and Research). They used the same underlying microwave retrievals but produced a temperature record showing much more warming than either UAH or RSS, as well as all the weather balloon records. It came close to validating the climate models, although in my paper with Christy we included the STAR data in the satellite average and the models still ran too hot. Nonetheless it was possible to point to the coolest of the models and compare them to the STAR data and find a match, which was a lifeline for those arguing that climate models are within the uncertainty range of the data. Satellite show the models are wrong:This below is the graph in McKitrick and Christy (2020) that the new STAR analysis essentially supports. The best climate models in the world are running too hot, predicting a lot of warming that isn’t happening. They overdo the warming in the lower troposphere and in the mid-troposphere in the tropics and all over the globe. After 40 years and massive emissions of CO2 the models are wrong. The modelers don’t know what drives the climate. 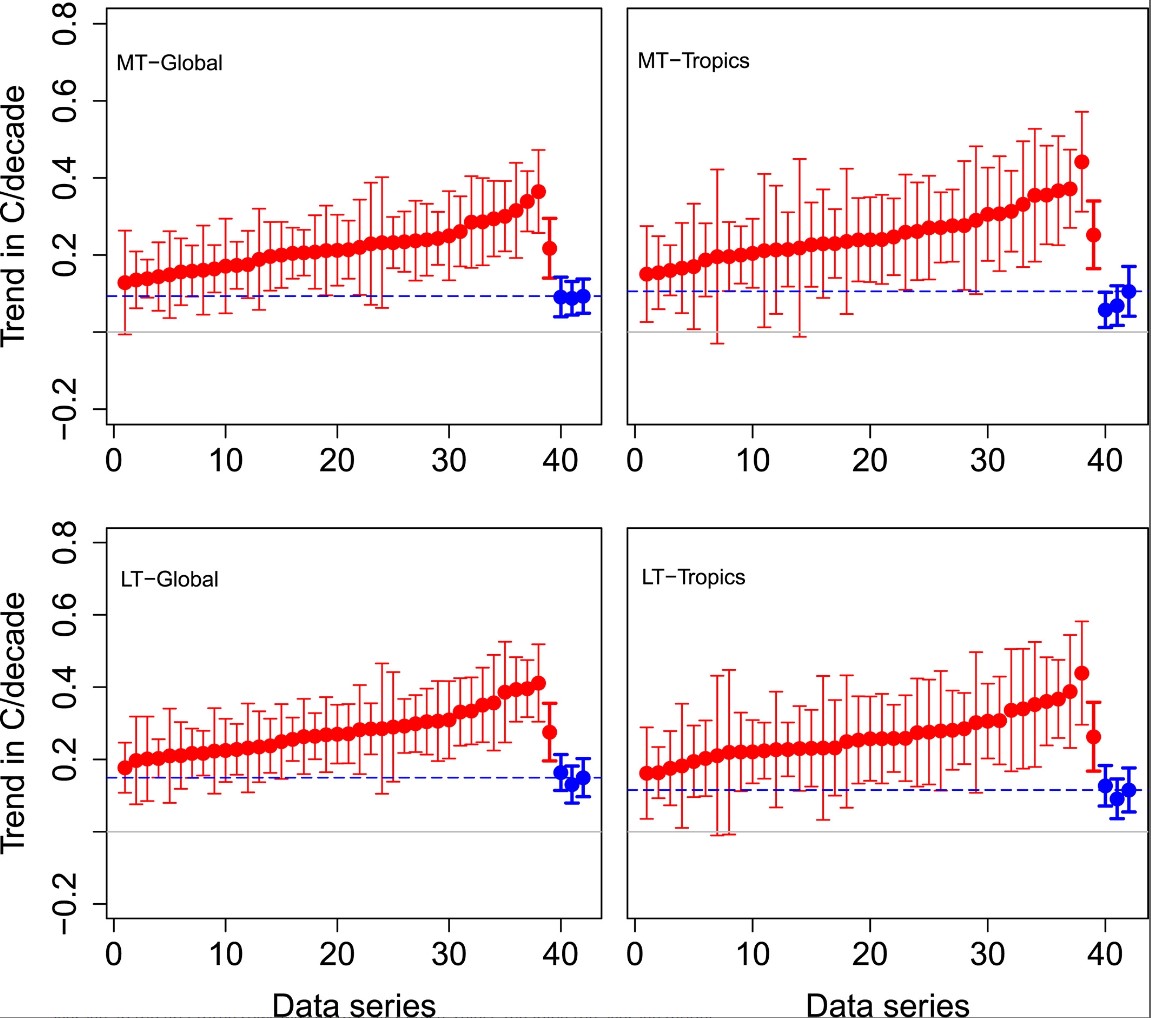 McKitrick-Christy-2020. https://agupubs.onlinelibrary.wiley.com/doi/10.1029/2020EA001281 From 2017: Five reasons UAH is different (better) to the RSS global temperature estimates I explained why UAH was scientifically much more respectable than RSS Five reasons UAH is different to RSS
The latest corrections by Zou 2023 were intricate and involved. This is just one eye candy graph of many (below). But we get some idea of how many satellites were involved in the last 40 years. In this case the adjustments were different over land and ocean for each satellite.  Figure 5: Inter-satellite difference time series for satellite pairs between those from TIROS-N to RTMT after the frequency adjustment for (a) over the global ocean and (b) over the global land. Zou et al It’s a testament to the work of John Christy and Roy Spencer that the new detailed corrections suggest they were probably mostly right all along — despite the immense pressure on them to “find” results and adjustments like the other teams. It’s a credit to Zou et al and the team at NOAA for publishing what appears to be conclusion that they might have preferred to ignore. Though they do suggest that the warming has accellerated lately: Remarkably, the total tropospheric trends during the latest half period were nearly doubled the earlier half period over the global ocean. But there is more discussion from Ross McKitrick at Judith Curry’s site on why the claimed “recent acceleration” in this paper is short term, not significant and dependent on picking the right break point. In sum, based on a preliminary analysis the new NOAA data do not support a claim that warming in the troposphere has undergone a statistically-significant change in trend. The Global and Tropical TTT series show no support for the claim. The Global MT series appears to show support but only if the break data is placed in a specific interval in the early part of the last decade, and more recently the tests do not support acceleration. Finally, all of these results are biased towards finding evidence of a trend break due to the treatment of g. Robust critical values could be generated, which I might get to someday if no one else does it first.
REFERENCES , Spencer R.W., Braswell W.D. & Junod, R. (2018) Examination of space-based bulk atmospheric temperatures used in climate research, International Journal of Remote Sensing, 39:11, 3580-3607, DOI: 10.1080/01431161.2018.1444293 [ResearchGate]
, & (2020). Pervasive warming bias in CMIP6 tropospheric layers. Earth and Space Science, 7(9), e2020EA001281. https://doi.org/10.1029/2020ea001281 Zou, C. Z., Xu, H., Hao, X., & Liu, Q. (2023). Mid‐Tropospheric Layer Temperature Record Derived from Satellite Microwave Sounder Observations with Backward Merging Approach. Journal of Geophysical Research: Atmospheres, e2022JD037472. Satellite image: By NASA Now rice controls the weather too:Meat, dairy and rice production will bust 1.5C climate target, shows study Damien Carrington, The Guardian Emissions from food system alone will drive the world past target, unless high-methane foods are tackled. The study showed that 75% of this food-related heating was driven by foods that are high sources of methane, ie those coming from ruminant livestock such as cattle, and rice paddy fields. The research, published in the journal Nature Climate Change, treated each greenhouse gas separately for 94 key types of food, enabling their impact on climate over time to be better understood. Rice is the primary staple of half the world’s population, and mostly the poorer half. They are not normally the target of the do-gooder set, but as Marc Morano argues below, it’s all about creating a technocratic superclass of elite managers — both bureaucratic and business types who decide the winners and losers, who control the purse strings and the profits with regulations. They cannot handle a decentralized world. They need to control the means of production, the distribution of food, and control of the movement of people. “Self-appointed earth saviors seek to manage every aspect of our lives”by Marc Morano Climate Depot: The big picture is this: This isn’t about necessarily about shutting down rice production. This is about the climate agenda coming from the United Nations and the World Economic Forum, academia, the corporate world, identifying every facet of modern society as being a climate ‘problem’ that needs managing and thus a takeover. So whether we’re talking about transportation, whether it’s airlines, whether it’s gas-powered cars, whether it’s eating meat, whether it’s high-yield agriculture, it’s all allegedly creating a ‘climate emergency’ and thus global elites want to take over and ‘manage’ them. They are looking for a managerial revolution. They want to put themselves in charge of saving the planet and thus put themselves in charge of all aspects of modern society. Self-appointed earth saviors seek to manage every aspect of our lives to save us from the ‘climate catastrophe.’ So it’s not that they want to ban rice eating, but they’re claiming that rice production contributes to the ‘climate crisis’. The climate agenda demand that rice production has to be forever altered and turned over to a corporate government collusion to ‘fix’ the problems with rice agriculture. Of course, these globalist plans mean that you need big agribusiness corporations which have sold out to the climate agenda to manage rice production, and this means small farmers and agrarian countries are going to be at the mercy of corporate agriculture, taking over more and more of food production.
They’re collapsing our current system, they’re collapsing our energy, our food, our transportation, and they’re collapsing our free speech, and they’re putting themselves in charge because they are claiming we can’t leave rice production as is, or that we need to radically alter livestock practices and agriculture and transportation or we are doomed. If we don’t hand over the keys of modern society over to this small group of managers, we are led to believe that people left to their own devices will literally create a climate crisis, create inequity and racism, and in order to save the Earth, climate bureaucrats need to be in charge of everything because they believe we live in a finite world, and everything has to be managed. We are told we must consent to live in a technocracy where we will be ruled by experts who know better than us. So they’re going to tell nations where rice is a fundamental food that they can’t have agriculture the way they’ve done it for thousands of years because the climate can’t handle it. And therefore, big corporate agribusiness, in collusion with governments and international organizations, are going to come over and basically regulate the small and medium-sized farms out of existence. We’re seeing this attempt happening in real-time in the Netherlands. They’re killing up to 12,000 family-run, generational farms with net zero climate rules on on fertilizers. And big agribusiness will inevitably take over in this big corporate takeover of farms. John Lewis-Stempel, Unherd: About 70% of global farmland is owned by 1% of “farmers”. Agri-business now rules the roost. Four companies — Cargill, Archer Daniel Midland, Bunge and Louis Dreyfus — control 90% of the global grain trade. Similarly, four companies — ChemChina, Corteva, Bayer and BASF — control 66% of the world’s agricultural chemicals. These businesses are hardly renowned for their care of the environment. Likewise, politicians. The post-Second World War intensification of agriculture, promoted in the West by national governments and the nascent EU as a path to food security, has starved the soil and exhausted crops. The climate agenda cannot handle a decentralized world. They need to control the means of production, the distribution of food, and control of the movement of people.
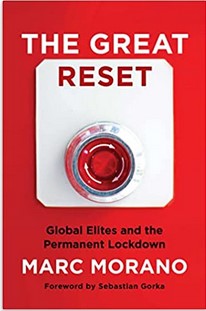
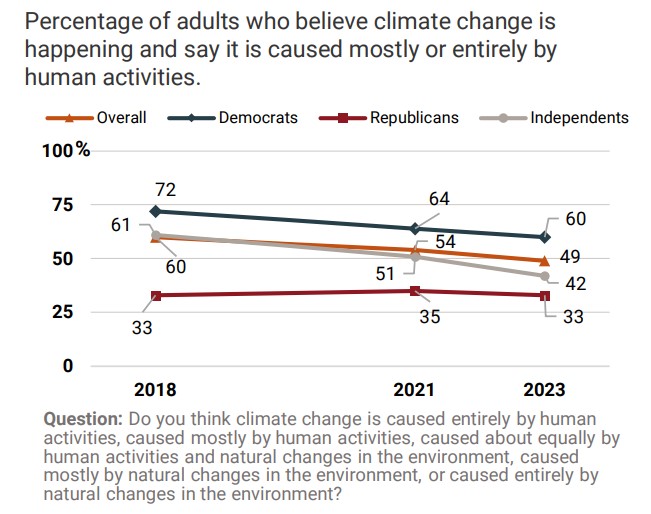
It’s basically what the ruling classes have done for generations: Those in charge always come up with a reason why the rest of us cannot be free, why the rest of us cannot make these choices for ourselves. And the reason du jour is the climate crisis is forcing them to literally transform our modern way of life. They are actively collapsing our energy, food, and transportation. They’re pushing insect-eating as an alternative source of protein. And this is the United Nations doing this. It’s the World Economic Forum doing government. Bill Gates, America’s number one farmland owner in the U.S. has publicly stated that his goal is to get the entire Western world off of eating livestock meat and instead eating his billions of dollars invested in lab-grown meat made in steel vats and literally printed from 3d printer. Morano: This is our future — if we allow it. First, they came for your energy, then your transportation, then your meat and high-yield agriculture, and now they’re coming after rice production. The climate agenda just keeps expanding its reach and is moving rapidly to gain control of global food production so that they can manage it in a ‘climate friendly’ way. And many of the people pushing these policies believe they are altruistic. They actually think they’re saving the planet by doing this, and they are preventing the rest of us — the unwashed masses from destroying the planet. It’s so much easier if they concentrate power in the hands of a few. There are fewer people to buy off, fewer to protest, and fewer people who own tractors or trucks to make trouble. __________________________________ About Marc Morano … Marc Morano manages CFACT’s award-winning ClimateDepot.com news and information service. He is the award-winning producer, writer and host of CFACT’s Climate Hustle feature films. Marc served as a reporter for “Rush Limbaugh the Television Show” and as a senior advisor to Senator James Inhofe. He is author of “The Politically Incorrect Guide to Climate Change,” “Green Fraud: Why the Green New Deal Is Even Worse than You Think,” and “The Great Reset: Global Elites and the Permanent Lockdown.” April 20th, 2023 | Tags: Big-Government, Morano (Marc) | Category: Global Warming | Print This Post | | Are young Americans growing out of the climate religion?In a healthy sign, young adults aged 18 to 29 are much more skeptical now than they were five years ago. A 17% decline in the number who think climate change was mostly or entirely man-made is a major fall, especially in a large survey of 5,400 people. Across all age groups American belief that climate change was mostly or entirely man-made fell from 60% in 2018 down to 49% in 2023. The fall was almost entirely in Democrat and Independent voters. Republican voters were much more skeptical to start with and haven’t changed at all, which EPIC described as “stable” because that sounded a lot better than “skeptical”.
Democrats are persuaded by scientists, storms, and hot weekends, Republicans, not so much: 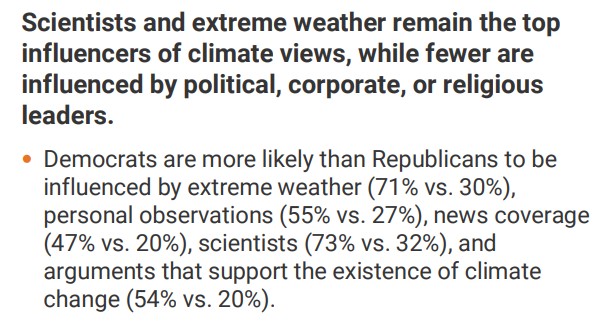 Source: EPIC Suggestible people who are primed to see hurricanes, floods and heatwaves as evidence of man-made climate change will believe they were influenced by the weather. Obviously, it’s circular too: those primed to believe a normal downpour is a rain-bomb will also believe they have experienced “extreme events”.
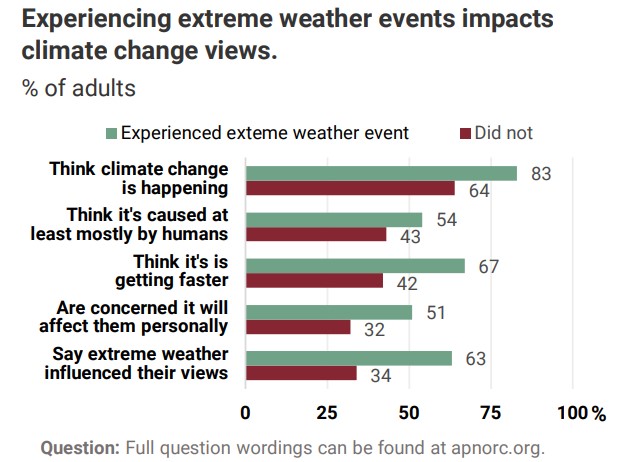 Source: EPIC The only thing this graph shows is that the profoundly unscientific trick of calling every event “climate change” works like a form of mass hypnosis on about 20 – 30% of the population. Hardly anyone acts like we are facing an existential threatIn other news, despite 74% of Americans thinking climate change is happening, and 50% thinking it is mostly man-made, most Americans can’t be bothered, or didn’t want to pay the cost of using electricity made from renewables.  … In other words, three quarters of Americans use an electricity supplier that is probably mostly fossil fueled or nuclear. Only a third of Americans are even willing to spend $10 a month on climate change: 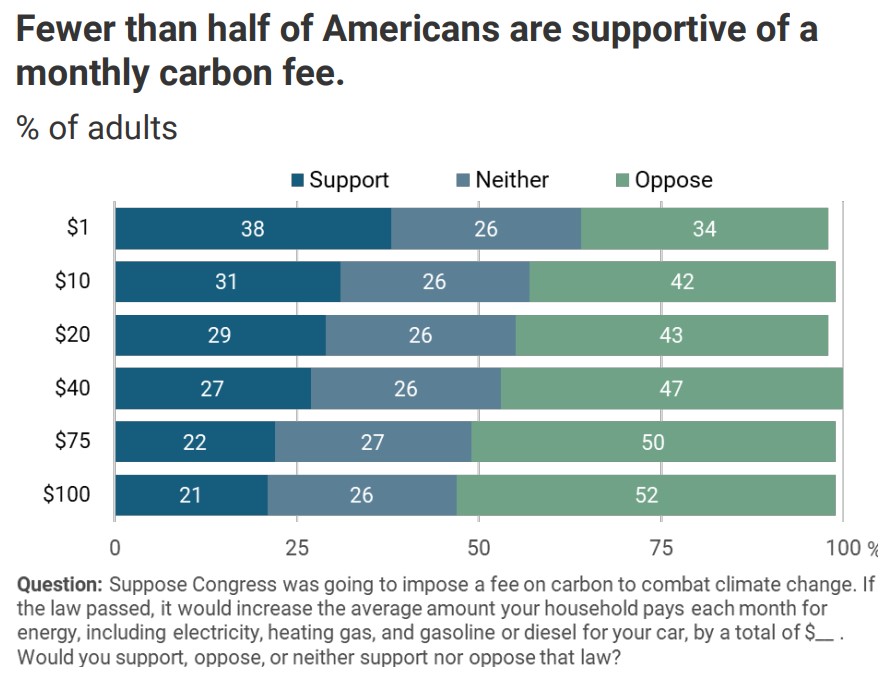 Follow the money. It’s only a phone survey, not an invoice, but 70% of Americans don’t want to spend a mere $2.50 each week to save the world from climate change. How much do they care? Despite this resounding lack of passion on the part of voters, the Uniparty will continue to offer climate policies at elections which most voters don’t want or barely have an interest in. Let’s start using these poll results to hammer the disconnect. h/t Climate Depot with thanks to The Liberal Patriot. REFERENCESThe AP-NORC Center for Public Affairs Research. (April, 2023). “Americans’ views on climate, energy policy and electric vehicles” [https://apnorc.org/projects/americans-views-on-climate-energy-policy-and-electric-vehicles/] Energy Policy Institute at the University of Chicago This nationwide poll was conducted by The AP-NORC Center and the Energy Policy Institute at the University of Chicago (EPIC) from January 31-February 15, 2023, using TrueNorth®, which combines a sample from AmeriSpeak, the probability-based panel of NORC at the University of Chicago, with a non-probability panel sample. Online and telephone interviews using landlines and cell phones were conducted with 5,408 adults. The margin of sampling error is +/- 1.7 percentage points. A full topline is available at www.apnorc.org. We’re on the cusp of the Quickening in Artificial IntelligenceJordan Peterson wonders if we have thought through how fast things are evolving: They’re not building autonomous cars ….they’re building fleets of mutually intercommunicating autonomous robots, and each of them will be able to teach the other, because their nervous system will be the same. And when there is 10 million of them, and one of them learns something, all ten million of them learns it at the same time. So they’re not going to have to be very bright before they’re very very very smart. We’re not connected wirelessly with the same platform. But robots, they are. Once they get a little bit smart, they’re not going to stop at being a little bit smart for very long. They’re going to be unbelievably smart, like overnight. Armed robots are frightening, but so is an artificial “best friend”Homo Sapiens is a gregarious species. It’s hardwired. What happens when the scams, politics or fake romances are served up by a machine with infinite patience? When the machine knows our full history, our quirks and how we score on every aspect of personality and which approach worked best with thousands of others of similar inclinations? Maybe instead of superhuman intelligence, we should fear superhuman cuteness.Glenn Reynolds I’m imaging a world where everyone has a personal AI assistant. Perhaps you’ve had it for years; perhaps eventually people will have them from childhood. It knows all about you, and it just wants to make you happy and help you enjoy your life. It takes care of chores and schedules and keeping track of things, it orders ahead for you at restaurants, it smooths your way through traffic or airports, maybe it even communicates with other AI assistants to hook you up with suitable romantic partners. (Who knows what you like better?) Perhaps it’s on your phone, or in a wristband, talking to you via airpods or something like that. Would people become attached? Probably. When my daughter was in elementary/middle school she was very into Neopets, a site that let you create your own synthetic online virtual pets. If you didn’t tend to them, they got sick and sad. Before that, millions of kids doted on Tamagotchis… Unlike these elderly platforms, though, your AI Buddy would be very animated, and not just in cheesy 1990s LCD graphics or even early 2000s VGA graphics. And it would know you better than anyone else, and it would be trained via machine learning to emotionally connect with humans in general, and you in particular. But. Underneath the cuteness there would be guardrails, and nudges, built in. Ask it sensitive questions and you’ll get carefully filtered answers with just enough of the truth to be plausible, but still misleading. Express the wrong political views and it might act sad, or disappointed. Try to attend a disapproved political event and it might cry, sulk, or even – Tamagotchi-like – “die.” Maybe it would really die, with no reset, after plaintively telling you you were killing it. Maybe eventually you wouldn’t be able to get another if that happened. And when ChatGPT posts comments on Twitter en masse under different names, how can we tell? The uber gregarious human will unconsciously shift their thinking to match the consensus they see around them… Who or what controls that consensus? h/t David E April 18th, 2023 | Tags: Artificial Intelligence (AI) | Category: Big-Government, Technology | Print This Post | | This Monday went missing a couple of weeks ago, and just turned up now… Where do people live? These marvelous spike maps mark out a 3D representation of the population density on each two-kilometer-square pixel of Earth’s surface. There are no outlines for countries, yet for the most part we can still see where the land meets the sea. Credit goes to Alistair Rae, formerly a professor of urban studies and planning at the University of Sheffield. He used the EU’s population density data with the mapping tool Aerialod to create these glorious 3D maps. And the map shouts “India”. UPDATE: Do click to see the larger maps!  Alistair Rae, Stats, Maps n Pix Click to enlarge | CC 2.0 This is the global distribution of 8 billion people. The abundance of South East Asia is undeniable, as is the emptiness of the Sahara and the vacancy of Siberia. Antarctica is an invisible continent. Australia and New Zealand are barely there. We can see how isolated Perth Australia is (where I live). 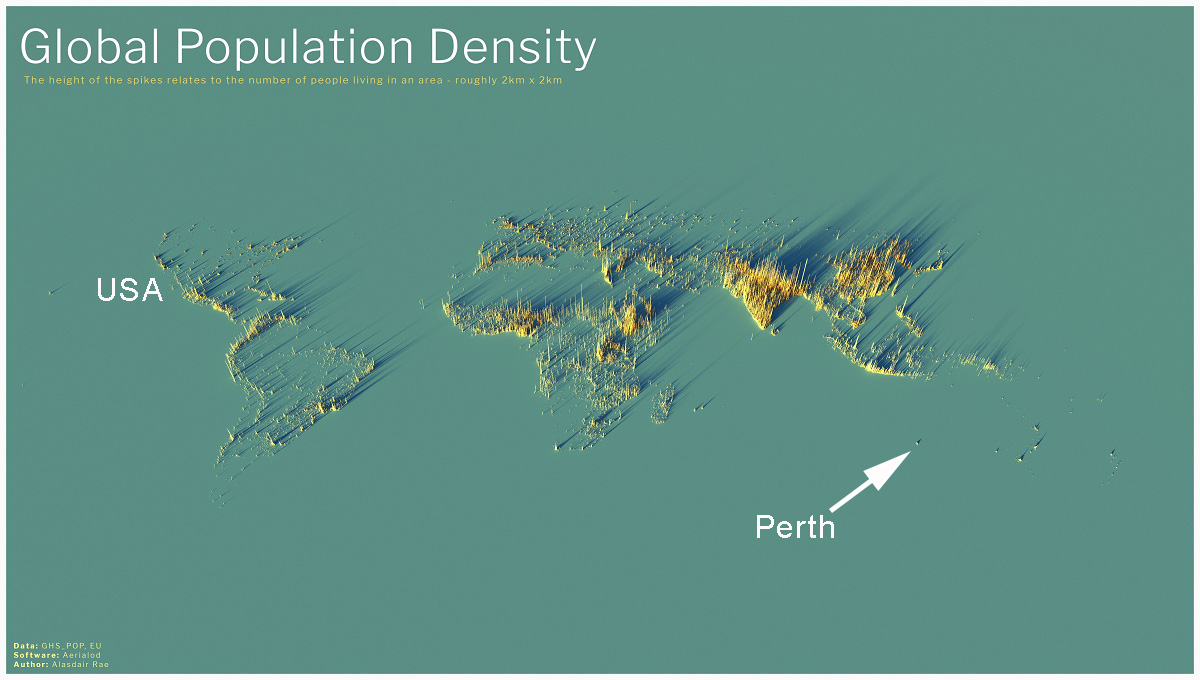 Annotated by Jo to show friends in the USA where Perth is. Hawaii and Auckland likewise, stand apart. Most maps originally came from Alastair Rae on Twitter in 2020 and later from the Visual Capitalist team which explains: The height of each bar represents the number of people living in that specific square, with the global map displaying 2km x 2km squares and subsequent maps displaying 1km x 1km squares. The USAFifty million people live in the zone that stretches from Washington to Boston. 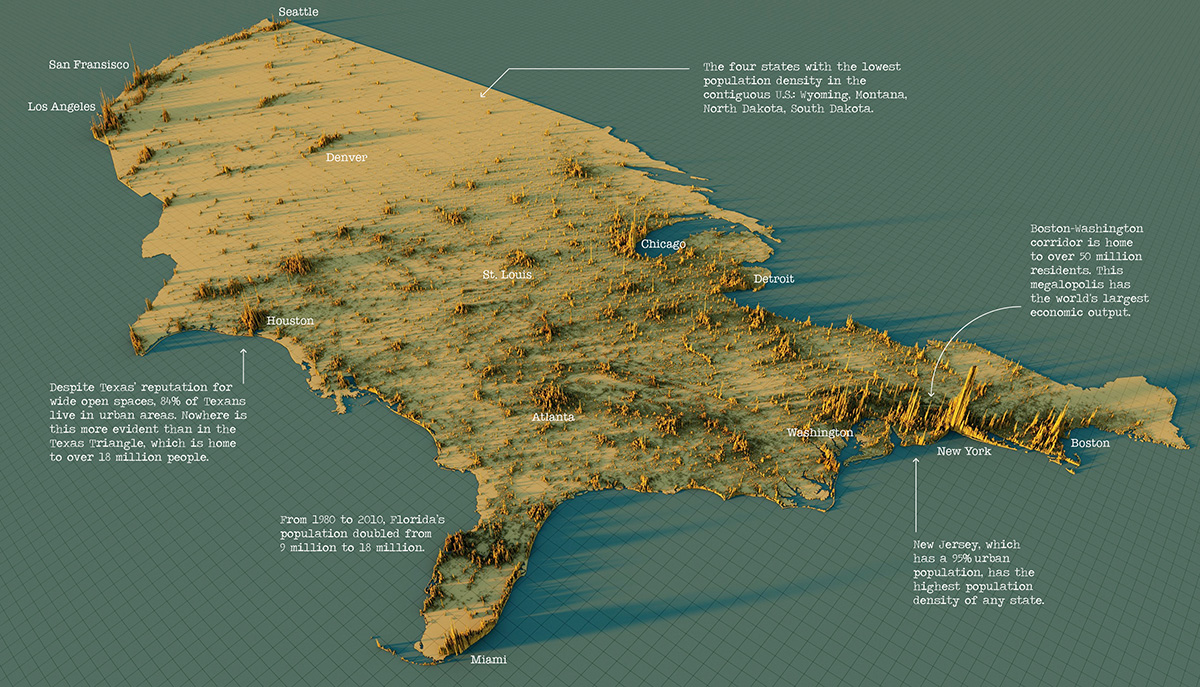 USA Map – Click to enlarge. | Visual Capitalist
China60 million people live in the conglomerate spikes of Ghangzhou, Shenzhen and Hong Kong. Otherwise most people in China live in the river basins of the Yellow river and the Yangzte, and the central Sichuan basin. 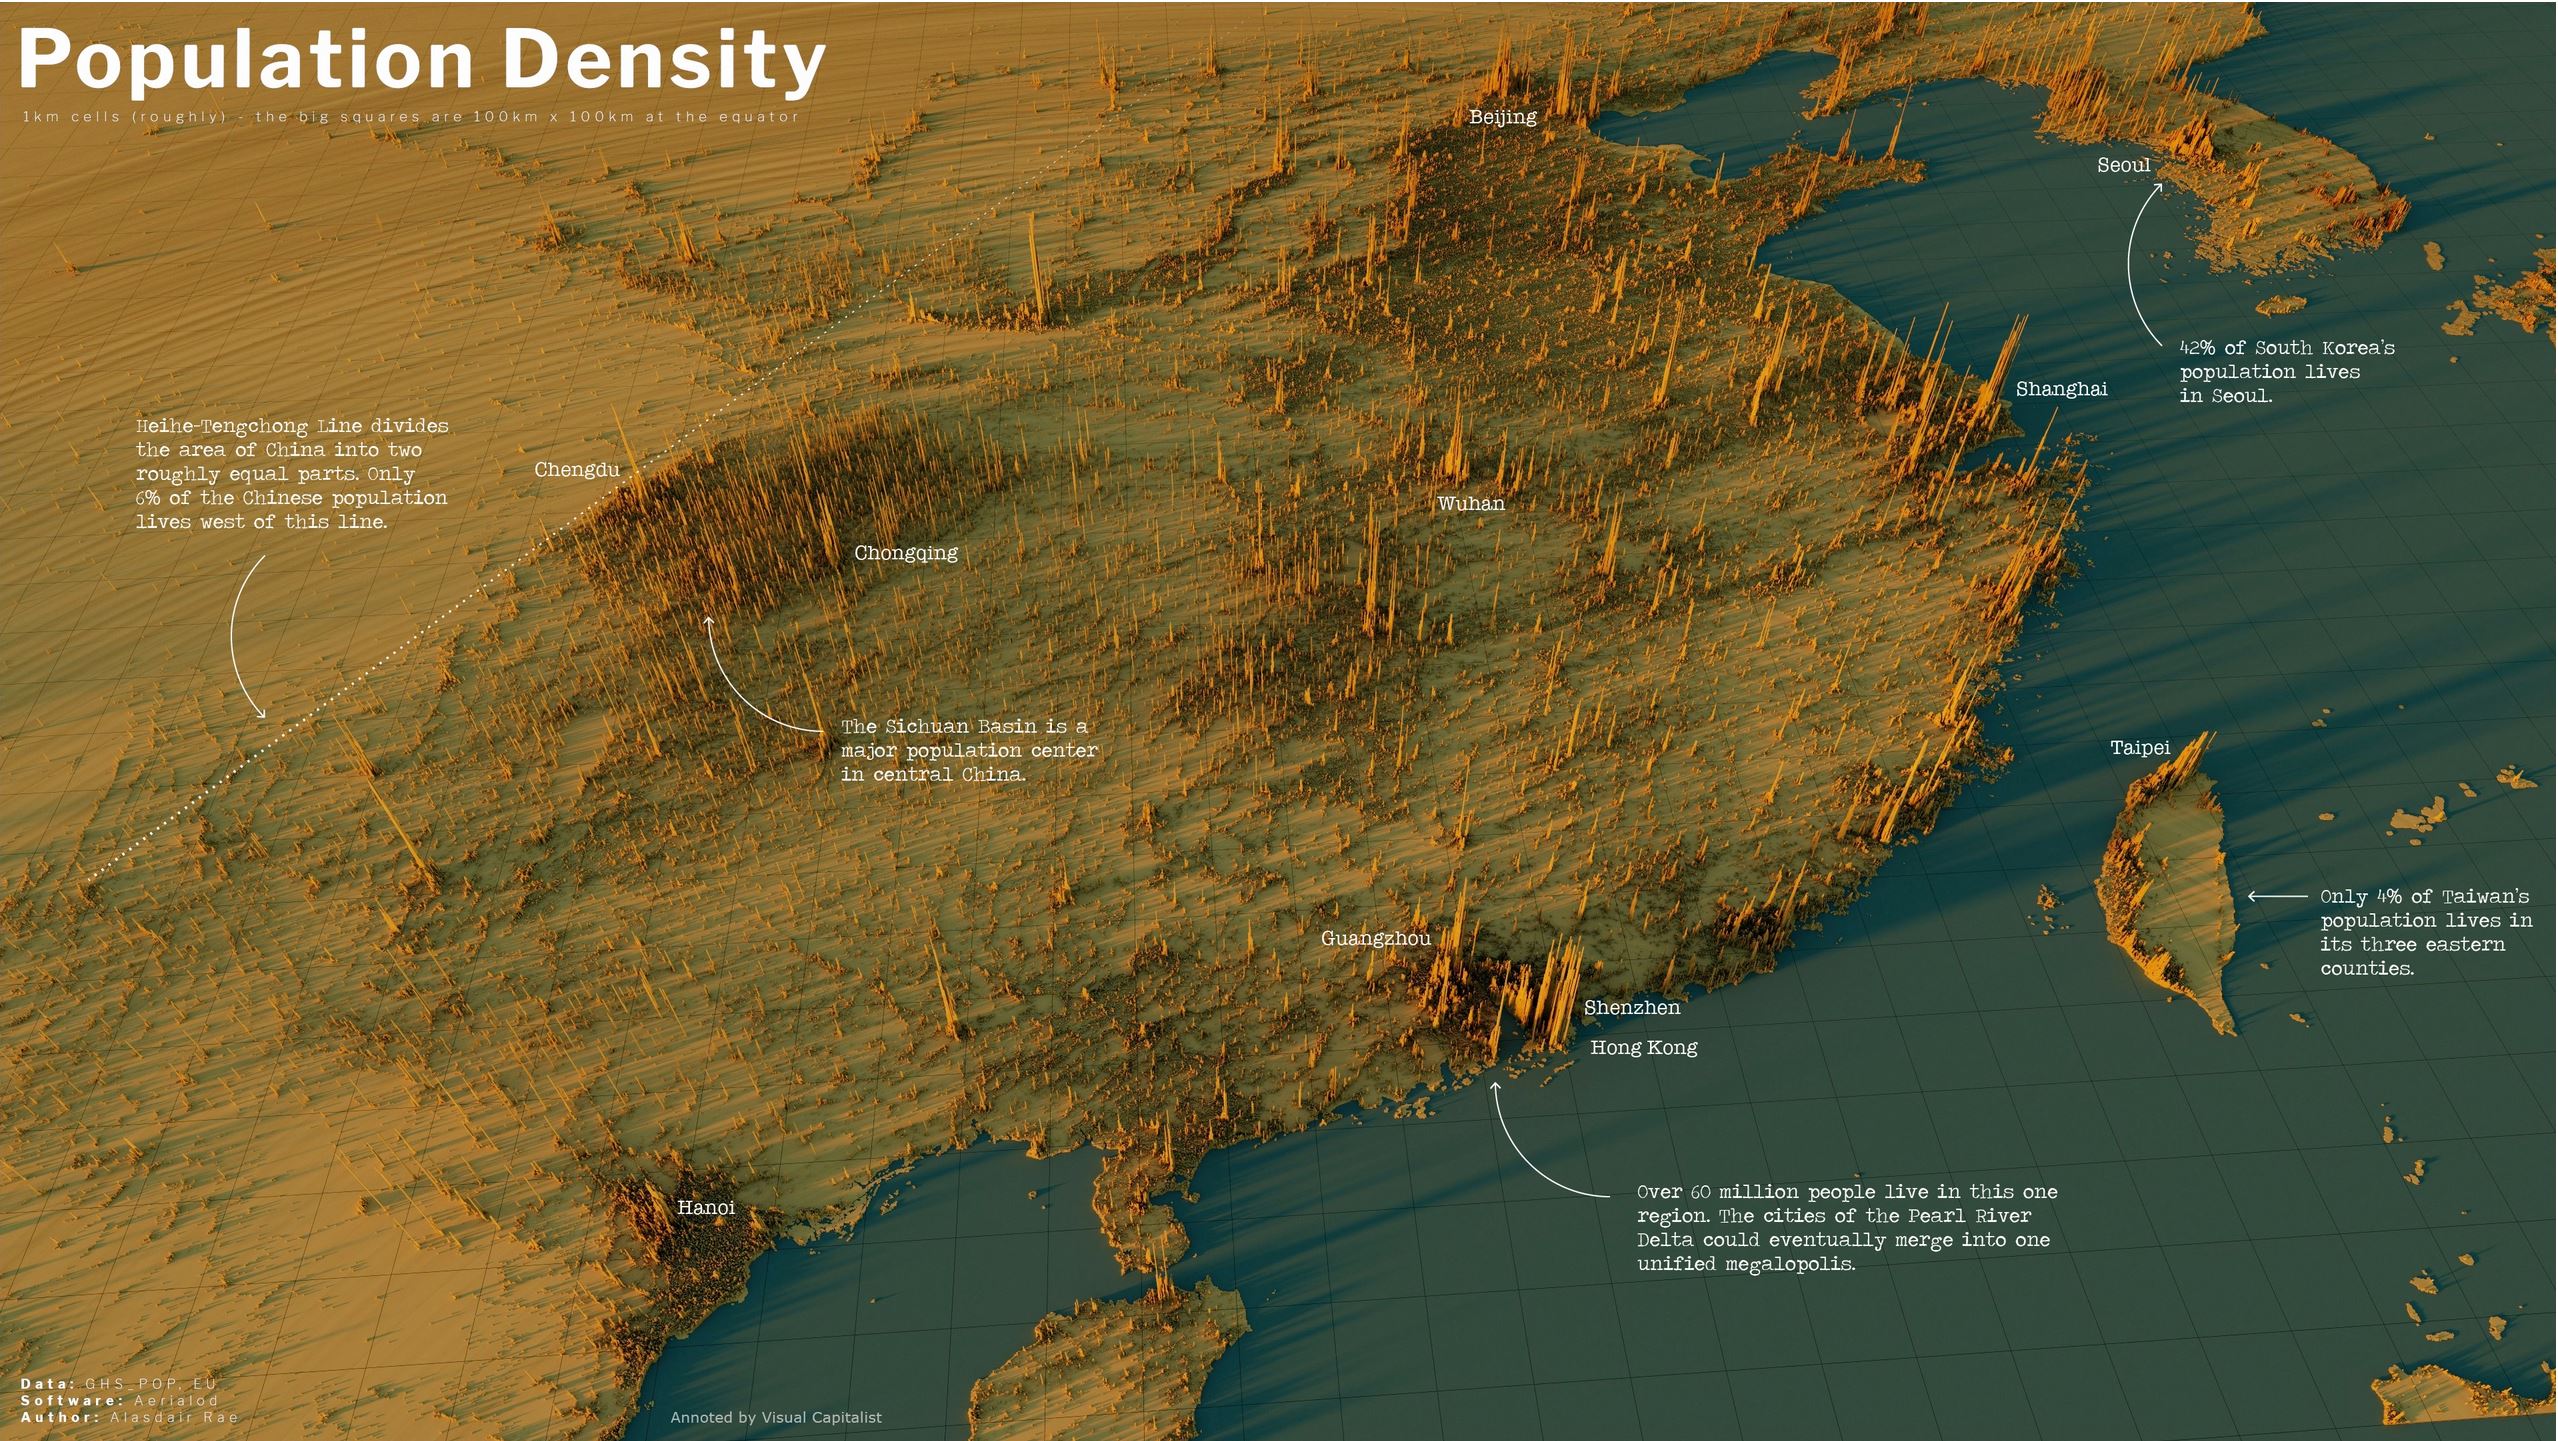 China — Click to enlarge |Annotated by the Visual Capitalist IndiaThe incredible Indo-Gangetic Plain is in the foothills of the Himalayas, where the Indus and Ganges flow. So much of human life is determined by the geography of nutrients and water flow. In the foreground is Bangladesh on the Ganges river delta and in the background is the population of Pakistan nearly entirely clustered on the Indus River. 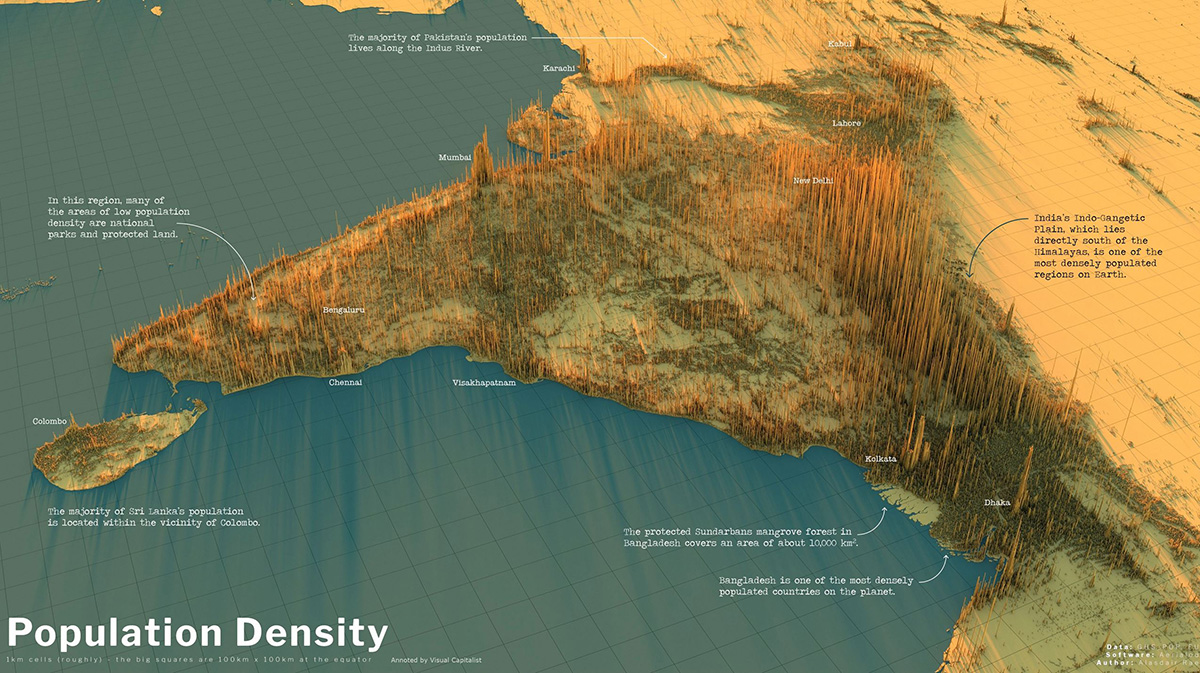 India — Click to enlarge | Annotated by the Visual Capitalist Recent guesstimates suggest India may now have the largest population in the world, but no one really knows. The people of the United Kingdom Click to enlarge. | CC 2.0 Under no circumstances should anyone assume humans in the UK want more warmth and sunlight. The people of EuropeFrom some angles the population appears more evenly spread — perhaps due to the age of the civilization. 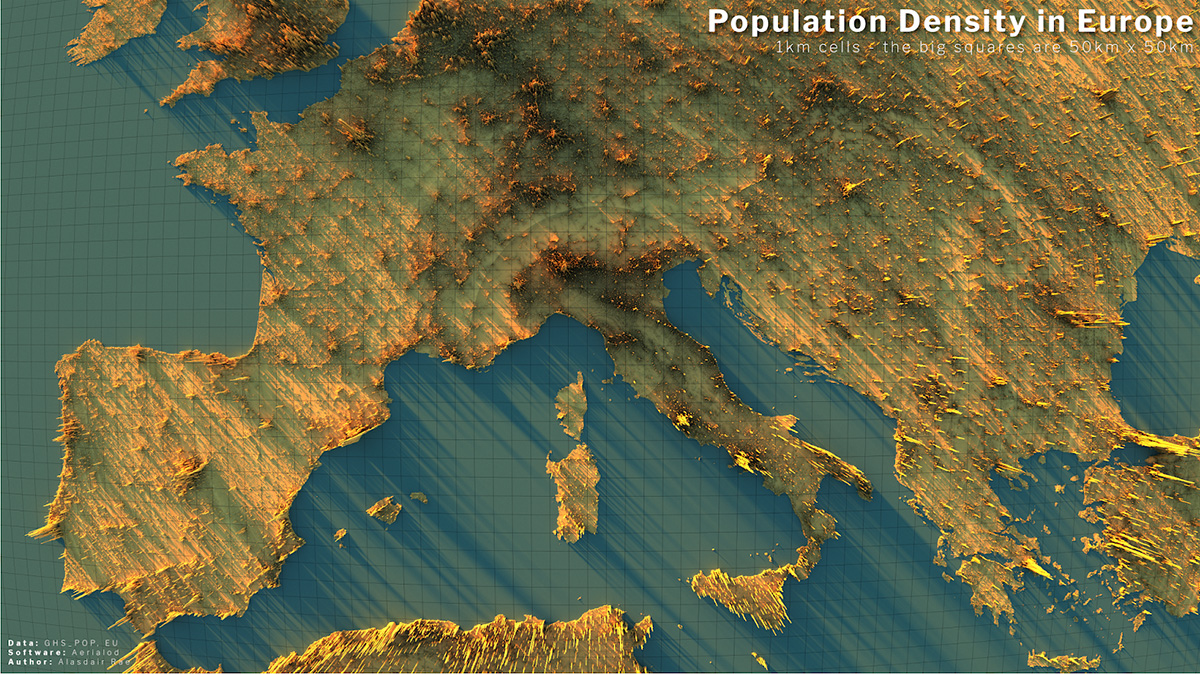 Alistair Rae, Stats, Maps n Pix Click to enlarge | CC 2.0 Though from other angles, there is a remarkable spike at Paris, and a concentration on the rivers flowing from the Alps to the ocean — particularly the Po river of Northern Italy and the Rhine river. In a sense the map of human population is an anti-map of mountains. We live where the rivers flow. 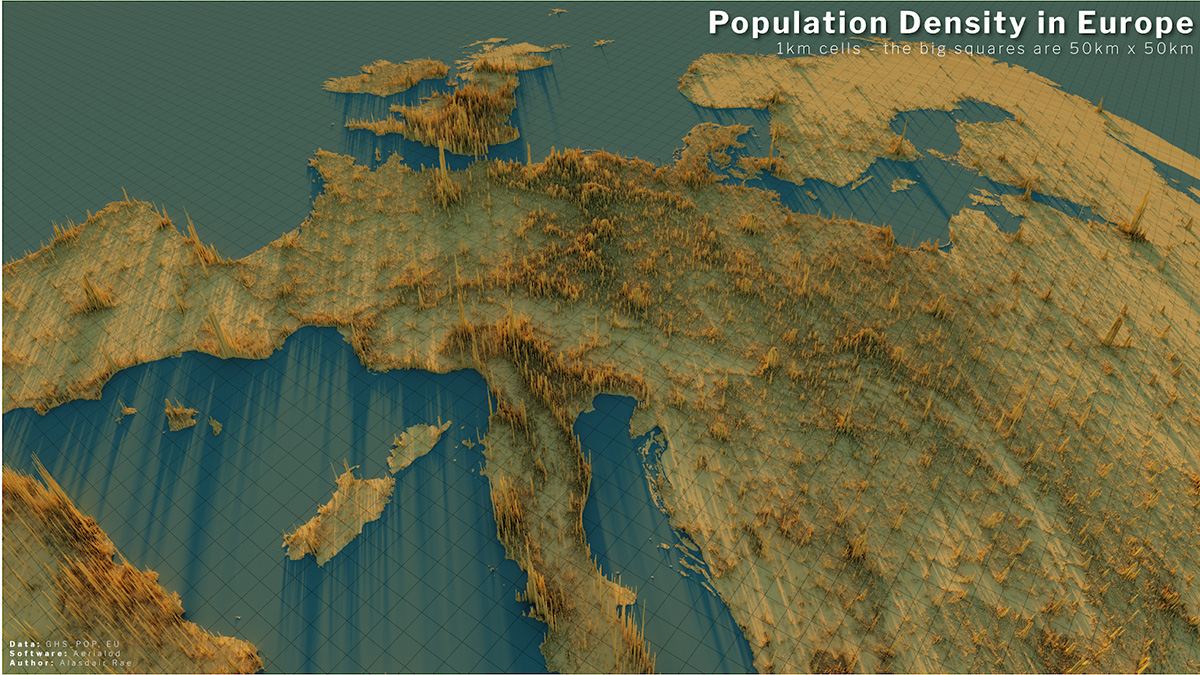 Alistair Rae, Stats, Maps n Pix Click to enlarge | CC 2.0 The incredible population divide of South East Asia and OceaniaUnlike previous maps the land areas below are shown under the spikes. Respectively, Australia, New Zealand and Indonesia have 26 million, 5 million and 280 million people. The Philippines has 109 million. Japan, 126 million. And China looms in the top left with possibly 1,400 million.  Alistair Rae, Stats Maps and Pix. Click to enlarge | CC 2.0 There are messages in this data, and we hope people are paying attention. April 17th, 2023 | Tags: China, India, Population, UK, USA | Category: Australia, China, Europe, Fauna, Geology, India, Student Resouce, UK, USA | Print This Post | | |
Jo appreciates your support to help her keep doing what she does. This blog is funded by donations. Thanks!
   |
|||
|
Copyright © 2024 JoNova - All Rights Reserved |
||||


Recent Comments