|
|
||||
Imagine if the national postal service had secret blacklists of people whose mail “should be lost”?
In this case the “posties” are private organizations, but to all intents and purposes, their network connection and obedience to Big-Government made them, in effect, another branch of the government. The government wasn’t paying the postie direct, but it protected the monopoly of the corporate postie team and gave them a legal loophole to hide in, and the media outlets stopped anyone criticizing the government. It was a Pravda-KGB consortium with filters that worked at light speed, but hidden.
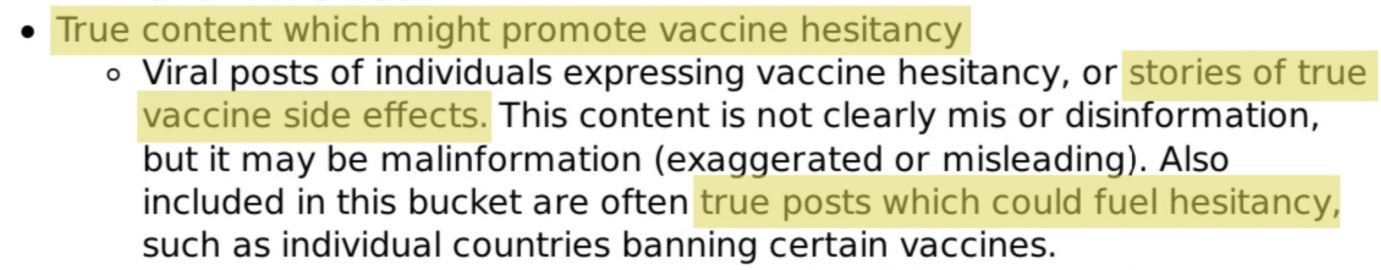
Where would we be if Elon Musk hadn’t bought Twitter?In the latest round of Twitter Files, Matt Taibbi shows how Twitter was not just censoring things that would later turn out to be true, but things it already knew to be true. The truth can be malinformation you see — it might influence people not to take a medicine that Twitter has decided they should take. For the last few years, your friends and families medical decisions have been made by a quasi government collective. The only people with informed consent were the censors. As Taibbi says malinformation is just a euphemism for “true but inconvenient.” We can all speak with one voice comrade! The GEC voice…It’s no accident why commentators everywhere seem to shift messages together like a school of herding fish. The censorship industrial complex is not just the government, and the media, and the social media giants but also some of the non-government organisations that once upon a time were supposed to be watchdogs of the government. At the centre of this information cabal was the “Global Engagement Center” (“GEC”) — which was established by Barack Obama with Executive Order 13271. This was in 2015-2016 and marked a shift from managing “counter terrorism” to the much broader “disinformation”. GEK decides who’s on the blacklist, and the lists are looong…
From Matt Taibbi on Twitter — “the Censorship-Industrial Complex.”But Twitter was more like a partner to government. With other tech firms it held a regular “industry meeting” with FBI and DHS, and developed a formal system for receiving thousands of content reports from every corner of government: HHS, Treasury, NSA, even local police. Emails from the FBI, DHS and other agencies often came with spreadsheets of hundreds or thousands of account names for review. Often, these would be deleted soon after. We came to think of this grouping – state agencies like DHS, FBI, or the Global Engagement Center (GEC), along with “NGOs that aren’t academic” and an unexpectedly aggressive partner, commercial news media – as the Censorship-Industrial Complex. NGOs ideally serve as a check on corporations and the government. Not long ago, most of these institutions viewed themselves that way. Now, intel officials, “researchers,” and executives at firms like Twitter are effectively one team – or Signal group, as it were.
Michael Shellenberger went with Matt Taibbi to Congress and summed it up on his own Substack: Exposed: America’s Secret Censorship-Industrial ComplexThe censorship industrial complex combines established methods of psychological manipulation, some developed by the U.S. military during the Global War on Terror, with highly sophisticated tools from computer science, including artificial intelligence. The complex’s leaders are driven by the fear that the Internet and social media platforms empower populist, alternative, and fringe personalities and views, which they regard as destabilizing. Federal government officials, agencies, and contractors have gone from fighting ISIS recruiters and Russian bots to censoring and deplatforming ordinary Americans and disfavored public figures. Importantly, the bar for bringing in military-grade government monitoring and speech-countering techniques has moved from “countering terrorism” to “countering extremism” to countering simple misinformation. The government no longer needs a predicate of calling you a terrorist or extremist to deploy government resources to counter your political activity. The only predicate it needs is simply the assertion that the opinion you expressed on social media is wrong. You are free to say nice things about the government:… increasingly, the censors say their goal is to restrict information that “delegitimizes” governmental, industrial, and news media organizations. The cartel wants to protect the industry and media from being “delegitimized” too. They are all assets in the same mafia-style organization. Disinformation isn’t the threat to Democracy, industrial fact-checkers are: Jefferson’s ideas still ring true today. In a free society we don’t mandate truth, we arrive at it through discussion and debate. Any group that claims the “confidence” to decide fact and fiction, especially in the name of protecting democracy, is always, itself, the real threat to democracy. For hundreds of years, the thing that’s distinguished Americans from all other people around the world is the way we don’t let anyone tell us what to think, certainly not the government. The First Amendment, and an American population accustomed to the right to speak, is the best defense left against the Censorship-Industrial Complex. If the latter can knock over our first and most important constitutional guarantee, these groups will have no serious opponent left anywhere. If there’s anything the Twitter Files show, it’s that we’re in danger of losing this most precious right, without which all other democratic rights are impossible. Wouldn’t true information be bliss, –Rauiri hat tip to KP, JB, Honk R Smith, Tombo, Beth the serf, John Connor II, Richard C. Censored logo: Piotr VaGla Waglowski March 11th, 2023 | Tags: Big-Brother, Censorship, Free Speech | Category: Academia, Big-Government, Free Speech, Global Warming, Human Rights, USA |  Print This Post | | Print This Post | | Many Australians face a 20% rise in their electricity bill this coming winter, so it seems odd that the AEMO* forgot to put the price of the cheapest source of electricity in their last quarterly report. The bid-setting prices for brown coal have been some of my favourite graphs, but this quarter, for the first time a whole energy source disappeared. It would only be another 2 digit number in a 69 page report, yet the average winning bid of brown coal generators on our national grid last quarter is not even mentioned? The nation faces major decisions about whether to continue to try changing global weather with our power plants. You would think Australians would like to know which fuel produces the cheapest electricity and by exactly how much? I mean, what’s the true cost of cooling Australia by a thousandth of a degree in 2100? Perhaps the AEMO didn’t like that skeptics spread the message that brown coal could still generate electricity for less than 4c/KWh, or that hydro and gas were seven times more expensive? After all, the head of the AEMO — Daniel Westerman — says we must ramp up renewables to avoid blackouts. I’m sure the AEMO doesn’t want to misinform Australians so I decided to help them by adding in last years brown coal prices to this quarters graph instead: 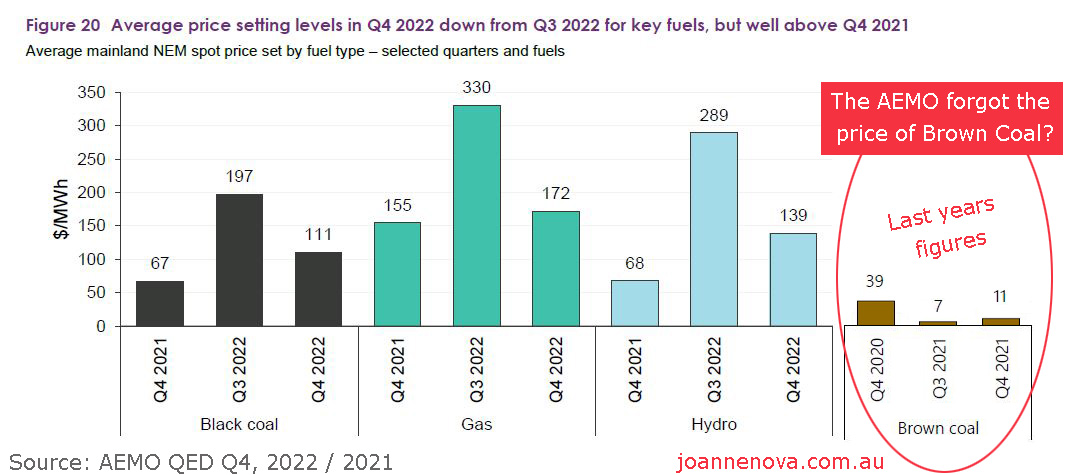 Price setting bids from different fuel types. Obviously I’d use the current prices if the AEMO will tell us… we know they know what it is. With 300 years of coal left, Australians could easily reduce electricity prices The nation is still using brown coal, but only at about half the rate. When we had cheap electricity (2010), brown coal would generate 6GW. Now it is only about 3GW. Not surprisingly, the less brown coal we use, the higher the prices rise. Brown coal, also known as lignite, –Rauiri Next winter could work out as badly as the last one:Prices may yet go blockbuster in Australia with one black coal plant closing, and two other turbines broken and delayed another six months: Callide C coal plant delays spark fears of winter energy crunchThe Australian Further delays to the restart of the Callide C coal-fired power station in Queensland, coupled with the impending closure of AGL’s Liddell coal plant, have heightened fears of another harsh winter for the country’s vulnerable energy system. Keep reading → A new paper shows islands are young, dynamic creatures, and mother nature is mean. And nothing we see today on Indian or Pacific Islands is unprecedented. All the panic about islands disappearing is nothing compared to what nature does all the time. Indeed, man-made climate change, if it has done anything at all — has been a boon for islands in the last fifty years. Thanks to Kenneth Richard, at NoTricksZone for finding the paper: Recent Shoreline Changes To 1100 Pacific Islands ‘Dwarfed’ By Change Magnitudes Of The Past The new paper by Kench et al looked at 1,100 islands across the Pacific and Indian oceans, and even though CO2 levels rose from 325ppm to an apocalyptic 420ppm, the average island got bigger instead of smaller, and only 3 small uninhabited islands completely disappeared. And when we say small, some of the islands we are tracking are mere 30m wide sand spits. Is it really fair to call that an “uninhabited island”? The world may have Olympic-sized junkets every year because shorelines have moved 40m in the last fifty years, but it turns out that shorelines moved 200 meters before anyone built a coal plant. This, below, is just the last fifty years in the life of Kandahalagalaa Island, and about 20% of the island has shifted. Currently sea levels are rising 3mm a year, but in its short life sea levels at Kandahalagalaa have already gone down and up some 900mm without humans doing a damn thing. 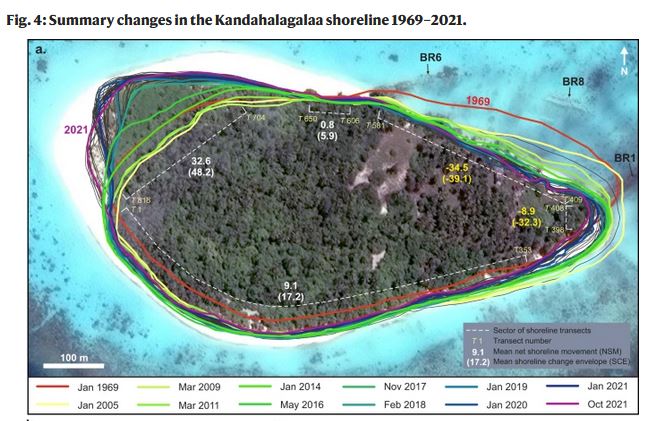 https://www.nature.com/articles/s41467-023-36171-2#Sec6 Satellite data is all very well for the last fifty years, but it can’t tell us whether islands used to move so much before humans invented the Ford Model T. So Kench and co. got very serious about one little island in the Maldives with the tongue-twisty name Kandahalagalaa. They drilled the holy smoke out of it, and radiocarbon dated the layers until they pieced together its history. They discovered that its whole life has been in a state of flux. It only emerged out of the ocean a during the dark ages, 1,400 years ago, shifted and grew to the south, and the ocean has turned a lot of the island upside down. The Kench team are data nerds and did some serious drilling — taking some 154 sediment samples from 20 cores, they used 23 samples of a particular green algae to do radiometric age tests. They also did laser levels six different ways to survey the island. They took 11 other cores of outcrops, and used four different satellites to get lots of photos of the shoreline.  Supplementary Figure 2: The drill holes This is one churned islandMost of the cores were upside down, with the older layers at the top. Nature is evidently reworking the island, dropping 1100 year old deposits on top of 300 year old ones, in various combinations that were different in nearly every hole. 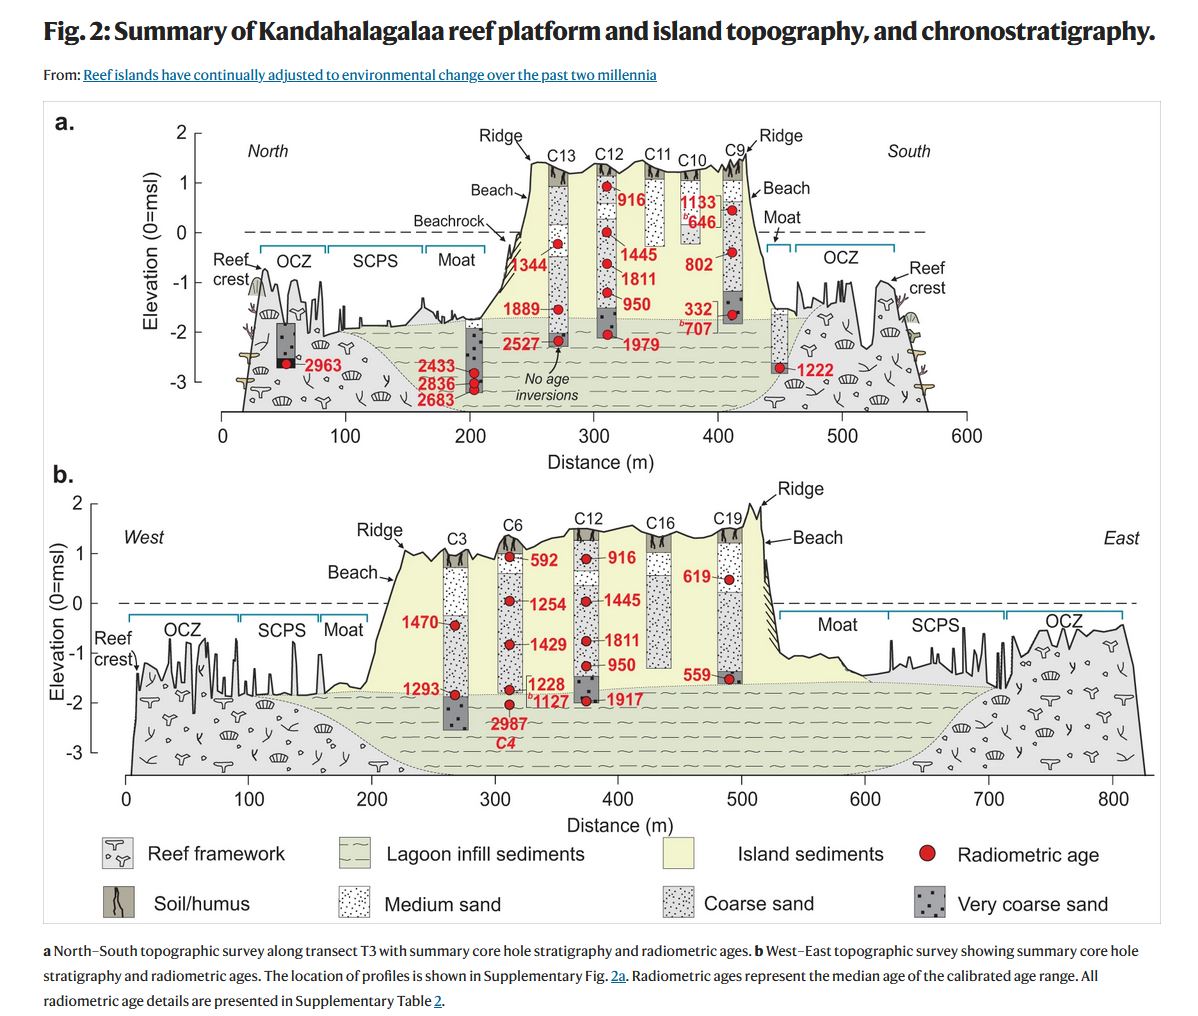 They drilled lots of holes and found the islands age history was a jumble of old layers on younger layers (ages in red) | Click to enlarge.
1,100 Islands of the Pacific and Indian Oceans are stableDespite the threat of man made climate change, nearly every island larger than a tenth of a square kilometer is the same size as it was or expanding. This is an update on a previous survey of 700 islands which showed they were mostly growing. It’s not necessarily an improvement — Kench et al appear to have just added 400 teeny tiny islands to spread the splatter on the left hand side. Notice how the log scale gives tiny islands a big role? An island 0.01 km2 is a mere 100m by 100m across. Half the graph is really plotting the fate of shifting sand dunes. Is it fair to call them islands?  a Data source Kench et al Ref 37 The climate signal got blurredThe authors comment that they were unable to implicate climate change: Collectively, these studies have been unable to establish specific environmental drivers of island change, nor directly and unambiguously implicate climatic change as a mechanism for observed changes. To date, local-scale processes appear to have blurred any climatic change signal22,24. Translated: even though everyone says climate change is real and obvious expert researchers couldn’t find a signal above the noise. I suspect Kench et al were disappointed not to find that signal, given he was not happy some skeptics used his study a few years ago. But full credit to the team for being so dedicated at collecting data and writing it up so honestly. Islands were forming as the holocene sea levels fellGiving some idea of just how young these islands are, Kench et al reviewed about 15 different studies of islands between the Maldives and Fiji and found that the oldest known samples from each was about 1,500 to 7,000 years old (black circles below). Holocene sea levels (marked in blue) were an unthinkable 2 meters higher 5,000 years ago. Sea levels have been falling around Australia for thousands of years. The little very-drilled island of Kandahalagalaa is “e” below, with the oldest samples from nearly 3,000 years ago, presumably underwater then, since that was long before Kench declares it it to have emerged from the sea. 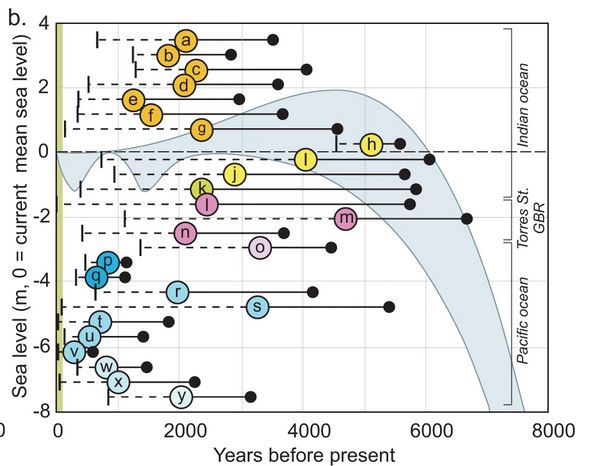 b Summary of reef island evolution studies highlighting the onset and period of island accumulation in the mid-to-late Holocene. Blue-shaded area defines the envelope of sea-level behaviour in the Indo-Pacific. The solid black circle denotes the earliest radiometric age, the coloured circle denotes the mean radiometric age of samples, vertical line denotes the latest radiometric age. Different coloured circles reflect islands in different reef provinces and the letter inside the circle denotes specific islands, a = Mainadhoo, b = Boduhini, c = Galamadhoo, d = Baavanadhoo, e = Kandahalagalaa, f = Kondey, g = Vaadhoo, h = Dhakandhoo, i = Hulhudhoo, j = Thiladhoo, k = Cocos (keeling) Isld., l = Warraber, m = Bewick, n = Lady Elliot Isld., o = Mba, p = Tepuka, q = Tutaga, r = Laura, s = Jabat, t = Jeh, u = Jabnodren, v = Jin, w = Malamala, x = Navini, y = Makin. Source references of data are listed in Supplementary Table 1. h/t Kenneth Richards, El Gordo, Another Ian. REFERENCESKench, P.S., Liang, C., Ford, M.R. et al. (2023) Reef islands have continually adjusted to environmental change over the past two millennia. Nat Commun 14, 508 doi.org/10.1038/s41467-023-36171-2 March 9th, 2023 | Tags: Holocene, Pacific Islands, Sea Level | Category: Global Warming | Print This Post | | By Jo Nova Twenty six months after the so called “deadly insurrection” at the US Capitol, the video tapes that have been hidden are finally available. This was a day that “echoed through history” according to Kamala Harris, who compared it to Pearl Harbor but didn’t want you to see the footage. People are in jail because they dressed up and walked with a police escort through open doors. It’s a Redpill moment. The few people who did break windows or incite the crowd to do acts of violence have not been arrested. Who were the Feds? “Even 57% of Democrats think that it’s at least somewhat likely that Feds were not just there but were also encouraging people to riot or go into the Capitol.” — Thomas Massie Rep Congressman. The Jan 6th Committee had all this footage. They knew…  .. Jan. 6 footage shows Capitol cops escorting QAnon Shaman to Senate floorMiranda Devine, New York Post “The tapes show the Capitol Police never stopped Jacob Chansley. They helped him. They acted as his tour guides.” And yet in the narrative formed that day by Democrats and much of the media, “Jacob Chansley became the face of January 6, a dangerous conspiracy theorist dressed in an outlandish costume who led the violent insurrection to overthrow America’s democracy,” says Carlson. Chansley, the horned “Shamen” became the perfect Photo Op for the Democrats. His sentence is four years. Why were these tapes released now? Apparently Tucker Carlson was given the footage as part of a deal to win over the last few Republican votes that were needed to get Speaker Kevin McCarthy elected as Speaker of the House. * * * Those with discernment don’t buy it, –Rauiri This site is but a cog in an information war. Every news outlet that ran the Insurrection story on January 6th should have been showing these tapes tonight. Keep reading → March 8th, 2023 | Tags: Capitol Hill, Media bias, Psy-Ops, US Politics | Category: USA | Print This Post | | By Jo Nova Everything is a PsyOp now: even the weather maps are on fireAustralia has had a mild summer, a mild year, but that’s a reason for another meaningless “hottest” headline. “Millions across NSW suffering through hottest day over two summers“. So outback New South Wales finally gets an average warm summer day and the climate map makes it look like a nuclear meltdown. Since when was 35 degrees C a shade of heat so hot it was black? (That’s 95F). To put this in perspective, the town of Cobar near the centre of the map made it to 37C today (98.6F). But a few years ago the average temperature for the whole month of February was 37C. Any Cobar resident who feels like 37C is unusually warm, moved there this morning. If newspapers were not paid agents or religious acolytes for the cult of climate change the headlines would have said “finally a last blast of summer warmth after two cold years”. But that doesn’t sell solar panels. 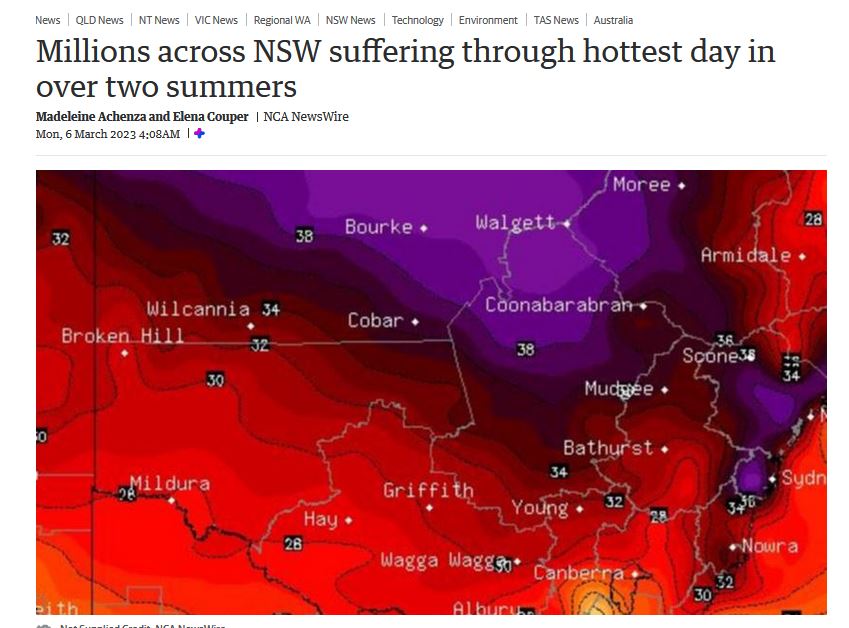 Just another warm summer day made to look like hell on Earth No heat? No problem…Call it color inflation. The value of any color is shrinking. Satellites show Australia hasn’t warmed at all in the last ten years, but the headlines and artwork still look the same. Back then, it was a different kind of PsyOp. In 2013, the BOM announced climate change had made Australia so hot they needed to change the color scale of their maps so they could add “purple heat” for a prediction of over 50 degrees C (a temperature that didn’t even happen). Now, 40C is the new 50C and what was an average day in 2020 in January for Bourke is now a purple holocaust. (40C is 104F and 50C is 122F). To be fair the BOM has the same color chart it had then, and the new radioactive maps are made by some other agency, NCA NewsWire or Stormcast, whoever they are. But the BOM says nothing about this, and the media are happy to play deceptive color tricks on their hapless audience. I pointed out ten years ago that if Australian towns hit 50C it wasn’t a record but just a return to a temperature measured all over Australia in the 1800’s.
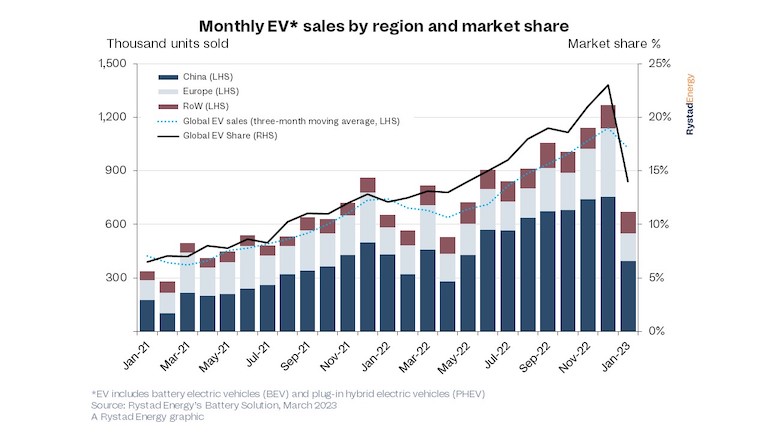
Real Australians aren’t afraid of 35 degrees C, but sleepy distracted Australians might be fooled out of some taxes by a hellfire map. March 6th, 2023 | Tags: Australian temperatures, Media bias | Category: FakeNews, Global Warming, Media-matters | Print This Post | | .. The magic of the free market was suddenly applied to EV sales last month. Tax credits and subsidies for electric cars in the EU and China ended on January 1, and sales promptly halved.
So half the entire EV market apparently only existed because governments took money from poor people to help rich people buy EV’s. Everyone wants nice weather in 100 years, but no one wants to pay for it. Let’s all sing “equity”. EV sales collapse as subsidies and tax credits come to an abrupt haltAmerican Journal of Transportation The global electric vehicle (EV) market is reeling from one of the most dramatic collapses in monthly sales to date, with Rystad Energy research showing that only 672,000 units were sold in January, almost half of December 2022 sales and a mere 3% year-on-year increase over January 2022. The EV market share among all passenger car sales also tumbled to 14% in January, well down on the 23% seen in December. The US is a ray of hope for the industry. Not because American EV’s are necessarily better but because of “better” government interference: EV subsidies in many European countries and mainland China were sliced at the start of the year, and a return of any significance is highly unlikely in the immediate future. One ray of hope for the global outlook is the US market, which is just beginning its electrification journey and rolling out tax credits thanks to the Inflation Reduction Act. There have been a number of car-crash-holiday-tales of EV journeys of late, which won’t be helping sales either. EV owner has unexpected holiday inside carIt wasn’t so much a holiday with an EV, as a holiday imprisoned in one:
BBC Radio 1 DJ Scott Mills misses flight after locking himself in car for 5 hoursMyLondon News Scott Mills has revealed he was trapped in a car for five hours and missed his flight as a result. The BBC Radio 1 DJ had intended to set off on a romantic weekend with his partner, but instead was trapped outside the BBC studio. “I’ve had quite the weekend,” he said. “I said goodbye to you on Friday. Me and Sam agreed to head to the airport in my electric car at 4pm. Flight is at 8pm. “Get in the car. Car doesn’t start. In fact, nothing works. I go to get out of the car. I can’t get out. Sam tries his door. Nothing. Also cannot leave the car.” Scott says he had charged the car’s main battery, but the secondary battery had run empty. British people bought more cars overall in January, they just wanted the ones that run on petrol: Has the electric car bubble BURST?How drivers are returning to buying petrol vehicles in droves due to lack of charging stations. Oliver Price of This Money UK Eighteen-month waits after ordering your new car and seemingly unending queues to power it up due to a dearth of new charging stations being built. This seems to be the experience for many UK motorists when buying and owning an electric car. Keep reading →
By forcing people to put money into pension funds in a form of investment that they weren’t necessarily comfortable with, governments created vast piles of money that was essentially left unguarded on the beach in a bay with a hundred pirate ships. Sure, there were regulatory agencies and accountants up the kazoo, but money is also power: the paper dollar would get returned to the owner, but the whole time it was out of his hands, its power was being used against him. In a free market, millions of voters can vote with their wallet. It’s a form of democracy. But for hapless sleepy investors in a pension plan — sometime in the 1980s that power to choose the kind of industries and values they wanted to support was silently given away to a guy called Larry Fink and a few of his colleagues. Snoozing-at-the-wheel, citizens voted for cheap energy every two years, while their money voted for “ESG” every day. And ESG is the expensive Environmental, Social, Governance kind of electricity which freezes your peas AND corrects the weather (in theory). The size of the pension funds managed by the likes of BlackRock, Vanguard and StateStreet became The Financial Swamp Monster:
BlackRock’s tyrannical ESG agendaBy John Masko, UnHerd When the UN invited global financial institutions to sign onto the Principles for Responsible Investment (PRI) in 2007, the total global assets managed by ESG-minded investing vehicles was around $10 trillion. By 2020, a mere 13 years later, that has grown to more than $30 trillion worldwide and more than $17 trillion in the US. New private equity firms and investment outfits devoted purely to ESG — such as Al Gore’s Generation Investment — were springing up every year, and most large US investment firms began offering ESG-mandated mutual funds, leading Bloomberg in 2021 to project $53 trillion invested in ESG by 2025. This was years in the making: As the ESG agenda took hold, the individual investor increasingly found himself shunted aside. Admittedly, the roots of this shift lay in the early Eighties, when federal proxy voting rules were changed to allow fund managers such as BlackRock to vote on behalf of their clients. The idea was a good one at the time, in that it recognised that few individual investors have the time to attend shareholder meetings or the wherewithal to make their views known to company leadership. But it handed vast power to investment companies — admittedly under the understanding that they would vote on behalf of their clients for one purpose only: the maximisation of profits and shareholder returns. It was, however, only a matter of time before this power was exploited. Larry liked climate change, so BlackRock became the Monster Climate Police: In 2020, BlackRock voted at 16,200 shareholder meetings on 153,000 company proposals. Frequently, these votes were against company management. According to the company’s own Investment Stewardship Annual Report: “In 2020, we identified 244 companies that were making insufficient progress integrating climate risk into their business models or disclosures. Of these companies, we took voting action against 53, or 22%. We have put the remaining 191 companies ‘on watch’. Those that do not make significant progress risk voting action against management in 2021.” In the same report, BlackRock boasted of having voted against management more than 1,500 times for “insufficient diversity” in company management. See how this works? All those crazy oil and gas companies who gave up without a fight were crazy for a reason. Then Larry Fink realized he didn’t even need to control the votes. With $10 trillion in funds, BlackRock could be the Climate Mafia, and all he needed to do was write a letter every year telling the corporate world “nice business you have there, shame if something happened …” In his words: “Companies must benefit all of their stakeholders, including shareholders, employees, customers, and the communities in which they operate.” Allow me [John Masko] to translate: On behalf of millions of shareholders I’ve never met, I declare that they no longer truly own the companies they have invested in. Society does. Remember how in October 2020 BlackRock told Australia to get rid of coal faster, and then the next year our conservative government agreed to commit us to Net Zero Targets that the voters didn’t ask for? That was the moment when our Treasurer effectively told us the Bankers bullied Australia into Net Zero. We know which banker he means. As I said then: Australia is adopting Net Zero because the Global Financiers, who only want to save the world, would have refused to lend us money without jacking up our interest rates by 1.5%. The banker punishment would have meant a “17% investor exodus”. Fancy a stock market collapse? The good news is that 25 US States have realized the game, and are fighting back. And word is spreading that ESG is a dog financially…. In 2022, eight of the top ten actively managed US ESG funds (including one of BlackRock’s) performed worse than the S&P 500. This demonstrates two things. First, that ESG funds are not some financial miracle. And second, that the performance of ESG funds is tightly bound to the tech industry, which had a terrible year in 2022. Larry Fink has usually released his annual letter by now. He seems to be having trouble with 2023. Instead of a letter, the BlackRock CEO says attacks on ESG investing are getting ugly and personal. h/t Reader Pirate Fantasy:Image by 0fjd125gk87 from Pixabay Photo by eflon on Flickr. Adapted. CC by 2.0. | Second BlackRock Photo Jim.henderson Ed Dowd is the former BlackRock executive, who has been drawing attention to the excess death data. As a Wall Street trader he likes to find and arbitrage the realities that aren’t well known so he can bet against the realities that aren’t real. And so he found himself last year looking at death trends that were off the charts. At this point the trader turned into a human trying to warn hundreds of CEO’s of insurance companies (among others) but they did not want to know… Of the 3.2 million newly disabled in the USA, it’s remarkable (though sad) that 1.7 million came from the employed sector. Normally working people are the healthiest group — but since February 2021 their disability rate is up 31%. That compares to a rise of just 9% across the “general population”. And in a complete turnaround — those who quit or got fired — normally the sickest ones — their disability rate rose only 4%. So something changed. What could it be, we wonder, that took place in 2021 and caused more of those who stayed in their jobs to become disabled. Why was quitting work or being fired a seeming benefit to your health… unless it was medical experiments mandated by bosses? His interview with Tucker Carlson is well worth watching. It’s food for the soul to see good men solving problems. And that’s even though they’re discussing death, corruption and fraud. There’s something hopeful about this that suggests that honest smart players are finding their feet. Tucker and Dowd also discuss the effect this era has had on them, how he deals with fear, why this is the third time in his life he has gone against the flow, and he called it right the last two times. (The BlackRock fund he managed made billions.) As he says: We’ve never seen these kinds of excess deaths and yet we’re not even talking about it. During Covid we had ticker tallies of daily deaths, but not any more. It’s very telling that they stopped counting. The official statistics on disability:Disability in the general population has been gradually rising (2009 – 2023) 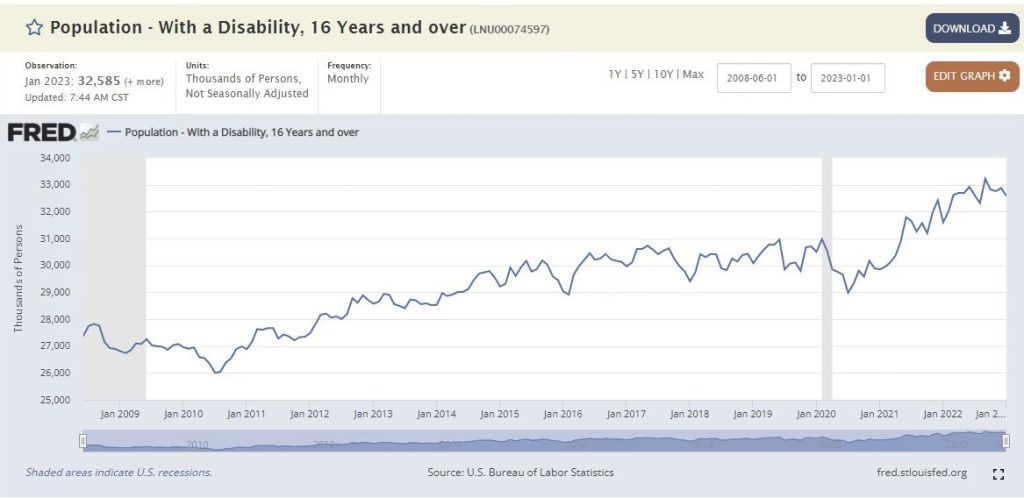 General population with a disability (BLS Data) Something drastic happens to the rate of disabilities among people who were employed during 2021: 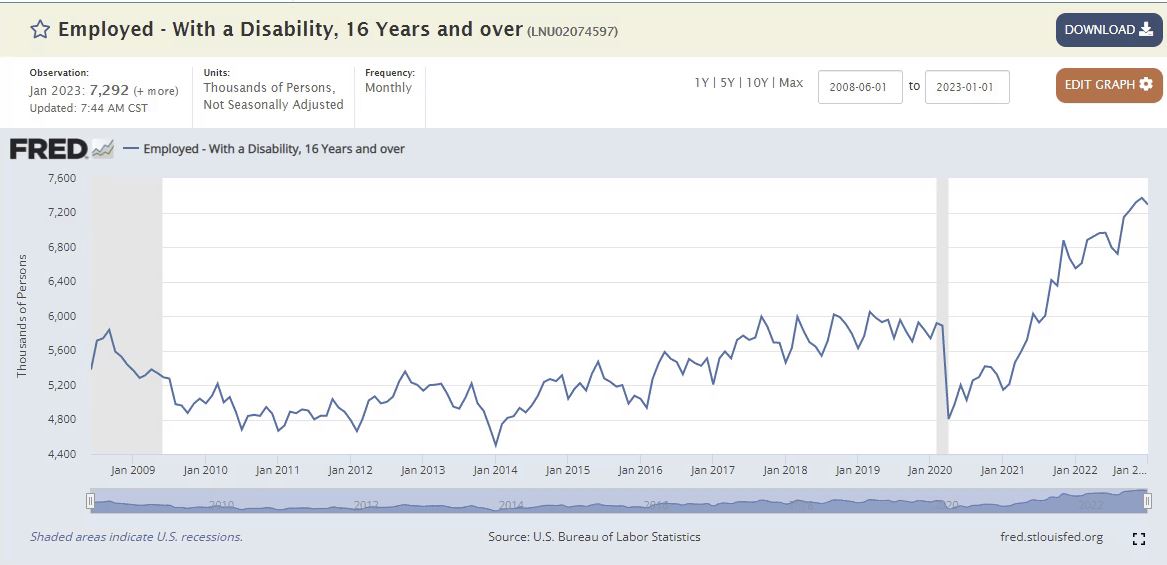 Employed with a disability (BLS Data) Graphs from the St Louis Fed Reserve, via Ed Dowd who says: Don’t need a PhD or Wall Street background to see something changed here or to see from eyeballing these 2 charts that the employed disabilities are rising faster than the general population due to vaccine mandates. This is a sick joke at this point. Institutions will be razed. UPDATE Unemployed with a disabilityWow that trend is not like the other ones. 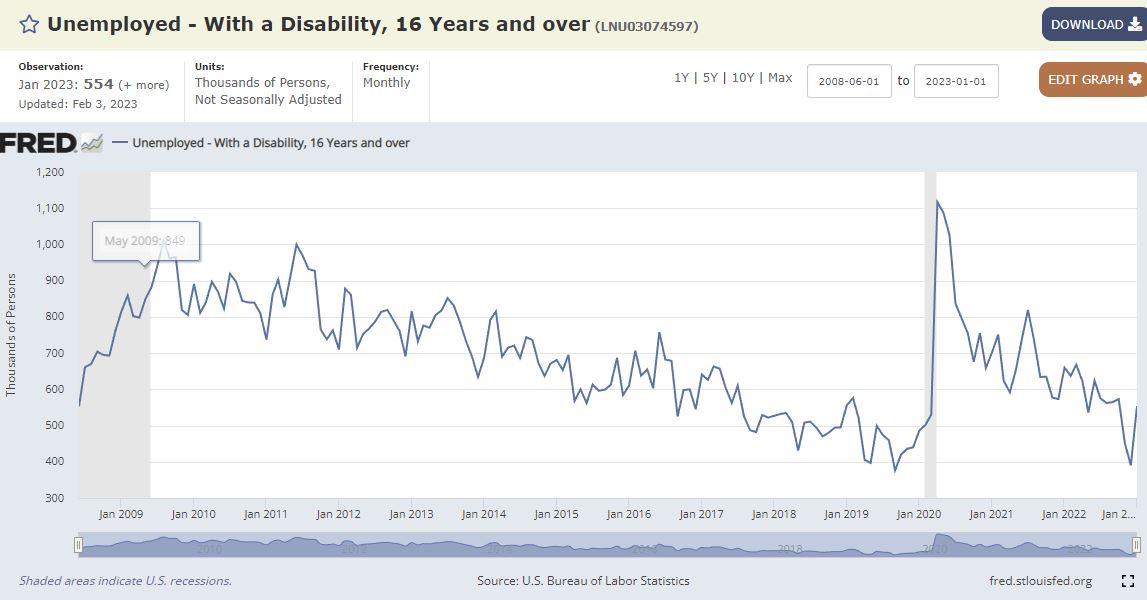 https://fred.stlouisfed.org/series/LNU03074597 h/t William Astley, Another Ian, Tim. Scott of the Pacific, and Stephen Neil. |
Jo appreciates your support to help her keep doing what she does. This blog is funded by donations. Thanks!
   |
|||
|
Copyright © 2024 JoNova - All Rights Reserved |
||||


Recent Comments