No wonder Flannery and co. are playing double or nothing. While headlines have shouted for years that vested interests of the fossil fuel players dominate this debate, few journalists point out that the renewables industry, carbon trading markets, and the climate-scary-science-campaign have an all-or-nothing interest in propagating alarm.
As I keep saying, those in private business who provide real goods to real voluntary customers will suffer from a carbon tax, but they still have a market. For them it’s a “dent” in profits. We’ll still be buying coal, oil and gas for decades to come. In contrast, those who make a living from government funds could lose everything in an instant. Their wealth and status depends on a forced payment and a decision from one Minister. It is far more ephemeral and subject to whim. The state-dependents are far more desperate. The stakes are higher.
Gillard calls the “climate commission” an independent body, which is only true in the same sense that any parasite can be described as “independent” of the host while being completely dependent on it.
This shows just how independent and apolitical the Climate Commission reality is:
Tony Abbott said he didn’t see the point of paying Professor Tim Flannery about $180,000 a year for views which he considers already public knowledge. Source: The Daily Telegraph
Andrew Bolt: More spin Latest weather forecasts TONY Abbott has signalled he could sack chief climate commissioner Tim Flannery if he is elected as prime minister in September.The Opposition Leader, who has vowed to dismantle the Climate Change Department and merge it with the Environment Department in government, said he did not see the point of paying Professor Flannery about $180,000 a year for his views which Mr Abbott considers already public knowledge.
I’m sure Flannery sincerely believes he helps, but does the net benefit to the nation exceed the cost? How are those predictions panning out — Anyone want an unused desal. plant?
Speaking of Desalination, Flannery sat on the sustainability advisory board of Siemens in 2011, which helps make desal plants (like Perth’s). It also makes wind farms. He is also the Panasonic professor, and a few years ago they held a whopping 40% of the market for rechargeable electric car batteries, and were moving into electric car making. For Panasonic, spending $690,000 on Flannery’s research was much cheaper and more effective than buying prime time advertising to tell Australians how much they need electric cars. After all, the ABC don’t even sell ads, but Flannery speaks unchallenged there.
In the end, vested interests are everywhere. Only evidence from our atmosphere tells us which side is right. I’m still asking for that Mystery Paper. Flannery can’t find it.
If he stuck to arguing the evidence and providing a service to the Australian people instead of to government gatekeepers, he wouldn’t have so much to fear. Half of Australia pays his salary, but they aren’t convinced humans can change the weather. How does Flannery serve them? He calls them names.
Flannery recognizes the power of the fossil fuel lobby (see below), but not the “government grants and junkets lobby”. If people are going to reason-by-vested-interests (which is unscientific) then let them at least be honest about the vested interests on all sides. What is magically pure about government money? Since when was $1 from oil more influential than a $1 from a whimsical government program?
Italian police have seized assets worth 1.3 billion euros ($1.7 billion) from a Sicilian renewable energy developer in the biggest ever seizure of mafia-linked assets.
The assets, including 43 wind and solar energy companies, 98 properties and 66 bank accounts, belonged to Vito Nicastri, a 57-year-old businessman dubbed the “Lord of the Wind” for his prominent role in the business.
“This is a sector in which money can easily be laundered,” Arturo de Felice, head of Italy’s anti-mafia agency, told local media.
“Operating in a grey area helped him build up his business over the years.”
The anti-mafia agency in a statement said it was the biggest seizure of mafia-linked assets.
This was not a free market, but a free-for-all.
Italy’s renewable energy sector has been heavily infiltrated by the mafia because of once-generous state subsidies and lax controls, as well as the availability of land in areas of southern Italy with a strong mafia presence.
As far as Italy’s environment and emissions go, we know that it probably makes no difference whether the renewables were actually running or not. But it does matter if a system feeds criminals. They get empowered at the expense of honest people.
The classic hot spot prediction (A) compared to 28 million weatherballoons (B). Click to enlarge. You won’t see this in the new report.
It was a major PR failure in 2007. The IPCC won’t make the same mistake again. They’ve dumped the hot-spot graphs.
In AR4 they put in two graphs that show how badly their models really do. In the next report they plan to bury the spectacular missing-hot-spot images through “graph-trickery” and selective blindness. Each round of IPCC reports takes the spin-factor up another notch. It’s carefully crafted.
In the new extra-tricky AR5 version, the IPCC “quote the critics” and ignore them at the same time. That way they can say they include the McIntyre’s, McKitrick’s,Douglass’, and Christy’s: the words are on the page, but that doesn’t mean the information is used in the conclusions. The models have failed and they bury that undeniable result under the clutter. (You’ll need to read the fine print). There is no acknowledgement that this issue of the “hot spot” drives more amplification of predicted warming in their models than any other point (though that is obvious and implicit in Fig 9.44, and you can see that below). Which policymaker exactly is going to notice that?
The IPCC are an abject lesson in how to hide a message in plain sight
In the new report they have dumped their former fingerprint predictions which looked so definitively and technical, but proved to be so wrong. However they will not join-the-dots. They won’t admit this is a major point their models have failed on, instead they flat out deny the results from 28 million weather balloons are conclusive.
In a sense, in AR5, the IPCC just throws up its hands and says “yes ok, the models don’t align with the data, but the data might be wrong, and rather than fix those models, we’ll quietly dump that test and the awkward results and pick a different set of inconclusive tests instead. It’s known as shifting the goal-posts. ” It’s what any rational weasel-grade bureaucrat would do if their job and their junkets depended on it. You can hardly blame them… 😐
The art of tricky-graphs: The All New Hot Spot is turned sideways, extended up, and “smallified”
The graphs up the top have been split into four bands, screwed sideways, and extended to far higher in the atmosphere. The net effect visually is to minimize the disparity at the point that matters. Only by reading the caption and text, and reams of information, would you figure out that the action occurs in the bulge of the red line in the second graph (that’s the models best shot at the tropics). Compare that to the black line which is what the weather balloons found. I’ve blown it up further below, and removed the clutter. The green line is irrelevant (that’s model predictions without CO2 — which is argument from ignorance with unverified models). The results in the stratosphere are not that important. The water vapor changes at the upper edge of the troposphere are what matters (about 200hpa or 10 km up).
Official caption: Figure 10.7: Observed and simulated zonal mean temperatures trends from 1961 to 2010 for CMIP5 simulations containing both anthropogenic and natural forcings (red), natural forcings only (green) and greenhouse gas forcing only (blue) where the 5 to 95 percentile ranges of the ensembles are shown. Three radiosonde observations are shown (thick black line: HadAT2, thin black line: RAOBCORE 1.5, dark grey band : RICH-obs 1.5 ensemble and light grey: RICH- τ 1.5 ensemble. After (Lott et al., 2012).
See the second graph on the left up, expanded close on the right below.
Close up of the second graph of Fig 10.7 (see caption above).
How do you say “we have no evidence” without saying it — like this:
“In many cases, the lack of long term observations, observations suitable for the evaluation of important processes, or observations inparticular regions (e.g., polar areas, the upper troposphere / lower stratosphere (UTLS), and the deep ocean)remains an impediment.”
Blame the equipment. They have fifty years of data and millions of results.
This is the money statement:
In summary, there is high confidence (robust evidence although only medium agreement) that most, though not all, CMIP3 and CMIP5 models overestimate the warming trend in the tropical troposphere during the satellite period 1979–2011. The cause of this bias remains elusive.
What they don’t say is that this point on its own is responsible for half the warming projected in the models, and hence that after twenty years of trying to reconcile the models and observations it’s past time they turfed the models and trashed the assumption that humidity will cause monster positive feedback. Forget the projections of 6 degrees of hell, the best estimate would be half the current one (or less) and we can all go home.
Is water vapor feedback critical?
Is your skeptical brain wondering if I’ve got that point right about the positive feedback being so large? Remember it’s the IPCC that says without feedbacks CO2 will only cause 1.2C of warming.1,2 It’s the feedbacks that drive all the scary projections above that. Then gaze upon the graph below, 9.44. Spot the largest single feedback, one so big, it’s almost as large as “total feedbacks”. That would be “WV” or water vapor. This is almost the same graph as it was in AR4 – see Fig 8.14, on page 631.2
This is central to maintaining the scare.
Figure 9.44: a) Feedback parameters for CMIP3 and CMIP5 models (left and right columns of symbols) for water vapour (WV), clouds (C), albedo (A), lapse rate (LR), combination of water vapour and lapse rate (WV+LR), and sum of all feedbacks (ALL) updated from Soden and Held (2006). CMIP5 feedbacks are derived from CMIP5 simulations for abrupt four-fold increases in CO2 concentrations (4 × CO2).
For the die-hard IPCC interpreters, here is the full “Fifth Assessment Report” section where they discuss the pesky discrepancy that the whole crisis hinges upon.
The survey questions included conspiracies likely to appeal to a small percentage of conservative or free market thinkers, and largely left out conspiracies that would appeal more to supporters of bigger government (like the idea that the rise of “climate denial” was a big-oil funded conspiracy). It studied big-government conspiracies and ignored big-corporate ones. There are gullible conspiracists who also believe in global warming, but there was no danger this survey would find them. The survey bias was so obvious, even alarmist commenters said they feared few “denialists” would take it. The results that were headlined in newspapers were based on a tiny sample of ten respondents to an anonymous online survey. Not surprisingly Lewandowsky’s university (UWA) received many complaints about ethics, methods, and the dismal quality of the data, and bloggers had a field day shredding the paper.
In response, the Australian Research Council awarded Lewandowsky et al another $338,000. Just where do their priorities lie?
The paper was delayed. The typesetting oddly took 8 months, and includes a new key point. To answer the rabid critics, Lewandowsky needed to show that that many real skeptics did fill out the survey. The evidence for that apparently relies on Cook’s site (the ambush-labelled “Skepticalscience”). Lewandowky et al now effectively claims skeptics really were reading Cook’s site and lots of them did the survey there.
How 78,000 equals zero
Lewandowsky et al go out on a limb to say skeptics may have made 78,000 visits that month and could have seen that survey link (if only there had been one there):
Prevalence of “skeptics” among blog visitors All of the blogs that carried the link to the survey broadly endorsed the scienti fic consensus on climate change (see Table S1). As evidenced by the comment streams, however, their readership was broad and encompassed a wide range of view on climate change. To illustrate, a content analysis of 1067 comments from unique visitors to http://www.skepticalscience.com, conducted by the proprietor of the blog, revealed that around 20% (N = 222) held clearly “skeptical” views, with the remainder (N = 845) endorsing the scienti c consensus. At the time the research was conducted (September 2010), http://www.skepticalscience.com received 390,000 monthly visits. Extrapolating from the content analysis of the comments, this translates into up to 78,000 visits from “skeptics” at the time when the survey was open (although it cannot be ascertained how many of the visitors actually saw the link.)
For comparison, a survey of the U. S. public in June 2010 pegged the proportion of “skeptics” in the population at 18% (Leiserowitz, Maibach, Roser-Renouf, & Smith, 2011). Comparable surveys in other countries (e. g., Australia; Leviston & Walker, 2010) yielded similar estimates for the same time period. The proportion of “skeptics” who comment at http://www.skepticalscience.com is thus roughly commensurate with their proportion in the population at large.
But, as Barry Woods and DHG both discovered and Geoff Chambers pursued relentlessly, it appears no link was ever posted on SkepticalScience. Steve McIntyre points out the total number of skeptics doing the survey on Cook’s site can thus be ascertained — and it is exactly zero. It’s hard to believe any scientist would think they would get away with this. The paper will surely have to be withdrawn. (But will the government funding be withdrawn? The Australian Research Council (ARC) needs to answer some very awkward questions.)
Here’s a study in dishonesty
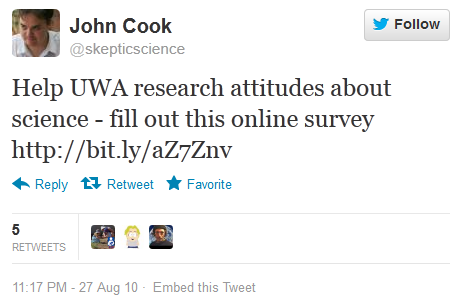
FOI documents obtained by Simon Turnill show that Cook didn’t post the link at all, he tweeted it (how many people were on his twitter list in 2010?). You might think this is a minor change, but not at all. Cook’s tweet probably didn’t get the “390,000 visits” his site might have got that month. Instead the records show he got five retweets.
More importantly, above all else, Cook has been untruthful with his readers and with skeptics all along.
Like a five year old explaining where the cookies went, his story keeps changing as Woods and especially Chambers pin him down. Back in September last year, Lewandowsky said eight sites hosted the survey and Cook’s site was one, but strangely no one could find a link on SkepticalScience. Cook then said he hosted it in 2011. But it wasn’t there either. Cook apologized, and said it was 2010. When Chambers pressed on for evidence, Cook and the moderators stopped the questions and insisted it go private. Cook emailed Chambers, saying he couldn’t add much more. Chambers wanted the comments from the discussion of the survey at Cook’s site because the comments on other sites where the survey were hosted revealed the thoughts of the people most likely to have done the survey. Strangely the post and all the comments had been deleted. [Read the whole exchange at Climate Audit].
It’s odd for a whole post to disappear, but even odder when the post is then quoted in a peer reviewed study. Cook repeated that he had provided a link to the survey, but Chambers could find no record of it in the Wayback Machine either. Cook then suggested that he had “forensic evidence” — an email from Lewandowsky asking Cook to post the link, and Cook’s reply that he posted it the same day. What Cook wasn’t saying but must have known (since he checked his email records), was that his emails forensically showed that Cook tweeted the link.
The tweet by Cook, that Barry Woods and DHG both found, is online here on August 27, 2010. The Wayback Machine recorded Skepticalscience on August 30, 2010 — and there was no post. Nor was there a post about a survey in the following week either. So it appears unequivocal, as much as anyone bar John Cook can tell, that SkepticalScience did not host the survey.
McIntyre asked Cook to explain:
Not to put too fine a point on it, it appears to me that you lied, when you asserted that your correspondence with Lewandowsky on 28 August 2010 was “forensic evidence” that showed that you had posted a link at Skeptical Science to the Lewandowsky survey on that day. I use the word “lie” because you had clearly examined the 28 August 2010 correspondence at the time of your email to Chambers and knew that this correspondence did not show that you had posted a link at Skeptical Science to the Lewandowsky survey on 28 August 2010 or any other day.
Before I make any public statements about this matter, I am offering you an opportunity to rebut the belief that the statement bolded above was a lie.
Cook did not respond.
If Cook did post that survey long enough for anyone to comment on it, he would probably have a record of the comments made even after deleting the post. Where are they?
The “smart” thing for Cook to have done at this point was to make sure the published paper was corrected to “seven sites” and not eight, and did not rely on the link at his site which no one can find. He and Lewandowsky both must have been aware that skeptics knew. It speaks volumes that Lewandowsky and Cook cited a post on Climate Audit (Steve McIntryre’s site) about this point in their second “conspiracy paper” called Recursive Fury, so they knew that they were wrong, and that skeptics knew that too. Despite this, they still went ahead and published the revamped edition of the Moon Landing paper with the misleading information in it.
To the skeptics who suggest that Lewandowsky or Cook planned the first paper to fish for comments to use in a second paper, I say not a chance. They just aren’t that competent. They struggle from one gaffe to the next.
As Skiphil notes, Lewandowsky expects skeptics to keep two year old emails from unknown assistants at a university they may never have heard of, but he doesn’t expect his own co-authors to keep posts up displaying supposedly “scientific” surveys with results that are used in his papers.
Their incompetence will hurt the reputation of Psychological Science and Frontiers, if they do not take quick action, as well as the University of Western Australia, the School of Psychology, the University of Queensland and the ARC.
The strategy here appears to be double or nothing.
The Risk Monger (David Zaruk) was astonished to receive an advertisement from the Dutch government looking for 60 young PhD students to help with the next Intergovernmental Panel on Climate Change (IPCC) report.
They salary is “none”. But they are not just looking for any old student. You don’t need experience, but to qualify you need “an affinity with climate change”. I guess they are not looking for skeptical students who feel an affinity with logic, reason, and empirical evidence?
The reasons for asking the unpaid students is actually described as an “ambitious plan” to do a “thorough review” because there were “errors in the fourth assessment report…”. O.K.
The Risk Monger:
Maybe I am jumping to conclusions, but with all of the mess of the last IPCC Assessment Report (including a non-scientific WWF campaign document predicting the disappearance of Himalayan glaciers getting through the review process and becoming one of the IPCC’s main conclusions), shouldn’t they try to do a more rigorous review process this time around? Students, working for free, are not perhaps the ideal choice of reviewers needed to challenge the experts
What troubles the Risk-Monger more here is that many environmental activists are working on their PhDs and would jump at the opportunity of shaping the IPCC’s subjective conclusions to match their personal political biases. I suppose Greenpeace or WWF will pay their time-sheets to help shape the IPCC’s most socially important chapters.
Strangely, in that month when the entire review process will be done, students will also be taught about what the IPCC is, and how to review a document (I really wish I was making this up). The review process starts with a drink on April 12 and ends with a dinner on May 13. One lucky reviewer will receive € 250; the rest go home with nothing.
I am going to go out on a limb here and predict that the IPCC’s Fifth Assessment Report will be loaded with more than just spelling mistakes.
Now don’t get me wrong, I’m the one who says there are no Gods in Science, and scientific truth lies in evidence and reasoning, not in qualifications — perhaps an unpaid student will straighten out the IPCC and stop them from making more embarrassing mistakes? But note the contradiction that hiring unpaid students provides compared with the IPCC promotion that they only use expert peer review.
No doubt the students work will be checked and overseen with a leading top climate expert with decades of experience (but then a government appointee will re-write their conclusions anyway). This expedition appears to be more about fishing and training up-and-coming PhD’s rather than the IPCC running out of money.
We all know that newly graduated PhD’s are sometimes the best at rewriting history and producing hockeysticks to fit the policy.
Richard Betts (the IPCC Lead Author that Lewandowsky mistakenly thought suffered from “conspiracist ideation”) points out that technically anyone can review an IPCC report, which is true. You can apply too.
The review of the WG2 volume starts tomorrow, and last until 24th May. Further info is here:
If the Greens cared about CO2 they’d be very interested in ways to reduce emissions. But their selective interest speaks volumes about their real priorities. Anton Lang shows how newer coal fired powers stations run hotter and at higher pressures, and use 15% less coal to produce the same amount of electricity. We could upgrade our power stations and cut a whopping 15% of their emissions — which is huge compared to the piddling small, often unmeasureable savings thanks to renewables. Even massive floods that stop industry don’t reduce our emissions as much as this would. Do the Greens hate the coal industry more than “carbon pollution”? — Jo
———————————————————–
Ultra Super Critical Coal Fired Power gives a 15% CO2 Emissions Reduction
Guest Post: Anton Lang (aka TonyfromOz)
It all comes down to steam.
Assume (for a moment) that we have to reduce the emissions of CO2 by something like 20% between now and 2020.
Previously I showed we could achieve a reduction of 13% in CO2 emissions from the electrical power generating sector just by converting from the current 70’s technology coal fired power to the newest technology USC (UltraSuperCritical) coal fired technology. That 13% I quoted at the time was theoretical, but in China over the last three years the emissions reduction of new USC plants is even better, around 15% to 17%. This is off-the-shelf technology that handles base-load, produces cheap electricity, and reduces emissions.
USC 1000MW unit at Shanghai Waigaoqiao III Power Plant
The data comes from this link to Shanghai Electric, about a number of plants now in operation for more than three years. Smaller plants of 100MW and less from the 70’s show emissions at 339 grams per KWH delivered. For large scale older plants, emissions are 330 grams per KWH delivered (similar to all (black) coal fired plants in Australia). For this new USC technology, emissions are down to 282 grams per KWH delivered.
Based on the large scale 70’s units, these new USC type plants consume 15% less coal, hence emitting 15% less CO2 per unit of delivered energy. For a typical large scale 2000MW+ coal fired plant, that means a savings of 2.6 Million tons of CO2 per year.
How does USC make coal burning more efficient?
The most efficient rotors in a power station are enormous. The rotor in 660MW generator could weigh anything up to 600 tons or more, and that huge weight has to be driven at 3000RPM (for 50Hz power — in the U.S. it is 3600RPM, for 60Hz power). That’s rotating that huge weight at 50 times a second. A typical large scale coal fired plant will have up to four generators, each capable of generating between 500 and 660MW. For a typical 70’s technology generator, that 660MW is the largest power rating currently in use. It takes a lot of energy to turn something so incredibly heavy at such an extraordinary speed.
It’s all depends on steam.
The rotor is the critical part, and more wire loops means more electricity. If you pass a wire capable of carrying an electric current through a magnetic field then a current will be induced to flow along that wire. You will get a larger electromotive force, and thus a larger current flow, if you scale everything up. More wire will give us more current and more power, but then the rotor is harder to push through the magnetic field. Likewise, stronger magnetic fields or higher speeds of rotation also give more power. So in a sense, the heavier the better.
Place a number of magnetic poles around a shaft, cool the area so the magnetic field is stronger, and wrap those poles in current carrying wire to further intensify the magnetic field. Then add series of these poles along the shaft, and rotate all that at high speed. This is the rotor of a typical generator (in actual fact, a turbo alternator).
This high speed rotor then induces power into the stator, huge amounts of wire wrapped in a shell around, but not touching the spinning rotor. To turn the rotor we need a very large multi stage turbine. To drive that turbine, we need a huge amount of high temperature, high pressure steam. Coal is what boils the water to make that steam.
What makes USC different is the huge amount of high temperature and high pressure steam it can produce.
UltraSuperCritical. What does that mean?
The critical point of water occurs at 374C at a pressure of 22.1 MPa (3,208 psi), where liquid water and steam become indistinguishable. Above that point (Super Critical and USC), the water does not need to boil to produce steam. So, not only do you need less coal to make that steam, you now also have a saving in water use as well, as it does not need to boil.
The USC units currently in use in China are operating at 600C and 27MPa. In fact China is actively working towards advanced USC, with temperatures above 700C in the range of 760C. Like the U.S., Japan, South Korea and Germany, China have now all but perfected the technology. Originally it was imported, and in cooperation with non Chinese companies, but they are now proceeding on their own. China has already got to the stage where they have a number of plants with units driving 1000MW generators, the first to do so. They are further working towards generators with a capacities of 1200MW and even 1350MW, levels previously thought unattainable even with large scale nuclear power.
This graph shows the steady improvement in electrical power generation. Note the top black line (the MegaWatts size of the plant) is not linear. People were building plants in the 1950’s of 5 – 10 MW. Now we’re building 1000MW plants.
Development of Thermal Power Generation Technology in China – from USC Technology In China shown on Page 18 (pdf document)
Dr Craig Emerson, Minister for Science, Weather, Inventions, Factories and Universities.
After the leadership farce last week and the resignations of the more-sensible Labor ministers, Gillard has reshuffled again and the DCC (Department of Climate Change) is disappearing into a “super ministry”. It is a sign of the times.
The Prime Minister used her sixth ministerial reshuffle to merge the Department of Climate Change with the Department of Industry, creating a new Department of Industry, Innovation, Climate Change, Science, Research and Tertiary Education.
Is that DIICCSRTE?
Gillard has made Craig Emerson minister of nearly everything.
Gillard also appointed the former Woodside director, Gary Gray, to cabinet as mines and energy minister. The Climate Spectator is worried. Gray said something skeptical once in 1993: that the evidence linking human activity to climate change was ‘‘pop science”. Years later he apparently said he regretted the comments, but this was not enough to convince the religious that he has discovered the faith. He made the mistake of saying there needed to be “intellectual challenge and debate”. These plain and sane words marked him as a confirmed skeptic. Only skeptics want debates. A true believer prefers not to mention them, except to say they are over. The correct litany is “there is a consensus”.
It’s funny how even a weak expression of doubt 20 years ago is not forgotten. If it were just a question of science and evidence, 20 years is a long time, and anyone could have changed their mind. But if it’s a question of religion, or a tribal allegiance, then 20 years is an insight into his character.
UPDATE: It’s not even day #2 in a new ministership, and suddenly Gary Gray feels he has to join the chorus to declare he is not a skeptic, and his former words on Climate Change “embarrass him”. Presumably he had to toe the line, but it’s clumsy — he’s goes too far. The ALP never misses a chance to alienate half the population. How many skeptical voters will feel more represented or respected by the Labor Party now?
(Commenter Matt J notes that Andrew Bolt said on 2GB that he knows Gary Gray and he is a skeptic. )
UPDATE:“Greens slam merger as symbolic retreat on climate change”The Australian
“Greens leader Christine Milne blasted the move, saying it showed Ms Gillard was in “retreat on addressing global warming”. Senator Milne used the occasion to launch a broader assault on the government’s green credentials, citing Labor’s abandonment of its former Carbon Pollution Reduction Scheme in 2010. She claimed Labor had to be “dragged back” to tackling climate change by the Greens.”
“The Australian Conservation Foundation said the merger could lead to a loss of focus on co-ordination of climate change action, but warned against cuts to climate schemes in the May budget.”
Hey, Moon Landing Deniers… here’s an interesting tid-bit and an epic project. The historic engines that propelled Neil Armstrong and Buzz Aldrin on their trip to the moon (with Michael Collins orbiting above them) have not only been found but recovered. These F-1 engines fell back to Earth at 5,000 miles per hour and sank four kilometers underwater in the Atlantic. (The Apollo 11 crew splashed down later in the Pacific on July 24, 1969.)
It was not immediately clear when or where the objects might be displayed, but Mr Bezos said when he launched the project last year that he hoped they could be viewed at the Smithsonian’s National Air and Space Museum in Washington.
Remember all the fuss? What happened to Earth Hour 2013?
It’s that time-of-year for the hour of Green Darkness. But how times have changed. On Their-ABC, the only mention I can find is this: “Is Earth Hour dead?” The Age and The SMH pay lip-service to Earth Hour with an article in today. But there is nothing like the hype of previous years. The Guardian puts on the best spin, but concede Lomborg might be right. Even the Huff Po is telling us it’s a waste of time.
It appears Lomborg took the fun out of it by pointing out that Earth Hour was a waste-of-time token that produced more emissions than it saved.
Earth Hour teaches us that tackling global warming is easy,” Lomborg writes at Slate. “Yet, by switching off the lights, all we are doing is making it harder to see.”
How so? Well, for starters, Lomborg argues that more than a billion impoverished people around the world have no switch to flip, lacking the electricity that we take for granted. Earth Hour, he implies, demonizes a technology that has lifted great swaths of humanity from lives of great burden and toil — and which the globe’s poorest still so desperately want and need.
The Australian home of “Earth Hour” is still pretending it’s a big deal, but they’ve shifted the emphasis from one hour of darkness to pledges of support for renewable energy. (Hey, out of 22 million Australians apparently 6,012 have promised to “support” renewables! Since we all “support” renewables with our taxes and electricity bills, that means only 0.03% of Australians do it voluntarily.)
They’ve signed up John Hewson to support it, and he’s enthused, and thinks a few hot weeks has got something to do with you leaving the lights on. But this exchange tells you all you need to know about our priorities.
[SMH] Mr Hewson, meanwhile, said his decision last December to become a director of Larus Energy, a gas developer in Papua New Guinea, did not detract from his renewables push.
“Gas is better than coal,” he said.“Take a place like PNG, I’d rather be burning LNG than burning diesel.”
Barely 12 per cent of the country has access to electricity, Mr Hewson said, and even the capital Port Moresby is routinely cloaked in smog after regular black-outs force residents to use diesel generators. “Everything’s an improvement on that.”
Some of those fossil fuels have been waiting for 100 million years to return to the sky.
Things you can do at 8.30 on Saturday:
Turn on all the lights you can find (bonus points for incandescents from the stash.)
Put on the party lights, the patio light, the pool light, the mozzie zappers, unpack those Christmas decorations. Get out your torches. Switch the movement detector spotlights to continuous operation. (Involve the kids — they love to help).
Light your backyard with the landcruiser headlights! (Don’t flatten the battery, make sure you keep that engine running.)
Don’t forget those bar radiators — revel in that infra red! (Light the kitchen with the ones in the oven and grill.)
Drink German Beer and or French Champagne. Drink toasts to coal miners, oil rig workers, and power station staff.
In the hundred thousand years since homo sapiens came to be, people have fled bondage, wars, small-pox, dysentery, died from minor scratches, starved to death, been ravaged by lions, stricken by cholera, and survived ninety thousand year stretches of abysmal ice age. We lived in the darkness for 99,900 years, cowering in corners, listening to drips, waiting for the sun.
There is only one type of Freedom – and all else is servitude, slavery or tyranny.
It’s your chance to show your commitment to fighting the forces of darkness.
People across the UK are rolling in the aisles in laughter.
Lewandowsky’s latest paper, “Recursive Fury” (which has just reappeared), categorized a comment by Richard Betts under the heading “Excerpt Espousing Conspiracy Theory” (in the supplemental data). But instead of being a comment from a rabid tin-foil-hat skeptic, Betts turns out to be Head of Climate Impacts at the UK Met Officeand an IPCC lead author.
When Betts was informed about this by Barry Woods, he tweeted “Lewandowsky et al clearly deluded!”
Here’s the comment by Betts that Lewandowsky et al think demonstrates conspiracist ideation. Betts is pointing out how easily the authors of the original paper (claiming that skeptics-believe-the-moon-landing-was-faked) could have posted their survey link in places where skeptics were actually likely to see it. The Moon landing paper — after all — claimed to analyze skeptics but ended up getting results only from sites that were virulently anti-skeptic.
Richard Betts: “The thing I don’t understand is, why didn’t they just make a post on sceptic blogs themselves, rather than approaching blog owners. They could have posted as a Discussion topic here at Bishop Hill without even asking the host, and I very much doubt that the Bish would have removed it. Climate Audit also has very light-touch moderation and I doubt whether Steve McIntyre would have removed such an unsolicited post. Same probably goes for many of the sceptic blogs, in my experience. So it does appear to that they didn’t try very hard to solicit views from the climate sceptic community.”
In this debate there were literally thousands of comments about the moon-landing paper. What bad luck that of all the ones they could have chosen as “raw data” demonstrating their theory, they pick one from someone who clearly shows how blind their tool is? How unfortunate. As head of a UK Met Office group, is Betts driven by his ideology?
It rather exposes the banality of it all. Betts made a reasonable point, didn’t posit a conspiracy, yet Lewandowksy et al think it’s an example of “recursive fury”.
John Cook replied: supplementary data for Recursive Fury are any comments *related* to particular theory. It’s raw data, not final paper.
Betts to Cook: You included my remark in list entitled “excerpts espousing conspiracy theory“. This means you think I buy conspiracy theory. So are you now saying that you agree that my remark was *not* espousing conspiracy theory?
Lucia jibes: Thinking Lew authors didn‘t try hard to solicit skeptic views = evidence of conspiracy ideation. The rule is: “criticism of Lewandowsky“ = “Conspiracy ideation“
Richard Betts: I think there‘ll be a few laughs about this at the office tomorrow! Anyway, bedtime – ‘night!
Cook now says people are misrepresenting the paper (by quoting it exactly? oh how cruel), and claims he and the other authors got the header wrong, but not that their entire methodology is flawed.
UPDATE: Rudd refused to contend. Gillard and Swan “won” uncontested. (The ALP loses.)
QLD State Liberal Premier Newman calls for a federal election. “‘The country cannot afford the waste of time; the paralysis we’ve seen.'”
———————————————
It’s on. Finally.
You may have thought it was about planetary radiation, or moist adiabatic lapse rates, but Hoffman is here to save you from the waste-of-time science debate. Discussing science with “climate deniers” is like “talking to a wall” he says. We agree — anyone who denies we have a climate is thick-as-a-brick. Have you ever met one? No, neither have I. The mythical climate denier seems to be causing global warming through their inaction, but no one as yet, can name a single person who denies the climate.
I’m sure Hoffman wouldn’t want to be loose and inaccurate with his words — so no doubt he will find an actual “climate denier” or start to speak English instead.
Perhaps the debate he says he wants, will start when we speak the same language?
It’s obvious the Great Global Warming Scare is unravelling when the losing team turn into sour-puss-psychologists — finding dark mental failings in those too stupid to understand their Gift with The Weather.
When it comes to pop-psychology anyone can play…
Hoffman thinks skeptics aren’t convinced because they are afraid:
MANY climate sceptics do not trust environmentalists because they consider them “borderline communists” who want to curtail people’s freedom, a leading US social scientist says.
Speaking on Wednesday night, the University of Michigan’s Andy Hoffman said US global warming sceptics had “a serious distrust of the political ideology behind its proponents”.
“The fear is that environmentalists are left-leaning, they are socialist, borderline communists, and they are using the government to try to control your freedom,” Prof Hoffman said in the Sydney Ideas lecture at the University of Sydney.
“The expression for environmentalists is watermelons, they’re green on the outside, but they’re red on the inside. That really represents their feeling.”
We think Hoffman is using pop-psychology because he doesn’t have the science. (He will disagree. All he needs to do is phone-a-friend and find that mystery paper — the one that finally shows the models assumptions about relative humidity in the upper troposphere were right?)
Though he seems confused:
“It’s not about CO2, it’s not about climate models, it’s about values, it’s about world views,” the business and environment academic said.
If it’s not about CO2, that explains why the carbon tax doesn’t work. Will it cool the planet if I drive my SUV with a different world-view instead?
I can do that… 🙂
Once again, those-without-persuasive arguments resort to character assassination and confounding slurs:
Professor Hoffman said a “social consensus” to fight climate change needed to be built, similar to that created in the past to combat smoking and slavery.
(So does that mean finding some evidence to support your case Andy, or were you thinking “Civil War”?)
This about sums up the current state of play:
The losing team are plain flummoxed and confused. They tried to convince the unconvinced by calling them “Deniers” but that didn’t work. Then they declared that 97% of the anointed Gods-of-Climate-Science had seen the light through unvalidated climate simulations. When skeptics pointed out the models were wrong, the upper tropospheric hot spot was not there, and 7000 quintillion joules of energy were missing, the climate scientists responded that the skeptics were oil funded renegades from the tobacco movement.
At this point the dumb punters became more skeptical.
Not so coincidentally, about then, the pop-psychologists appeared to try to pretend they are not losing.
My favourite line
“One of the most important first steps in engaging the debate is not to blame or mock or ridicule,” he said.
Which is why he calls us deniers right?
—————————————————–
h/t To Geoff Derrick
PS: Sorry to Barry. I know we talked about being nice.
PPS: Thanks to the good souls who’ve been donating to my personal account. I didn’t realize it was so busy. Cheers to Keith (x 3!), Rodney, MaxL, and especially Mal, Tom K, and Wes. 🙂
Here’s a benefit FOIA probably didn’t imagine. Skeptical networks. For anyone who doesn’t know, Jennifer Marohasy has published one of the longest-running skeptical blogs in the world, and she’s one of the few other women on the front lines. I don’t know why we hadn’t spent a long time on the phone before. I’m delighted that we are in much better contact…
FOIA is a recognised shorthand for Freedom of Information Act. Legislation by this name has existed in the USA since 1966, Australia since 1982 and the UK legislation was introduced in 2000. It was climate scientists at the Climatic Research Unit, University of East Anglia, conspiring to evade the UK FOIA that probably inspired Climategate, with Mr FOIA, as the “hacker” calls himself, releasing over 220,000 documents and emails beginning in November 2009. In a recent email he explained: “The circus was about to arrive in Copenhagen. Later on it could be too late.”
By providing public access to emails and documents from leading climate scientists, Mr FOIA exposed how tricks, adjustments, and corrections, were routinely applied to climate data to support the propaganda of the largely government-funded global warming industry.
I recently scrutinized documents from a successful FOI request by John Abbot to the Australian Department of Climate Change and Energy Efficiency, DCCEE. As far as I can make out from the documents the entire Australian Climate Change Science Program can be likened to what Mr FOIA describes as “a massive hole-digging-and-filling-up endeavor” for which the climate scientists are generously remunerated by the Australian taxpayer. Let me explain in more detail:
Modern history suggests that democracy aligns, and progresses, with the expansion of civil liberties including access by the ordinary citizen to government information. But in the Climategate emails, it is clear that leading UK climate scientists held the FOIA in contempt, considering it a waste of time and recommending that data and information be deleted rather than released. The problem extends beyond the CRU to western democracies more generally where ballooning bureaucracies are increasingly reluctant to share information with their public. Yet without meaningful public oversight of public expenditure there is reason to fear that government bureaucracies will become self-serving and oppressive which is the antithesis of the egalitarian democratic ideal.
“It appeared that there were significant accounting discrepancies suggesting the overpayment of CSIRO and BOM of about $10 million.”
In Australia, for example, public expenditure on global warming has continued to increase, but there is no evidence that there has been any corresponding improvement in climate science, for example, through improved seasonal rainfall forecasts.
In March 2010, John Abbot – a PhD scientist who is also a qualified solicitor – made a Freedom of Information request to the DCCEE asking for documents concerning the Australian Climate Change Science Program, ACCSP, including how monies were allocated between specific projects and the outcomes from these projects. The request was initially denied, claiming various exemptions as detailed in recent peer reviewed articles in Environmental Law and Management [1] and Public Law Review [2].
Following a protracted appeal process through the Information Commissioner that included scrutiny of the manner of application of the public interest test and bogus claims of intellectual property rights, the original decision was reversed and the documents were eventually released.
These documents detailed funding for 160 government climate scientists, almost all of these employed by the CSIRO and Bureau of Meteorology, BOM. It appeared that there were significant accounting discrepancies suggesting the overpayment of CSIRO and BOM of about $10 million. The DCCEE has declined to comment on the discrepancy, in particular the provision of funding for salaries apparently far in excess of what could be reasonably justified and supplementary to core agency funding.
Professor Abbot’s FOI request was made at a time when there was much public discussion and debate about the merits of the newly-elected Australian federal government introducing significant economic reform by way of a wide ranging carbon tax to address issues of anthropogenic global warming. The BOM and CSIRO were cited in support of government policy developed by the DCCEE and underpinned by the assumption that the Millennium drought (2001-2009) was linked to climate change.
The BoM and the CSIRO had directed much of their research efforts towards understanding rainfall patterns and generating rainfall projections by using General Circulation Models, GCMs. These are the same models that are relied on to provide evidence for global warming associated with greenhouse gas emissions. The models require very large capital expenditures for supercomputers (tens of millions of dollars) and are also very expensive to run to perform calculations. A reasonable question from a public interest perspective is therefore – do these models perform well at forecasting rainfall? After investing millions of dollars, has this actually improved rainfall forecasts in a practical way? There is no evidence, however, in any of the documents released under FOIA that the DCCEE has any interest in the real world application of this climate research.
UPDATE: Cash is being flown to British Troops in Cyprus. The banks will stay shut til Thursday. The finance minister has resigned. [SkyNews]
Remember how the EU was supposed to promote stability?
Sooner or later a central fund managed by central bureaucrats is going to fail in a “central” way. This isn’t it, but we are getting closer to the center.
Without competition between states on currency, Europe left itself open to be a case study in centralized stupidity. The bureaucrats needed to stop the waste of public spending, they needed to halt the corruption, increase competition. And their answer? Steal 10% of depositor’s funds from everyone in Cyprus. It seemed like a good idea at the time.
We are now in new territory. In previous bank bailouts, if anyone took any losses it was the shareholders and the bond holders, and the depositors did not lose any money. In the Cyprus bail out, the bondholders and shareholders lose nothing but the depositors lose about 10%. (Any chance the bondholders of the Cyprus banks include the ECB or IMF?)
Where is the natural law that makes sense in this decision? Don’t punish the shareholders, or the bondholders, break the centuries long promise that is the entire reason for banking. If the government can steal your money in the bank, why keep it there? Hello Bank-run.
Wasn’t the point of banking to keep your money safe from burglars?
The Cyprus move is changing everything:
James Turk : “There are bank runs here in Europe again, Eric. Today is a national holiday in Cyprus, so the banks are closed. But people are lining up at ATMs to get their money out before the ATMs run dry. And there is talk that a bank holiday will be declared, possibly keeping them closed for days.
Depositors in Cyprus are going to lose some of their money as part of a proposed EU bailout of that country announced over the weekend, which like a a number of other countries, along with its banks, are insolvent and teetering on the edge of bankruptcy….
“To help fund this bailout the government is taking 9.9% of all deposits over €100,000 and 6.7% under that amount, even though these small deposits are supposed to be insured, which is a key point. Bank insurance means nothing these days when bureaucrats and politicians are looking for wealth to grab.
It is indeed mind-blowing, particularly when considering that the banking system in Cyprus is not that big. The total amount taken from depositors is only €5.8 billion. Given what the ECB and other central banks are printing these days, €5.8 billion is small change.
James Turk Founder & Chairman of GoldMoney
This is organized crime on a mass scale. The not-so-funny irony is that it’s organized crime against organized criminals!
The bureaucrats not only broke the rules, but look who they targeted. If you were hoping for easy money to patch up the budget, would you take it from the Russian mafia and ex-KGB officers?
Despite the fuss about CO2 emissions, on a global scale no one is quite sure where a lot of it ends up. Those mystery “sinks” draw in a large proportion of CO2. Here’s a big sink that just got twice as big.
Science Daily Mar. 17, 2013 — Models of carbon dioxide in the world’s oceans need to be revised, according to new work by UC Irvine and other scientists published online Sunday in Nature Geoscience. Trillions of plankton near the surface of warm waters are far more carbon-rich than has long been thought, they found. Global marine temperature fluctuations could mean that tiny Prochlorococcus and other microbes digest double the carbon previously calculated.
The trouble started when someone made an assumption.
You might have thought that photosynthetic life forms had the Earth covered, but according to some researchers the largest ecosystem on Earth was just discovered and announced last Thursday, and it’s powered by hydrogen, not photosynthesis.
The Oceanic Crust is the rocky hard part under the mud that lies under the ocean. It covers 60% of the planet and it’s 10km thick. (The oceans themselves are a paltry 4km deep on average.) We’ve known for years that the isolated hot springs in trenches held life. But who thought that all the hundreds of thousands of square kilometers of basalt rock in between had its own life cycle? Last week a group from the Center for Geomicrobiology at Aarhus University, Denmark announced that they had drilled through crust that was 2.5km underwater and 55 km away from anything that mattered. They found life in the basalt.
“We’re providing the first direct evidence of life in the deeply buried oceanic crust. Our findings suggest that this spatially vast ecosystem is largely supported by chemosynthesis,” says Dr Lever, at the time a PhD student at the University of North Carolina at Chapel Hill, USA, and now a scientist at the Center for Geomicrobiology at Aarhus University, Denmark.
The microorganisms we found are native to basalt,” explains Dr Lever.
It’s a hydrogen powered life
Energy from reduced iron
We have learned that sunlight is a prerequisite for life on Earth. Photosynthetic organisms use sunlight to convert carbon dioxide into organic material that makes up the foundation of Earth’s food chains. Life in the porous rock material in the oceanic crust is fundamentally different. Energy — and therefore life’s driving force — derives from geochemical processes.
“There are small veins in the basaltic oceanic crust and water runs through them. The water probably reacts with reduced iron compounds, such as olivine, in the basalt and releases hydrogen. Microorganisms use the hydrogen as a source of energy to convert carbon dioxide into organic material,” explains Dr Lever. “So far, evidence for life deep within oceanic crust was based on chemical and textural signatures in rocks, but direct proof was lacking,” adds Dr Olivier Rouxel of the French IFREMER institute.
It’s not just hydrogen-powered, there’s sulphate, methane, and carbon fermentation too
Even though this enormous ecosystem is probably mainly based on hydrogen, several different forms of life are found here. The hydrogen-oxidising microorganisms create organic material that forms the basis for other microorganisms in the basalt. Some organisms get their energy by producing methane or by reducing sulphate, while others get energy by breaking down organic carbon by means of fermentation.
These bugs are not the same ones in the sea water. There is no oxygen, and while they are in old rocks, they are not fossils
There are probably only ten people in Australia who haven’t heard it was the Hottest Ever, Record Summer Downunder. And they were probably born yesterday.
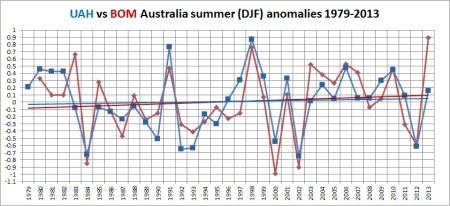
Summer here was so scorchingly awful it was Angry. But a funny thing happened on the orbit overhead. Check out the UAH satellite data on summers since the UAH records began. The graph below (thanks to Ken) is the temperature data from the NASA satellites, processed by UAH (University of Alabama in Huntsville). Strangely there is a disparity between what the satellites recorded and the BOM.
The satellite data shows that the summer of 2012-2013 was close to ordinary, compared with the entire satellite record going back to 1979. Not a record. Not even extreme?
According to UAH satellite measurements summer in early 2013 was not a record. Not even close.
The graph data comes thanks to John Christy, Director, Earth System Science Center, Distinguished Professor, Atmospheric Science
University of Alabama in Huntsville, Alabama State Climatologist and Roy Spencer. It was graphed by Ken Stewart at KensKingdom, and inspired by Tom Quirk at Quadrant. I was very happy to connect them this weekend. The data cover “average lower troposphere temperature anomalies for land grids only for the region 10S-40S by 110E-155E.” UPDATE: The data in the graph above does include Tasmania as well, and does not include PNG or Timor.
Perhaps there is some error in the data? But on Ken’s site, you can see he gets a reasonably close correlation for most points with ACORN.
As Ken says:
According to BOM, last summer was a record, yet the satellites say it was pretty ordinary- 14th warmest out of the last 35. The last time there was such a large discrepancy was 1983- the two series since then have been reasonably similar.
Ken Stewart compared the UAH summer record to the BOM one.
…
Note though that the other large discrepancy was 1983 which was also a year when the BOM records a very high temperature, and UAH records an average one. Perhaps that is a clue?
The UAH data is not covering the same area as the BOM stats do.
There is no Tasmanian data, and while a lot of surrounding ocean is included in the longitude and latitude, the UAH data is for land-grids only. The black rectangle marks the land covered in the UAH satellite data.
UPDATE: John Christy sent a second set of data to Ken that does include Tasmania and doesn’t include Indonesia and PNG. I will update the graphic below as soon as I can. The UAH data is more accurate than I thought.
Even if the UAH data included some ocean stats leaking into the mix, according to the BOM the ocean was the hottest on record in any case.
The Age quotes the BOM telling us that seas weren’t just warm, and it wasn’t just one month. It was the hottest, and it was all of summer:
Seas around Australia are also warmer than usual, with surface temperatures reaching record highs at the end of February, according to a Special Climate Statement issued by the Bureau of Meteorology in the wake of this month’s heatwave across south-eastern Australia.
Summer sea temperatures were 0.5 degrees above normal and the warmest since records began in 1900, the bureau said.
The Australian BOM says: “Summer ocean surface temperatures around Australia were the highest on record.“ (March 12)
Note the warm water surrounding the Western and Southern coasts on the latest ENSO map (below).
“We are heading for somewhere that is far off from anything we have seen in the past 10,000 years – it’s through the roof. In my mind, we are heading for a different planet to the one that we have been used to,” said Jeremy Shakun of Harvard University, a co-author of the study.
There are two factors in the new Marcott paper that are major red flags. For one, there is hardly any data in the modern end of the graph. Ponder how researchers can find 5,000 year old Foraminifera deposits, but not ones from 1940? Two: they’ve smoothed the heck out of longer periods. Marcott et al clearly say there is “…essentially no variability preserved at periods shorter than 300 years…” So if there were, say, occurrences of a warming rise exactly like the last century, this graph won’t show them.
Some of the data has a resolution as poor as “500 years” and the median is 120 years. If current temperatures were averaged over 120 years (that would be 1890 to now), the last alarming spike would blend right in with the other data. Where would the average dot be for the “last 500 years”. It would be low, cold, and there would be no hockeystick at all in a “500 year” averaged graph. But if there was a period of rapid warming sometime in the last 10,000 years, one which occurred over say, 50 years, it would disappear amongst the uncertainties.
Robert Rohde (of the BEST Project) points out that so much of the variance is lost that it is equivalent to smoothing the series with a 400 year running average, saying “it will completely obscure any rapid fluctuations having durations less than a few hundred years.”
It may be necessary to sacrifice the variance, and blend and blur those past peaks (given the uncertainties) but after doing so, how can Marcott et al say anything at all, even a squeak, about the rate of warming in the last 100 years?
In the end the hockey stick seems to come from a 20 year “reconstruction” of data that has a median of 120 year resolution. Would that have the effect of heavily weighting some proxies while smoothing out the others? It’s all very well to trumpet that there are 73 proxies, but some of them obviously count for a lot more than others.
Repeat of the old hockey-stick: The last 2,000 years.
The new hockey-stick blends high and low resolution data from many proxies in the past with mixed resolution data (but few proxies) in recent times. It’s a complex method which produces something not seemingly reflected in the actual proxy data. Where are the hockey-stick-proxies? It also doesn’t help that ten percent of all 73 proxies fail their own criteria for inclusion. (Thanks to Willis for all those spectacular spaghetti graphs, and thanks to both Craig Loehle, and Roberto Soria for advice).
There appear to be hardly any records from the time of the spike?
Am I reading this incorrectly? Note fig a and fig e here. See that dive to zero on the right hand edge — just at the point that the “hockey-stick” appears in lower graphs? Are there virtually no proxy records during the time of the spike? Note that the lines in the other graphs here come from “temperature reconstructions” which are area weighted and “Monte Carlo” based graphs.
.Fig. S10: Temperature reconstructions separated by latitude. (a) Number of records used to construct the temperature stack through time for the 5×5 degree weighted 90-60°N sites (black line), 60-30°N sites (blue line), 30-0°N sites (green line), 0-30°S sites (pink line), 30-60°S sites (purple line), and 60-90°S sites (brown line). (b-d) 5×5 degree weighted temperature envelope (1-σ) of the global temperature anomaly (blue fill) plotted against the 5×5 degree weighted latitudinal sites. Uncertainty bars in upper left corner reflect the average Monte Carlo based 1σ uncertainty for each reconstruction, and were not overlain on line for clarity. e-h same as a for the last 11,300 years. Temperature anomaly is from the CE 1961-1990 average. Note that b and f have larger y-axes, but are scaled the same as the axes in c,d,g,h. (Click to enlarge)
See also the next figure. Note in a and d, the ragged edges as the proxies run out of data on the right? See how the number of records plummets to zero? Note how this correlates with the spike (c and f). Steve McIntyre writes that the Alkenone proxies are the largest group of proxies (31 of 73) yet the uptick is mysteriously absent from the data. McIntyre does not believe that the uptick is due to splicing in of the instrumental data, but cannot explain it yet. Can Marcott explain it? You would think so, but his response left McIntyre baffled.
Fig. S11: Temperature reconstructions separated by ocean vs land. (a) Latitudinal distribution of the records used to construct the terrestrial (brown bars), and ocean records (blue bars). (b) Number of records used to construct the temperature stacks through time (terrestrial – brown line; ocean–blue line). (c) Global temperature anomaly 1-σ envelope (5×5 degree weighted) (blue fill) and terrestrial (brown), and ocean records (blue). Uncertainty bars in upper left corner reflect the average Monte Carlo based 1σ uncertainty for each reconstruction, and were not overlain in plot for clarity. d-f same as a-c for the last 11,300 years. Temperature anomaly is from the CE 1961-1990 average. (Click to enlarge)
Notice in c, the hockey-stick spike is coming mostly from the “ocean”? Hmm.
Regarding the NH reconstructions, using the same reasoning as above, we do not think this increase in temperature in our Monte-Carlo analysis of the paleo proxies between 1920 − 1940 is robust given the resolution and number of datasets. In this particular case, the Agassiz-Renland reconstruction does in fact contribute the majority of the apparent increase.
…
Regarding the SH reconstruction: It is the same situation, and again we do not think the last 60 years of our Monte Carlo reconstruction are robust given the small number and resolution of the data in that interval.
So why all the newspaper headlines? The non-robust result turns into a PR message.
Did they mention this is the paper in paragraph four as Marcott says? Well, kind of — not really. Here’s a “hint”:
Without filling data gaps, our Standard5×5 reconstruction (Fig. 1A) exhibits 0.6°C greater warming over the past ~60 yr B.P. (1890 to 1950 CE) than our equivalent infilled 5° × 5° area-weighted mean stack (Fig. 1, C and D). However, considering the temporal resolution of our data set and the small number of records that cover this interval (Fig. 1G), this difference is probably not robust. Before this interval, the gap filled and unfilled methods of calculating the stacks are nearly identical (Fig. 1D).
He’s saying the “difference” between the two versions is not robust, but not that the main feature of the graph is fickle, flakey, or may disappear under analysis. (Thanks to McIntyre and Eschenbach for spotting that.)
Me, I wonder why Science published the paper in the first place?
The proxies, the proxies
Now look at the graphs of the actual proxies offered in the supplementary material. Note how the proxy data – in red and blue lines shows no hockey-stick. But this is the tropics, so that’s not unexpected.
We use cookies to ensure that we give you the best experience on our website. If you continue to use this site we will assume that you are happy with it.












Recent Comments