Why does “seven years” suddenly matter?
“The past 7 years have been the hottest on record
“by a clear margin,” scientists say”
Since when do we do climate analysis on seven year periods? — Since climate scientists get rewarded for scaring taxpayers and “seven” is this years lucky number.
2021 wasn’t THE hottest year so they have to come up with something
In climate “science” there are always a thousand combinations and permutations of climate records to pick from, so it’s a snap to find one that sings. If it wasn’t the hottest year in 2021, it might have been the hottest global summer, warmest winter, driest spring, or stormiest “on record”. And if temperatures stop rising, the hottest year record stretches elastically into the hottest 2-years, 3-years and 5 years-on-record.
Scientifically, the climate interval that matters most is whatever it has to be to stretch out and sing “Bingo” — “The Met Bureau needs more money.”
Naturally all Climate Bingo games are boosted by inexplicable adjustments, badly placed thermometers, shrinking thermometer screens, and the process of constantly rewriting history. If the incinerators near thermometers don’t do it, the homogenization will. They might be Australian tricks, but most Met Bureaus are the same.
Remember the shocking heat of 1998 — the UAH satellites still do, but all the other temperature sets have erased it.
….
It also helps that most of history has been wiped out
The collective amnesia at Met Bureaus doesn’t just include days like the hottest day ever recorded in Australia in modern equipment (which was 51.7C in Bourke in 1909). They also erase the longest hottest summer at Marble Bar too. The Met Bureaus also forget the Medieval warm period, the Romans, Minoans, and the whole damn Holocene. They forget the Eemian, Aveley, Holstein and Hoxnian interglacials and most of the last half billion years of records, almost all of which were hotter than the hottest parts of the Holocene, which was hotter than 2021.
The last 500 years has been the coldest of the last 5,000
Two can play Climate Bingo. In the history of human civilization we’ve never lived through six centuries that were colder than the last six. Maybe that’s more important than a 7 year hot record in the “blip” at the end?
It’s been cooling for 6,000 years.
The blip of modern warming is higher than the graph shows (which ends in 1855). Things might be the same temperature now as a thousand year ago. But all the records we set today are nothing in the big scheme…
UPDATE: See how serious the global warming has been in Greenland since that ice core ended in 1855, the total rise since then is 2C, which has almost entirely occurred by 1880. The effect of CO2 since 1880 has been almost nothing in Greenland.


It has been a wet Spring and Summer so far, which has flushed Flannery’s hyperbowl down the gurgler of history.
390
Enduring the statistical impossibility of “climate scientists” and MSM pontifications on climate at times, is like watching to a bunch of galahs on a wire fence….makes as much sense too…although when theyre on an HV line it becomes potentially more entertaining…
100
Agree Flannery is an idiot, but please remember that Australia is bigger than its extreme eastern fringe – where obviously you live. It’s bloody dry for most of us east of the Great Divide.
31
2021 was a very close to “median” year temperature-wise in UAH data for Australia.
21st warmest out of 43 years.
The effect of the 2015-2017 El Nino/Big Blob,(neither of which had any human CO2 causation whatsoever) which caused the spike in warming over the last few years has all but disappeared.
Looks like we might be in La Nina territory for a while now, and the scared chicken-little children at BoM will have to be even more imaginative with their fantasies.
310
It really is all in the eye of the beholder Jo! I would rather be a degree warmer to support plants, greening and rainfall than colder.
330
This misleading graph again.
The graph doesn’t “stop in 1950”, it stops at 1855.
Also, it is a graph showing only ice core data as a temperature proxy, only from Greenland.
535
Happy to see the ice core data from Singapore.
581
ROFL….
Nice one, Centurion….👍
121
Craig, thanks for the proofreading. Not that it makes any difference to the point.
The axis of the graph ended at 95 “Years before Present (1950 AD)” which is 1855. In the paragraph after I said 1950 when I meant 1855. Fixed, thank you. But perhaps you missed the part where I said “The blip of modern warming is higher than the graph shows. Things might be the same temperature now as a thousand year ago.”
But let’s look at the last 150 years of warming in Greenland – at this graph and this post. Curious the way the temperatures in Greenland have been constant since 1880 don’t you think? Should we talk about that some more?
In other words, there is nothing misleading about the graph when we’re talking about 500 cold years in the last 5000.
60
Big deal.
If the temperature had risen significantly since 1855 there would have been a commensurate melting of polar ice caps and significant rise in oceans. Neither has been noted.
441
“The graph doesn’t “stop in 1950”, it stops at 1855”
Wrong..
Even your AGW favourite Mickey Mann hockey schtick shows the uptick starting in 1900.
The end point is therefore around 1950.
The current world temperature is only a degree or so above the coldest period in some 10,000 years.
The world is not “warm” .. it is tepid at best !
420
Here’s the Vinther INSTRUMENTAL study of Greenland for the last 200+ years and the decadal data for the most recent temps compare very well with much earlier decades.
And alarmists Jones and Briffa were part of this long 2006 study and everyone should compare decadal temps for the last 200 + years. Please look up Table 8 of the study link. All seasons and Annual data are shown.
Please start to wake up.
https://crudata.uea.ac.uk/cru/data/greenland/vintheretal2006.pdf
131
A quick skim of this paper suggests that climate scientists should learn about degrees K. If you replot the graphs properly (degrees K, starting from zero), you’ll notice that there has been no significant warming.
00
Craig Thomas is back after a long absence.
Thanks Craig for your observation.
How do you know the graph stops in 1855? Who added the red bit on?
I have traced the graph back to this article by David Lappi from Feb 2010.
https://joannenova.com.au/2010/02/the-big-picture-65-million-years-of-temperature-swings/
140
That graph says so much about the alternate reality which the Climate Catastrophe Machine has tried to hide.
Admittedly this is “almost polar” territory, but the temperature oscillations of the last seven thousand years have a parallel in the world’s sea levels which have also oscillated down through a minimum of 4.2 metres to the present.
The truth has always been out there but it’s hard to fight the forces of evil that gave us CAGW and Kovid19 to contend with.
We aren’t fighting science, as always, this is about the continuing story of human ugliness, greed and the need to dominate others.
270
2005 was the last really hot year in Eastern Australia. Before that 2003. Nothing since then has come close. We are struggling to get to average temperatures this year. Again.
170
Over here in eastern Eastern Australia, the muggins at Metservice and noddies at NIWA are reading from the same pre-prepared script. They’re that desperate they’ve even hauled out Kevin Trenberth (of Climategate infamy), calling him an honorary academic [sic], who claimed ocean temps are “relentlessly increasing globally” because man’s “carbon” is warming the deep seas. Say what?!
NZ’s average temp for 2021 was, allegedly, the hottest evaaah! on a not-so scorching 13.56 degrees Celsius, with the highest recorded (39.4) in Ashburton during a roaring nor’wester foehn wind off the Southern Alps [they conveniently forgot to mention it was SNOWING on the same mountains the week before, and after, this orographic summer snow-storm warm-blast].
Somehow the Fatt-CHEKAs let slip that the hottest temp recorded, a searing 42.4 C at Rangiora, again during a roaring nor’wester, occurred “nearly fifty years ago”, ie. mid-1970s. Ah well, we’ll see what Cyclone Cody brings us this weekend…
130
1998 was very hot (the huge El Nino of the late 90’s being the cause as I understand it) in Victoria – where I lived at the time.
50
Sorry, my comment is not to try to imply that 1998 is after 2005. I might be stupid, but not hat stupid.
30
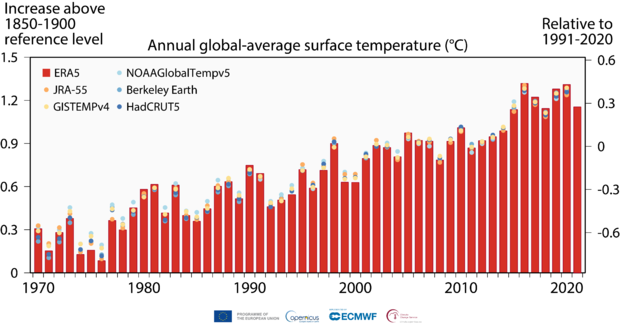
How can there be an 1850-1900 reference level in the first graph when all temperature observations before 1900 have been “cancelled”?
110
How can there be an 1850-1900 reference level in the first graph when all temperature observations before 1900 have been “cancelled”?
Not all look at Daily maximum temperature Melbourne Regional Office Station 086071 1856 Days above 30C
11 Days above 30C in March 1856
Station 086071 opened in May 1855 and 1855 only has May-Dec 1855
90
Oops Link does not seem to work
http://www.bom.gov.au/climate/data/index.shtml
select 1: Selected: Daily maximum temperature
3: Get the data
If you already know the station number you may enter it below instead of using the search above.
Station number 086071 Your data will open in a new browser window
Select 1856
http://www.bom.gov.au/jsp/ncc/cdio/weatherData/av?p_nccObsCode=122&p_display_type=dailyDataFile&p_startYear=1856&p_c=-1481637110&p_stn_num=086071
60
I have from two impeccable sources the highest ever maximum temperature recorded in Australia. One is Encyclopedia Britannica (1963 edition) which states Cloncurry, QLD at 127.5F on page 920 of Volume 5. The other is the Australian Bureau of Statistics Year Book 1974, page 45 which states Cloncurry, QLD at 53.1C. No dates were given but both refer to the same reading taken in 1889 from memory. Using the link to the BOM Climate Data Online, I could not find this figure. Maybe someone else can.
Of course I was being facetious for using a reference period of so long ago when the graph starts at 1970.
20
Cloncurry was widely regarded as holding the record for the highest temperature recorded in Australia at 53.1 °C (127.5 °F) on 16 January 1889. Recent investigations have revealed that this temperature was measured in an improvised screen made from a beer crate and that it equated to 47–49 °C under standard conditions.[42] The highest temperature ever recorded at Cloncurry’s current weather station is 46.9 °C (116.4 °F),[43] well short of the now widely disputed 1889 temperature of 53.1 °C.
https://en.wikipedia.org/wiki/Cloncurry,_Queensland
In Jan 1944 they ran 19 days consecutatively over 40C
http://www.bom.gov.au/jsp/ncc/cdio/weatherData/av?p_nccObsCode=122&p_display_type=dailyDataFile&p_startYear=1944&p_c=-168298167&p_stn_num=029009
30
The highest temperature ever recorded at Cloncurry’s current weather station is 46.9 °C (116.4 °F)
http://www.bom.gov.au/climate/averages/tables/cw_029141_All.shtml
AN TOWNSEND: The western Queensland town of Cloncurry has long claimed the title of having recorded Australia’s hottest day – 53 degrees in the shade in 1889. Or was it?
Blair Trewin, from the National Climate Centre, spotted a glitch when he was studying the archives. The temperature was recorded in a beer crate.
BLAIR TREWIN: The beer crate actually worked quite well as a screen through most of the year, but there’s just during the window of six or seven weeks each year when the thermometers were getting overexposed to direct sunshine, and as a result of that the instruments were generally overheating by about four or five degrees.
IAN TOWNSEND: Which place in Australia then does hold the record, officially?
BLAIR TREWIN: The highest measured in a standard screen was 50.7, that was at Oodnadatta in 1960.
IAN TOWNSEND: The temperatures at Cloncurry are expected to soar above 40 degrees today and tomorrow. Can they nudge the record for Australia’s hottest Christmas Day – 48.3 degrees at Gascoyne Junction in Western Australia?
https://web.archive.org/web/20091104034004/http://www.abc.net.au/am/content/2003/s1015670.htm
20
Thanks for that info Ozzie. It didn’t occur to me to check Wiki!
Two things; (1) it was still bloody hot that day and (2) the world and Australia in particular carried on very well in spite of that false reading, save for some wars, until the late 1980s when the role of CO2 was questioned by a certain James Hansen. Now we have the legacy of trillions of dollars wasted trying to change the weather, a generation or two of brainwashed children and their parents and a never ending worldwide crisis which makes us long for the good old days of 2019 when there was no vaccination circus and the medical profession still had honour.
Rant over.
Thanks.
20
What happened to Marble Bar, reputedly our hottest town?
Son took up a contract near Newman before Christmas, the first week it was high 40s every day. According to windy it is still 43 @ 8 pm EST.
00
The European Union’s Copernicus Climate Change Service (ie alarmist by design) are also using the “seven year” meme.
https://cliscep.com/2022/01/10/top-spin/
Getting desperate, they are. !
110
Pot, kettle, black. Cherry-picking analysis time periods is something climate change deniers have been doing for years.
The GISP2 ice core data finishes at 1855 and is (duh) Greenland only. You can’t criticise temperature homogenisation techniques if you are going to make fundamental errors like this. Nor can you complain about overlaying actual temperature measures over proxy data and then do the same thing yourself.
https://www.carbonbrief.org/factcheck-what-greenland-ice-cores-say-about-past-and-present-climate-change
246
For the third time.
The oceans have been falling for the last seven thousand years with insignificant recent movement.
Can you work out what that means?
260
If all he has is “carbonbrief” to rely on, I doubt his ability to work out what much of anything means.
https://notrickszone.com/2018/08/08/arctic-ice-volume-surges-to-3rd-highest-in-16-years-amm-lowest-since-1972-maue-hits-mann/comment-page-1/#comment-1270487
10
So if Greenland has been cooler that the present for the last 2,000 years why did the Vikings settle there? And why did they report bushes and trees, evidence for which has been found with roots growing through graves excavated from that time. Tree roots don’t grow through frozen soil and permafrost is very hard to excavate esp. with wooden shovels or reindeer antlers.
340
See my reply to Craig Thomas above and then start to wake up.
141
“GISP2 ice core data finishes at 1855”
Wrong, Mickey mann’s HS shows the up-tick starting in 1900, so dates on Jo’s graph are correct
Now let’s look at the Holocene from around the world.
https://i.postimg.cc/BZTYgmFV/Holocene-Cooling-China-East-Yangtze-Region-Li-2017.jpg
https://i.postimg.cc/xC9XKVF0/Holocene-Cooling-Tibetan-Plateau-Northern-Li-2017.jpg
https://i.postimg.cc/YC6CqKLx/Holocene-Cooling-Southeast-Pacific-Shevenell-2011.jpg
https://i.postimg.cc/kXJLL1LB/Holocene-Cooling-Qinghai-Tibetan-Plateau-Chang-2017.jpg
https://i.postimg.cc/TYVwzW2c/Holocene-Cooling-Equatorial-Atlantic-SST-Rosenthal-17.jpg
https://i.postimg.cc/t47hp51j/Holocene-Cooling-Antarctica-West-Fudge-16.jpg
140
C’mon man, stop it, that’s science (lower case).
These fluffies only believe THE SCIENCE©.
110
A “carbonbreifs” fact-check…. roflmao. !
These are the guys that invented the AGW scam !!
They will do anything to try to keep it zombified after death.
160
How do trees grow underneath glaciers??
https://www.jioforme.com/melting-glacier-reveals-ancient-tree-stumps-in-warm-ages-so-whatsapp/590054/
https://notrickszone.com/2019/08/26/a-1000-year-old-forest-buried-under-alaskas-mendenhall-glacier-uncovers-a-warm-medieval-period/
Even the most IQ challenged must realise that it was significantly warmer when those trees were growing !
180
And in Greenland…
https://notrickszone.com/2021/08/19/new-study-retreating-east-greenland-glaciers-uncover-plant-debris-dating-to-the-16th-17th-centuries/
121
Cherrypicking wasn’t easy last summer in Germany, as it was difficult to grow at least a handfull tomatoes and chillis, to wet, to cold.
170
“Cherry-picking analysis time periods is something climate change deniers have been doing for years.”
Only to point out the fallacies in the cherry-picked data the alarmists are trying to rape us on.
“Oh look! Its hotter over the last 20years, we need more money”
“No, its colder over the last 50..”
“My [Snip]AD bigger than yours” “No, you’re measuring it wrong”
If the alarmists just shut up and got a real life we could all quietly get on with our lives.
110
Here is Hansen, Arctic to 1980, (dots are yearly data), with UAH NoPol tacked on the end, scales aligned as well as possible.
Notice that the peak in 2016 is less than the peaks of 1937/38
https://i.postimg.cc/26fgkpXm/Arctic-hansen-UAH.jpg
50
ps, the period from 1880-1940 is the red uptick on the GISP graph..
Clearly ending around 1940.. The dates on the GISP graph are correct within a small margin.
50
pps..
We can also see that the warming from 1880-1940 was significantly steeper than the warming from 1979-now.
60
Greenland ice cores are not a good proxy, Antarctic cores might be better. I’ll have a look, but in the meantime consider the prospect that we are at the mercy of volcanic eruptions.
https://e360.yale.edu/features/climate-clues-from-the-past-prompt-new-look-at-history
40
Note the bipolar seesaw.
https://www.researchgate.net/figure/Temperature-reconstructions-from-Greenland-and-Antarctic-ice-cores-spanning-Marine_fig1_325478792
20
Those annual global average surface temperatures are not actual temperature measures anyway. They are quasi-statistical model temperatures of a perfectly spherical “average” earth.
60
“climate change deniers ”
What is a “climate change denier”?
Come on Simon.. answer this question…
“What do we “deny” that you can provide solid, real scientific proof for.”
You have been asked this many times, and have fallen flat on your face at every attempt.
Either stop using the term, or back it up.
90
“What is a “climate change denier”?”
How do you deny something that isn’t happening.
60
It’s not cherry picking. For the umpteenth time, just selecting a few from many samples of the same techinique that show what you want while ignoring the others is cherry picking. Like when having 150 data sets of tree rings and deciding by the look of them which 10% you want to use.
This is a reconstruction that is supposed to reflect SST in the NH, not just Greenland. It is not selecting data to fit a theory. It was the conclusion of a study to test one. Argue it’s merits. Calling it “Cherry picking” is stupid and lazy.
50
Its good when bio-data backs up other proxy data.
https://i.postimg.cc/KYKZWXz3/arctic-rapid-freezing.jpg
https://i.postimg.cc/Z52CFHcM/Arctic-Greenland-Sha-17.jpg
Clearly showing that the Arctic is only slightly warmer than the coldest period in 10,000 years and cooler than nearly all the Holocene period.
40
The 2020 Singh study also found that Antarctica has not warmed since 1950 and of course it was warmer over periods of the earlier Holocene.
And the UAH V 6 data shows no South Pole warming since DEC 1978.
https://www.nature.com/articles/s41612-020-00143-w
91
And the BAS Turner study found that the Antarctic peninsula has been cooling by about -0.5 c decade since 1999.
https://www.newscientist.com/article/2098187-one-part-of-antarctica-has-been-cooling-since-1998-heres-why/
90
Here’s more proof of a much warmer, earlier Holocene and from ABC Catalyst. This was at the end of the Holocene climate OPTIMUM and today sea levels are about 1.5 metres lower than 4 K years ago. You can read the transcript or watch the video. Here’s a quote and the link.
https://www.abc.net.au/catalyst/narrabeen-man/11010512
“Dr Macdonald: The date came back at about 4000 years ago, which was quite spectacular we were very surprised.
Narration: 4000 years ago when Narrabeen Man was wondering around this area the sea levels were up to 1.5 metres higher than they are today.
Paul: So that spit would have been much narrower. The water levels in the Narrabeen lagoon would also have been higher and it would have acted like a saline estuary”.
90
A plot of linear fits to GISS Loti and UAH 6 (offset +0.53) from 1979 to 1997 and 1999 till present.
https://woodfortrees.org/graph/gistemp/from:1979/to:1997/trend/plot/uah6/from:1979/offset:0.53/to:1997/trend/plot/gistemp/from:1999/trend/plot/uah6/from:1999/offset:0.53/trend
The trends before the 1998 El Nino differ by a factor of 10 less than after.
This mostly from GISS not recording as low as anomalies as UAH in cold years while warm years are almost exactly the same – except for 1998 which was almost half a degree cooler at its peak.
Different methods were used but they usual follow each other closely, especially in warmer years. This has to be due to subjective choices in calculating an average temperature from the thermometer record as UAH is much more consistent from month to month.
30
https://woodfortrees.org/graph/gistemp/from:1979/plot/uah6/from:1979/offset:0.53
Sorry,forgot the second plot that shows how most of the deviation in trends after 1999 is due to GISS having a higher estimate for the cooler months while warmer months are mostly in sync.
10
The last century was much hotter than it was 12,900 to 11,600 years ago during the Younger Dryas period.
60
I keep asking warmists the question but can never get an answer:
Even if global warming were true, when has there been a period in human history such as the Minoan, Egyptian, Roman or Medieval Warm periods when natural warming has been a bad thing?
Civilization thrives during periods of natural warming.
Humans and agricultural production love the warmth.
Cold is miserable.
160
At the IPCC Copenhagen Conference (Flop) the delegation from China reported that during 3,600 years of civilisation and record keeping in China there were three warmer periods than present day, each warmer period brought greater prosperity as food crop yields and others increased.
120
Yes David and the data supports our argument.
The first billion Humans could be counted in 1800 and they were poor and sick and life exp under 40 years.
But Africa alone has increased its pop by over 1 billion since 1970 and life exp now 64 + higher calories etc.
And global pop has increased by 4.1 billion since 1970 and life exp is now 73 and much higher calories etc.
But OECD countries now have higher life exp of 80 + years and obesity is a worry now in some wealthy countries.
Farmers and their workers now only make up a tiny percentage of OECD countries work force.
And Urban living is well over 80% and rising in wealthy OECD countries.
101
The precession cycle is slowly taking the peak sunlight northward. Ocean insolation peaked in 1585 when perihelion last occurred before the austral summer solstice. Less sunlight on the oceans means evaporation is slowing down and the oceans are retaining more heat – they are warmer. So global warming is occurring and has been since 1585.
The Northern Land masses have been getting more sunlight since 1585 and are consequently warming up. However northern winters are getting cooler and there is more water in the atmosphere when the land is cooler. That means winter snow will begin to accumulate again. The current cycle of glaciation began in 1585.
No climate model has predicted the decline in global freshwater run-off that has been observed. Models are based on the assumption that surface radiation can heat oceans. It cannot. The ocean surface reaches a maximum of 30C and the surface insolation goes to zilch. Surface that is not at 30C just has higher evaporation and causes cool water to be drawn to the surface. More sunlight on oceans means less heat retained.
https://www.bafg.de/GRDC/EN/03_dtprdcts/31_FWFLX/freshflux_node.html
70
In reply, extract from CNN October, 2021
Climate change is expected to be a major issue in the next federal election to be held early next year. It will be a two-way contest between Labor and the governing Coalition of the Liberals and Nationals.
Climate legislation and the concept of a carbon tax has been the downfall of many Australian leaders. And as Morrison’s Liberal Party lose popularity in polling, the prime minister has done everything in his power to show that his government would not impose any kind of tax on energy use.
In his plan, he emphasizes “tech not taxes,” and without plans to legislate, the net-zero goal remains purely aspirational in Australia and lacks any mechanism of accountability should the target be missed.
Bill Hare, a physicist, climate scientist and CEO of non-profit science and policy institute Climate Analytics, said the plan lacked detail and there was “absolutely no way” it would help Australia reach net zero by 2050.
“It just doesn’t stack up,” he said.
“The so-called technology roadmap has no real detail to it. That’s the largest part of their proposed pathway to 2050. And to the best that we understand it’s essentially relying on carbon capture and storage and other approaches, which have been shown not to work. So at this stage, I think it’s bordering on being a scam, frankly.”
40
Australia as a UN member nation has little choice but to participate, including attending climate conferences, and don’t ignore the pressure applied especially at this point in history by our top two allies, UK and US. They both pressured our PM to commit Australia to net zero emissions by 2050 and to increase the Paris Agreement emissions reduction target and timing which the Agreement shows as 2030.
Australia media generally gives the PM very little positive publicity and focus on negativity, politics above all else.
But the fact is that the present Federal Government that is led by Prime Minister Morrison and his Cabinet of Ministers has not committed to net zero emissions, refused to drop coal mining and use of coal including exporting coal and this was supported by several other UN member nations.
Australia is playing the climate hoax game, steering through the minefield but unfortunately continues to support economic handbrakes like renewable energy, carbon credits, electric vehicles. But these were already in play when the PM was appointed in late 2018.
The Independent candidates backed by the crony capitalist renewables and other climate hoax business ventures are a prime example of the leftists dislike of the Coalition Government because it does not give them the breaks they want. The Morrison Government began the phasing out of subsidies for renewable energy businesses and new applications to State Governments have declined accordingly, many existing renewables businesses will lose the subsidy before their business plan is completed.
20
Dennis. What HAS been shown to work? It’s a false argument. To boot, it also ignores every failure of the renewables systems which actually do fail in every way as they generally cost more in energy and CO2 output than they can ever save in a brief lifespan of activity. Then they totally fail in practice as they cannot guarantee continuous, let alone sufficient output to cover heavy industry, electric vehicles, households and all other requirements.
As Lomborg says, adaptation is the most economic way by far – as always – to confront problems that threaten but may never come to fruition. Economic destruction to fight a postulated ghost is simply ridiculous, or self serving to those that create fear for political gain.
When those that would destroy the Democracies, using fear, based on an acknowledged totally unproven and increasingly failing theory, take to China, India, Russia and Brazil with the same gusto with which they attack and seek to bring down the Democracies, then we all might know the true believers are really TRUE believers. Their highest echelons however, seem to be overindulged, wealthy con artists looking to make their personal next $billion and stuff the peoples of the world who pay those $billions as subsidies for grand plans that would never get off the drawing boards of any major private company governed by rules.
10
I love going to the beach in the Summer.
In my earlier days we would go camp at the beach for a week or so.
And usually it was heatwave time.
But in the past 6 years there have been no heatwaves in South Australia.
We get 2-3 day heat spikes with cool weather after those 2-3 days.
In fact this has just happened this week.
And none of the local global warmists have even noticed !
Too bloody busy listening to the ABC on TV or computer screen
Howling like dogs about the scary future !
Bah !
100
Southern Hemisphere cooling began in 1585. The slow trend is bound to be experienced sooner or later. Northern hemisphere is warming but not as much.
This year, the South Pole December insolation averaged 564W/sq.m. It will be down to 517W/sq.m in 10,000 years time.
The Northern Hemisphere is warming but not as fast as the Southern Hemisphere is cooling. This year the North Pole had 529W/sq.m in June and it will increase to 539W/sq.m in June in 10,000 years.
South Australia will not see changes as dramatic as the South Pole but it too has been getting less sunlight since 1585.
Although ocean surface warm on average with less sunlight, the Antarctic sea ice will be expanding and the ITCZ will be moving further northward so the temperature gradient from tropics to sea ice is moving northward. That is/will make Australia cooler. BoM homogenisation can overwrite any real trend so they produce meaningless cow manure.
On an orbital basis, 2020 was the year of the most sunlight on Earth this century. 2030 will be close and then around 2080 but it is all downhill from there.
80
Very interesting Rick.
But who the hell was measuring ‘insolation’ is 1585 ?
Presumably these are all estimates.
But you’ve no explanation of why these estimates can be relied on.
10
As Bill suggests it seems that you’re relying on estimates and no doubt these have been made possible from a knowledge of orbital mechanics that seems to be above average.
From a very general point of view I can sort of understand the nominal 100,000 to 105,000 year cycles described by Milankovic but you are obviously using other cycles; it would be interesting to get a description of those.
During the last ice age Australia seemed to have much less ice cover than the northern hemisphere, but this may have been because we are closer to the equator than the areas of USA that were deep under the ice.
20
So true, Bill.
Slaving away in a sweltering exam hall in November was the go, too.
Now we only have ‘hot snaps’ if we’re lucky.
30
Yes those are my memories from the 1960’s as well
It only changed exam when I got to uni which had air conditioning !
00
“Naturally all Climate Bingo games are boosted by inexplicable adjustments, badly placed thermometers, shrinking thermometer screens, and the process of constantly rewriting history. If the incinerators near thermometers don’t do it, the homogenization will. They might be Australian tricks, but most Met Bureaus are the same.”
Then there is collecting weather data in hot places. For some reason the BOM decided they needed to collect some (not all) weather data from Noona NSW, so they established an AWS there, with first data available 20 Jul 17. As far as I can tell Noona NSW is a roadside stop on the Barrier Highway about 80 Ks west of Cobar Airport.
82
Same-same here: pre-AGW there were eleven stations used to compile weather/climate data, then bingo! it was reduced to the Seven Station Series (7SS).
Which ones were disappeared? The ones at altitude in the mountains, eg. Chateau Tongariro on Mt Ruapehu, Mount Cook Village in the valley below Mt Cook, Queenstown Airport at 400m a.s.l., and another I can’t remember at the moment.
With the remaining sites practically at sea level and a mere stone’s throw from the ocean (apart from one in the Wairarapa) the ‘average’ temp suddenly jumped and whaddaya know, man-made goober warm inc. had arrived.
70
Apologies Maptram, gave you a green thumb but a red one appeared instead. Carbon made me do it! I’ll go plant a tree…
40
Maptram. Add the use of electronic thermometry placed wherever, without the prior years of equilibration with the other physical methods of measurement and you can prove anything. Just park your hot next door or drive past a few times. This should keep the con going for years and supported by directly collected, unhomogenised data.
10
In response to several comments above, the BoM made all historic temperature records before 1910 non-official.
Such data might exist on the BoM site but it is not official and in any case, we know they delete or alter historic temperature data as has been documented on this site.
Probably the only reason they even show pre-1910 data is to make their blatant data manipulation less obvious. However, anything pre-1910 has no official status, it is only to pretend they haven’t deleted the historical record.
91
When Dr Jennifer Marohasy and colleagues advised the Federal Government about the “errors and omissions” put out by the BoM, submission to the Minister 2014 from memory, Prime Minister Abbott recommended that due diligence by conducted, an independent audit at the BoM. His proposal to Cabinet was narrowly defeated according to reports, and a year later the Turnbull Party was announced with PM Turnbull leading.
130
Didn’t Greg Hunt have a hand in that?
70
I believe he did Annie, but he was on side with the self named “Turnbull Party – Black Hand Faction” of globalist leftists who had undermined Opposition Leader later Prime Minister Abbott from 2009 to 2015.
Of course they opposed investigation into the BoM, would have been embarrassing for climate hoaxers.
80
Hunt was only interested in wrecking the country (at all sorts of fronts) with more industrial wind subsidy farms.
40
And now Hunt is working on culling the population. This week he started on the children.
30
Yes, and we know why they did that. They wanted to remove that troublesome 1890-1905 period which for weather stations with long data records nearly always show to be the warmest on record. Not sure about WA, but that is true for the Australian eastern seaboard.
80
The chart is labelled “Annual global-average surface temperature (C)”
This heading is incorrect. I do not know what the average global surface temperature actually is but it is more than the 1.1C or 0.3C that the axes indicate. The heading of the axes indicate it is an “anomaly”, not the actual temperature.
It would be nice if we could get a consensus on what the actual global surface temperature is. What do the 6 data sets used actually claim the average surface temperature to be. That would then give a basis for proper consideration. I am able to detect a difference of 1C if I am handed two items of the same material that are at different temperature. I like the household temperature to be around 22C. But I have a hard time distinguishing if it is 21 or 23. Below 19C I sense it as a bit cool. Above 24C I sense it as a bit warm. So 1C is not easily detected.
I know for certain that there is no agreement on what the actual surface temperature is right now or averaged throughout 2021. The 6 data bases used all have different baselines. They closely agree on the anomaly but not the actual temperature.
Almost 4% of the ocean surface is covered with sea ice. When determining SST the temperature of the water surface under the ice is measured (or assumed -1.8C). So to determine the average global surface temperature, do the various groups measure the temperature on or under the ice? This is not trivial because the temperature difference across the ice can be 50C. So that difference would alter the global area average by 2C. So all the surface heating suggested in the chart could simply confirm there has been a reduction in area of sea ice.
Not many people know that increased sunlight on global oceans make them cooler. The reasons oceans are getting warmer is due to them getting less sunlight. The downward trend in ocean sunlight has been occurring since 1585 – the reason they are retaining more heat as the reduced rate of evaporation slows upwelling of deep, cold water.
50
So this marine heatwave is caused by cloudy conditions?
https://earth.nullschool.net/#current/ocean/surface/currents/overlay=sea_surface_temp_anomaly/orthographic=-182.41,39.94,265
20
Yes. – but not just the cloud cover reducing evaporation but rainfall driving surface water deeper:
https://earth.nullschool.net/#current/wind/surface/level/overlay=total_cloud_water/orthographic=-206.41,27.71,265/loc=171.297,38.017
30
There are other examples of the same situation across the globe. This is TCW over the South Pacific:
https://earth.nullschool.net/#current/wind/surface/level/overlay=total_cloud_water/orthographic=-171.99,-24.36,265/loc=-120.285,-39.929
This is the temperature anomaly:
https://earth.nullschool.net/#current/ocean/primary/waves/overlay=sea_surface_temp_anomaly/orthographic=-171.99,-24.36,265/loc=-120.285,-39.929
Higher surface temperature leads to moist air convergence to the warmer water. That is where cloud is going to form. Evaporation becomes negative (it rains) and surface water is transported deeper or downwelling taking heat with it. The immediate impact of rain is to cool the surface but the clear sky after rain allows the low density (less salt) surface to warm quickly and the previous higher density warm water has already been carried deeper.
Locally, the ocean surface responds normally to insolation until it reaches around 28C. It then goes into regulation mode and convective instability ensues to limit the temperature to 30C. In warm pools, the temperature can overshoot to 31C but it will average close to a maximum of 30C over an annual cycle. Globally, more insolation just means increased net evaporation because the surface temperature is limited. The increased evaporation draws cool water upward and less heat is retained in the ocean as the whole water column cools being fed from about 2000m deep.
Upwelling in the high evaporation zones like Nino3 has been measured at 7mm/day at 1000m. And much higher rates above 100m. It is physically impossible to transport significant surface heat downward in upwelling zones
30
Clouds are not well modelled so its hard to find a definitive answer.
We know atmospheric blocking leads to less cloud coverage and calm winds. ‘This allows more solar radiation and inhibits mixing and evaporation, causing the build up of heat. Another atmospheric cause is high-pressure systems. These high pressure systems form when Earth’s surface warms, causing atmospheric waves to move over parts of the ocean.
‘The most crucial oceanic cause is the change of currents. Changes of currents can cause warmer water to be swept to different regions. The El Niño event is also known to cause MHWs. An El Niño year is when the Pacific Decadal Oscillation brings warmer temperatures off the west coast of North.’ (StoryMap)
10
Currently looking ominous of Port Hedland:
https://earth.nullschool.net/#current/wind/surface/level/overlay=cape/orthographic=-252.52,-14.75,598/loc=120.204,-19.108
CAPE of 4298J/kg equates to an updraft velocity of 92m/sor 333kph. This is ample fuel to spin up a decent cyclone. However it is a bit close to the coast. It needs to be well over water to create its own low pressure system.
The system north of NZ is developing:
https://earth.nullschool.net/#current/wind/surface/level/overlay=mean_sea_level_pressure/orthographic=-209.89,-28.29,598/loc=175.381,-26.538
30
I have followed a number of climate realists on social media for years now. I number of them have stated that the average global temp is about 14.5°C. I know the figure is contentious but is that about right?
30
That’s what I’ve read. It’s hard to see here, but we’re just above the lowest it gets, with the highest it ever gets being 22degC. Some say 25.
http://klimaatgek.nl/wordpress/wp-content/uploads/temp-co2.jpg
And we should be seeing increasing temperatures. We’re only just coming out of an ice age, after all.
Also, according to Patrick More, and a cursory look at the graph, we’re running ou of CO2.
https://m.youtube.com/watch?v=TjlmFr4FMvI
Even if we could reduce the CO2 or the temperature, it would be utter folly. Fortunately, we can’t.
00
Global warming dogma is now well established as part of the far left’s cultural revolution. In the good old days, before Little Red Book wokeness, it used to be called summer.
100
After reading Michael Crichtons “ State of fear “ novel years ago I noted one of his main points – that it can’t be Global warming if you can show that some areas have in fact either cooled or remained constant. So, taking that advice I laboriously downloaded about 130 years of temp data from my local BOM weather station (s). From that data I could very easily calculate the average daily temp for each year (up to present). That calculation is simply the average of the daily max and mins. Then graphed it etc and fitted trend lines. What did I find? Yes, the average max daily temp over 130 years has in fact slightly increased. But the surprising thing was the average daily min temp slightly decreased , but to more of an extent than the max. So the daily average temp( mean of max and min) essentially flatlines with maybe a hint of a downslope. I have now repeated that for another 6 sites in Victoria and averaged them all for the same result. Apart from some up and downs I can confidently say that in 130 years the trend for temps in Victoria is boringly stable.
130
If the “Zharkova scenario” plays out as predicted over the next few years then expect these timespans to extend waaaayyyy beyond 7 years…:-)
20
“The collective amnesia at Met Bureaus”
Back in 2020 the BoM declared the bush fire season the worst on record which was nonsense as very body knows that 1898 was far worse. So I looked up the BoM records that day. They used an excel spreadsheet, so I sorted by “largest area” and 2020 was on top. I searched for 1898 and it had been deleted it just skipped from 97~99. I checked a few days later after the media had moved on to other things only to find that 1898 had reappeared and was again much worst than 2020 but nobody was checking the data for news stories by then.
30
IIRC the coldest temperature in Australia was recorded at Charlotte’s pass.
I have no idea of how this was done but knowing bureaucrats I can guess that one staggered out of the hut and looked at the thermometer, double checked and scurried back inside and well before midnight. Anyone who knows can correct me here.
Having had family who were frostbitten or nearly died of exposure from the cold, I have learnt to handle such conditions and once XC skied for hours in a blizzard( I didn’t have any choice).
On Barrington Tops in 1990s I took up a good quality mercury thermometer for the hell of it. The snowfall was quite heavy, the snow drifts were compacted and over a metre deep in places and >50cms everywhere. (Most often on the “Tops” it snows at night, turns to rain after dawn and washes the overnight snow away so that by morning there is very little left.)
That night at 10pm, the thermometer read <-22degC and when I spat it was frozen before it hit the snow( I repeated it and checked to see if this was correct). That has to be the coldest noted temperature in this country and yet such should be observable and easily beatable by the Snowy mountains or in Tasmania's South Western ridgelines in winter with the roaring 40s hitting them(yes, been there then).
So I now take such temperature extremes with a grain of salt.
After all, you cannot expect a public servant to risk frostbite just to read a thermometer, can you?
30
So lets get back to the 200+ years of thermometer record of Greenland and check the last two decades against earlier and WARMER decades.
This was the Vinther study 2006 and included alarmists Jones and Briffa and the results are very interesting.
But first we should understand that there was a changeover to a warm AMO in about 1995, see the graph link below.
https://en.wikipedia.org/wiki/Atlantic_multidecadal_oscillation#/media/File:Atlantic_Multidecadal_Oscillation.svg
So here are previous Greenland decadal Annual temps that were warmer than the last 2 decades of the study.
1851-60 -2.1c
1871-80 -1.7c
1921-30 -1.1c
1931-40 -0.8c
1941-50 -0.8c
1951-60 -1.1c
1961-70 -1.0c
1971-80 -1.7c
Now here’s the last 2 decades of the study
and during the WARM phase of the AMO.
1981-90 -2.5c
1991-2000 -2.1c
So now we can see that we had WARMER decades from 1921-30 until 1971-80 inclusive.
And the AMO shows that a lot of those warmer decades occurred during the earlier cool phase of the AMO.
Also 2 decades during the 19th century were warmer than the last 2 decades as well.
Look up Table 8 of the Vinther study and check the Annual decadal temps for yourselves.
https://crudata.uea.ac.uk/cru/data/greenland/vintheretal2006.pdf
50
Gosh, wish we were still in the mini ice age, right ? Imagine how good it would be to be in that section of the graph.
These people are insane, and in control.
40
Subtract El Nino = No Warming.
https://rclutz.com/2022/01/12/uah-confirms-global-warming-gone-end-of-2021/
20
Just a reminder that Willis Eschenbach covered the latest Vinther study of Greenland in 2019 and he called it “Greenland is way cool”.
Good graphs and data for the Holocene and a good fit with the long 2006 Vinther thermometer study that showed warmer decadal trends from 1921 to 1980 and then 2 cooler decades from 1981 to 2000.
So no warming for Antarctica since 1950 ( 2020 Singh et al) and Greenland not so warm and little wonder that SLR is not a big issue in 2022.
Greenland + Antarctica are about 99% of our planet’s ice.
https://wattsupwiththat.com/2019/01/08/greenland-is-way-cool/
10
More new studies show that Antarctica is not warming and the Ant peninsula has been cooling since 1999.
That just supports the latest UK BAS Turner study of the peninsula.
https://wattsupwiththat.com/2021/09/20/body-of-evidence-all-of-antarctica-is-cooling-peninsula-cooling-since-long-before-greta-was-born/
20
The BOM didn’t suffer from collective amnesia, the decision to use 1910 as a starting point was deliberate to ignore the Federation Drought, the worst by far in Australia’s recorded history. The BOM was terrified that 1900 may well have been hotter than 2000, so deliberately excluded it.
40
You have got to love weather.
https://photos.app.goo.gl/75ft6WDJcXjvfrWz5
Notice how temperature in my back yard changes by 5C in 20mins, from 34C to 29C. Despite drop in wind speed too. Coincides with doubling the humi dity.
I’d like to see manmade CO2 do that.
Ps. Hope image link works..it’s my 1st attempt.
20
You might enjoy this
https://m.youtube.com/watch?v=Y2K1uHvfaek
00
That title of the bar graph above is….
“Annual global-average surface temperature (°C)”
That is a lie. Those are temperature anomalies, which are deviations from an arbitrary average of fiddled numbers, designed to give the appearance of being scary, when they aren’t. Richard Lindzen explains.
https://m.youtube.com/watch?v=kwIixU1JyDU
20
I always remember the phrase “there are lies, damn lies and statistics”. With regards to AGW, all of the previous are true. Even our own BOM lies to protect the AGW myth.
20
[…] Link: https://joannenova.com.au/2022/01/magical-seven-year-record-wins-the-hottest-ever-bingo-of-2021/ […]
00
[…] Link: https://joannenova.com.au/2022/01/magical-seven-year-record-wins-the-hottest-ever-bingo-of-2021/ […]
00
[…] Link: https://joannenova.com.au/2022/01/magical-seven-year-record-wins-the-hottest-ever-bingo-of-2021/ […]
00
[…] Link: https://joannenova.com.au/2022/01/magical-seven-year-record-wins-the-hottest-ever-bingo-of-2021/ […]
00