On average, every 3 days, wind farms generating as much as one coal fired unit, fail on the Australian grid
 TonyfromOz exposes a failure rate so common it’s hidden in plain view. Wind “Farm” intermittency is even worse than we thought.
On average, every three days within a one hour period there’s a sudden failure of 500 MW of wind generation — equal to one industrial coal turbine. That’s four full wind farms or about 250 spinning turbines that stopped spinning.
Every time a coal plant trips out, it’s reported as a problem of relying on our “old coal fleet”. But when the same power output fails from wind, it’s the new clean green future at work (!) , and a sign we need to spend another $20 billion to “upgrade the grid” with interconnectors we don’t need, and Hydro schemes we don’t want.
A few wind farms are bad for the grid. More windfarms are worse.
100 times a year we get a 500MW outage
TonyfromOz (Anton Lang) laboriously finds and documents two different kinds of failure. The largest and longest outages are when wind farms are becalmed. But there are many more short sharp and very sudden failures in high wind conditions where wind farms cut out.
The sharpest power cuts are happening in between the high pressure cells. As the wind picks up, production maximizes, only to crash as turbines hit their safety cut off points and drop out of production suddenly. About 50 times a year generation across the entire Australian wind farm grid falls by 500MW or more within one hour or less.
On the other hand, when large cell weather patterns traverse Australia whole windfarm regions are becalmed, and rendered useless within hours. This sort of failure can be as large as 2 to 4 GW of power disappearing in less than nine hours. This is like a whole coal power plant or even two (with 8 different units) producing virtually nothing. It never happens with coal but it happens about twenty times a year with wind power.
Those long term losses are happening with every High Pressure system crossing SA and Victoria from West to East, and they last around one a week . Some pass more quickly than others and some hang around for up to a couple of days.
Building more towers in the same area makes the intermittency worse –not better.
Baseload generation must sit idling ready-to-go to pick up the slack. Or the giant Snowy Hydro scheme must sit in reserve, assuming it has enough water to release. In either case, great capital infrastructure is being used inefficiently as a bandaid for a fickle unreliable and expensive generator. And we wonder why electricity costs have risen inexorably?
_______________________________________________________
Wind Power Generation Intermittency – It’s Worse Than You Think It Is – Part One
By Anton Lang, edited by Jo Nova
Introduction
Intermittency on every scale is a large problem, and constructing more of those wind plants is making the problem worse.
For four years I have been collecting data on wind power generation in Australia. After looking at this data on a daily basis for so long, I could see many variations, but I was not seeing the long term trends of the scale of that intermittency, how big it was, how suddenly generation would fall, how sustained the losses could be, and the quite large sizes of the falls.
Over the last three months, I went back over more than 730 days of data, and collated all the falls for wind generation. Strikingly, there were a lot of sudden falls, and there were a lot of sustained falls. To assess the frequency of the falls I needed to set some parameters. For generation losses I selected 500MW because it is around the average for a single large scale coal fired turbine (or “Unit”). Australia has 16 coal fired power plants, and there are 48 separate Units in toto at all of those plants. The total Nameplate is 23,000MW, so the average size of those Units is 480MW. So, the loss of 500MW of power in a short space of time is equivalent of one of those large scale coal fired Units going off line, something that renewable power supporters tell us is proof somehow that coal fired power is unreliable. Secondly 500MW equates to around four or more wind plants or “farms” of turbines as they are known. The total Nameplate for wind power is currently 7,728MW and there are 64 wind plants, so the average is 120MW and a 500MW fall in power is similar to four wind plants stopping. Those power losses are significant — not just a few towers here and there — a 500MW loss is like 250 to 270 of those individual wind towers stopping.
I divided the sudden losses into five different time frames. I assessed the number of times this happened and also the range of the power losses that occurred. All these separate failures occurred in the last two years and two months or 800 days.
… Time Frame Number of Incidents Range of power losses Short … Power losses in less than one hour (0 – 55 minutes) 53 500MW to 1340MW Power losses in One Hour (56-60 minutes) 54 500MW to 980MW Power losses between one and three hours (65 – 180 mins) 52 630MW to 1570MW Long Power loss between three and eight and a half hours (3 – 8.5 hours) 42 1240MW to 2490MW .. Power loss over sustained long period of time (9 hours or greater) 64 1500MW to 3670MW. (with 10 times over 3000MW)
As each of the time frames increased, I looked for larger power losses which would challenge the system. There were also many smaller sub 500MW incidents over the longer period which I did not include.
Keep in mind here that there were 265 occasions in the last 800 days where the power loss exceeded 500MW.
As often as I look at all this data, something that I did not see earlier has became more obvious — nearly all of those losses in the short time frames were when power generation was already quite high, and again, this is a further reason I have split all of this into those two areas, the three short time frame ones, and the two long time frame ones.
With all the images on this page, if you click on the image, it will open on a new page and at a much larger size, so you can better see the detail.
Wind Generation Sustained Power Loss
The longer and large losses are due to large High Pressure cells sitting over the Eastern states
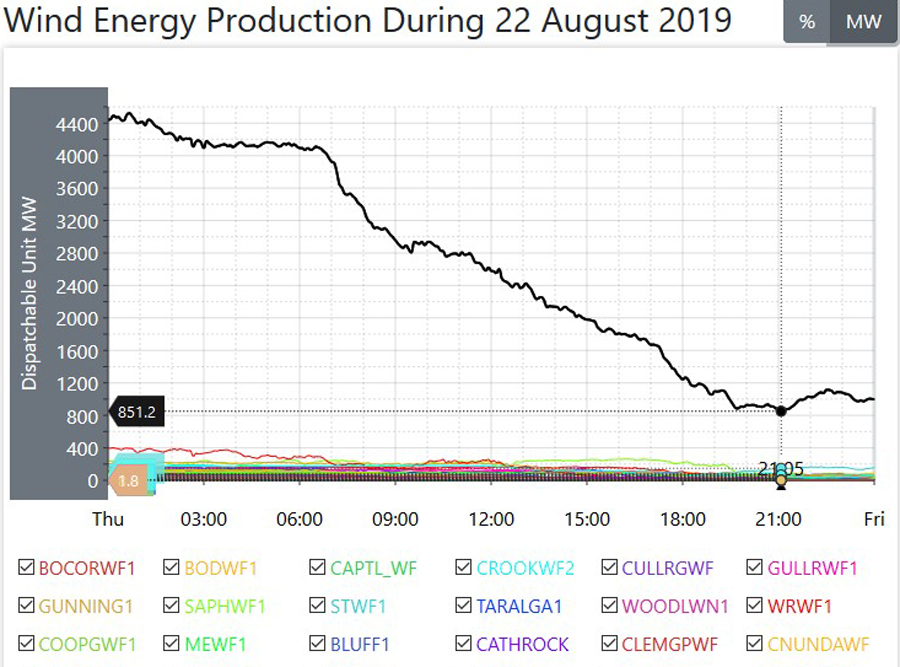
I was already aware that when it comes to those long time frame power losses, it was apparent it was related to the weather. Every time one of those large High pressure weather systems came into an area in the South of the Country, then wind generation would fall away by a large amount. An example of that is shown in the image at the right, and here, you can see that power generation fell away from the high of 4500MW just after Midnight to that indicated low around 850MW, a loss of 3650MW across that time frame of 20 hours. So, what we have here is that the greatest percentage of all the data that I was recording was coming from that same area where those High pressure systems would pass over. This was the South Eastern area of South Australia, and the Central West area of Victoria. Now, that particular area is where the largest number of those wind plants are located. Australia has (now) got a total Nameplate for wind power of 7728MW. However, in that area I have mentioned here there is now a total Nameplate of 4916MW, and that is 64% of ALL the total wind plant Nameplate in the Country, two thirds of it all, just in those two States alone.
The shorter sharp losses are due to high wind cut offs
The short time frame power losses are related to the weather as well. We have been told often enough that these wind towers only operate between specific wind ranges. When the wind gets too high, then the wind towers automatically turn off, and the same happens when the wind is too low, they also turn off automatically.
Short Term Large Power Loss Wind Generation
So, what is happening here for those short time frame power losses is that between the occurrence of those large High pressure weather systems over that area, moving as they do from West to East, the isobars are closer together, and because of that, the wind is high, and so, there is high wind power generation. However if the wind gets too high, then the turbines turn off.
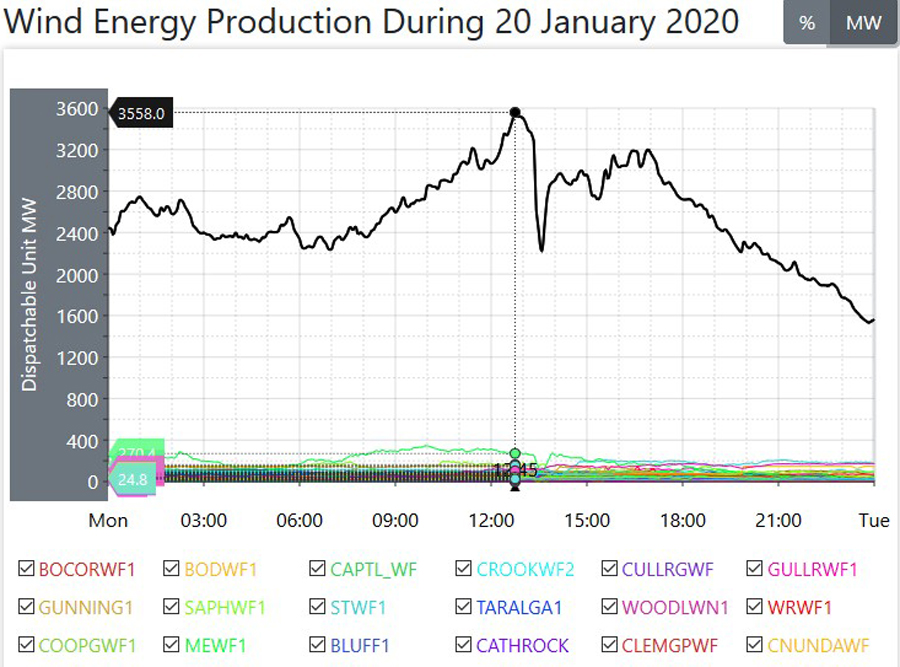
An example of this is shown in the image at right, where power was already relatively high at the indicated high of 3558MW, and it quite suddenly fell 1340MW in 45 minutes. On that same image, you can also see that this happened earlier in the day twice, just after 2AM, and again just before 6AM, where, both times, it fell by more than 400MW, and then fell around 1500MW in a sustained period of more than seven hours.
A 500 MW fall shows that in a short space of time, a large number of towers turn off in high wind situations.
Yet again, the problem we have with the intermittency being supposedly resolved by constructing more of them, has in this case, also been made worse, as now there are more wind towers in that area, as more plants are constructed in that area, and now they are more susceptible to large scale losses in shorter time frames when the wind gets too high.
When this survey started back in May 2018 the total Nameplate for Wind Power was below 5000MW. In the 26 Months since then, the Nameplate for wind power has increased by almost 3000MW. This represents probably around 20 or more new wind plants, a lot of which has been in South Australia and Victoria.
This data I have collected here shows that the intermittency problem is getting worse, as there are more occurrences of power losses, and those losses in power generation are becoming larger.
In the next two Posts I will detail those losses, show you the tables of the scale of those losses, and explain them with respect to using three images for each time frame period across the 800 days of this data gathering task.
*****
Anton Lang uses the screen name of TonyfromOz, and he writes at this site, PA Pundits International on topics related to electrical power generation, from all sources, concentrating mainly on Renewable Power, and how the two most favoured methods of renewable power generation, Wind Power and all versions of Solar Power, fail comprehensively to deliver levels of power required to replace traditional power generation. His Bio is at this link.


This happens every year, especially in Autumn. Autumn weather is usually the best time in Victoria for calm clear conditions. This has been known since long before white settlement in Victoria.
The whole wind power catastrophe was just so predictable. When will it end?
330
And thank you to Anton Lang for doing the hard yards to get the data which exposes the whole scam.
360
Climate is changing, the high pressure is too far south for this time of year.
http://www.bom.gov.au/fwo/IDY65100.pdf
51
Yes it is! More like mid summer position.
So Climate Change is ruining wind power.
120
There appears to be an increase in complex lows, perhaps this is a typical weather pattern as the planet cools.
70
Mid summer night dream?
20
So now you need to tie that movement of the high pressure systems to growth of CO2.
Plot the short, medium and long term trends.
(Force your BoM to do its job!)
00
[Duplicate]
00
One observes that the isobaric patterns have been weak during this winter. That been said there has been a firming in the Tasman Sea in the form of ECL’s. Up here in North NSW there has been no wind to keep the wind farms operating. I drive the Glen Innes, Inverell and Guyra sections regularly over the time the wind arrays have been operating and for the most part they have been inactive. Dud.
90
Approaching La Nina conditions is probably the reason. Unusual rain in July and August in Queensland. Bring it on.
60
Which is why the Wurundjeri Sailing Championships traditionally held in April (on what’s now known as Port Phillip Bay) were moved to October in 1083. The light winds were extra troublesome following the banning of winged keels in 1081.
60
1081, huh?
Sounds like some good long term data available in there, good for figuring out trends there!
😀
(Don’t panic, I recognize the typo …)
20
We need a new acronym
Upper case “DFW” in airline jargon is “Dallas Fort Worth International Airport”
Lower case “dfw” in renewable jargon
“doesn’t f-in’ work”
80
From Peter, Paul and Mary, who were a popular folk song in the 60s, they wrote a song which had the line
“the answer is blowing in the wind”
i think too many enviromentalist have taken this literally.
They should now add a caveat,”sometimes”
80
Suggested adaptation
“The answer is blown in the wind”?
20
Bob Dylan wrote it. Peter Paul and Mary just covered Dylan’s song.
70
We all know the Song!
Dylan wrote it and performed it. P,P and M is probably the best known cover.
I just listened to both. Peter Paul and Mary are much better singers, but somehow I prefer the original version, even with Bob’s nasally voice and poor tonal range.
Bob Dylan Version here:
https://www.bing.com/videos/search?q=the+answer+is+blowin+in+the+wind&view=detail&mid=A94527BC03264C2C5879A94527BC03264C2C5879&FORM=VIRE0&ru=%2fsearch%3fq%3dthe%2banswer%2bis%2bblowin%2bin%2bthe%2bwind%26form%3dANNTH1%26refig%3da625854841fe4ec8b8ea5c574424339b%26sp%3d-1%26ghc%3d1%26pq%3dthe%2banswer%2bis%2bblowin%2bin%2bthe%2bwind%26sc%3d8-32%26qs%3dn%26sk%3d%26cvid%3da625854841fe4ec8b8ea5c574424339b
Peter Paul and Mary here:
https://www.youtube.com/watch?v=Ld6fAO4idaI
50
Maybe, but we now know the answer is blowing in the not-wind.
I prefer the following song 🙂
— because there’s no shortage of children any more, small and large …
00
I stand corrected
20
No worries.
Try this version. Subtle part singing.
https://youtu.be/bI3QVsW30j0
00
Something a little less pc.
https://youtu.be/bp6dsKleGpU
It was being sung sixty years ago but it was written to describe 2020.
00
When I looked at the specs for the wind turbines in use in SA at the time of the system black event the maximum wind speed and design limit for them was 90 km/hour. It sounded like an upper limit for reasons of engineering and physics. Is this correct? And is the upper cut-out wind speed for the latest turbines still 90 kph?
If so, I expect intermittent performance on days where, say winds were at 85kph gusting to 95 kph. And over short periods of time.
Cheers
Dave B
Cooyal
50
The power produced follows a cube law, double the wind speed and octuple the power produced; moreover, the wind variations are sporadic so the management of large ensembles of these machines is concerned principally with avoiding their self destruction.
Some years ago former federal treasurer Costello was asked if his Future Fund invested in renewables and he replied that financially “the returns were too good to ignore”; the quality of the generated power was not a consideration, and that’s why so long as the perverse incentives of the RET persist we’ll see this bizarre subsidy harvesting continue.
The King Island widget showing integrating wind: https://www.hydro.com.au/clean-energy/hybrid-energy-solutions/success-stories/king-island
60
The 2018 report by the Australian Competition and Consumer Commission (ACCC) on “Restoring electricity affordability and Australia’s competitive advantage” makes interesting reading. This is a pointed and timely observation:
Is anybody out there in positions of authority listening?
Thanks Tony.
160
sounds as though they need variable pitch impellers instead of fixed pitch …
10
The actual formula is P=1/2 (rho) AV^3 E
Where P = output power
rho =density of the air
A = swept area of the blades
V = velocity or wind speed
E = efficiency of the machine
They also have to take into account the speed of rotation of the blades because many of them are getting the blade tips into the supersonic region which can do nasty things to them.
100
From a “fact sheet” about a wind facility near me in Washington State, USA
https://www.pse.com/pages/facilities/wild-horse
Its turbines can produce electricity at wind speeds as low as 9 mph. They reach their peak of production at 31 mph and shut down at constant wind speeds above 56 mph.
56 mph = about 25 m/s or 90.1 k/h
50
Ummm… why the cartoon of the late Rajendra Pachauri (1920-2020)?
00
Born: Rajendra Kumar Pachauri, August 20, 1940
Died: February 13, 2020
FYI
10
I think it is taking off Moses and the Ten Commandments.
30
Thanks Tony,
It’s good to get this sort of detail because it helps to emphasise the absolute need for constant backup from regular sources in case of these “dropouts”.
The double cost of having constant backup available is not something that renewables aficionados want made public, but it needs pushing.
KK
170
People wont care until they experience prolonged blackouts. This is the only thing that will wake them from their indifference.
130
Slightly off topic, but still topical;
In view of the Victorian Lemming stupidity regarding lockdown, from the New England Journal of Medicine,
“We know that wearing a mask outside of health care facilities offers little to no protection from infection…” and “… the chance of catching covid19 from a passing interaction on a public space is minimal.”
51
Rick
Meet
“ultracrepidarian”
https://www.dictionary.com/browse/ultracrepidarian
13
Thank you Tony for exposing the truth behind these unreliable eyesores.
100
Thanks Tony
Very incisive and revealing. Indicates the dilemma we have created through privatisation and greenification of our once reliable industry that produced some of the world’s cheapest electricity.
Do we know of any country that manages to use wind power extensively without relying on fossil back-up. No. So why are we pursuing wind. Why are we subsidising a second rate technology?
40
Wind farms suck.
100
They really do when using power from the grid to turn them and stop deformation of the bearings and drive shaft.
70
Wind farms smash up our Australian bird life in a most brutal fashion. How anyone supporting the use of wind to provide electricity can claim to be acting for the good of the environment is beyond my comprehension.
130
Excellent Article Anton Lang!
Wind energy was never a stable energy.
It should have been used to help generate a more stable source such as hydro power by pumping water into reservoirs. Instead of trying to harness the wind at a defined windsheer speed. Too little doesn’t work and too much doesn’t work.
But, our governments don’t listen and go ahead with this failed experiment.
50
The Queens Estates are getting richer from these wind farms.
https://www.google.com/url?sa=t&source=web&rct=j&url=http://www.bnnbloomberg.ca/wind-power-drives-record-437-million-income-for-queen-s-property-company-1.1277903&ved=2ahUKEwjUlIHfxIbrAhVooHIEHfnxAJwQFjAQegQIBxAB&usg=AOvVaw1O7eu7_Mcdij2vqtZqx0jk
30
Maybe I should be pleased about that, because, in a roundabout way, some of that money comes to me.
Most of it goes into the national exchequer to pay for essential services :
-“The company (Crown Estates ) oversees real estate surrendered by the monarchy in 1760 in exchange for annual payments. The U.K. Treasury collects its earnings and provides Queen Elizabeth with a percentage.”-
00
Nice work TA.
When it comes to wind power, I often wonder what it is we are trying to achieve. We know that the big emitting countries such as China and India can’t use this low density energy to power their economies and mainly choose coal or gas. Also, the amount of cost and time needed to deploy wind energy is completely prohibitive as we have found. To deploy the average output of one Hazelwood has taken 15 years and cost $30 billion dollars and it still can’t be used as one Hazelwood due to it’s intermittency as it needs 100% backup. For developing countries requiring high volume dispatchable energy that can be rapidly deployed, the very last choice is RE.
Perhaps the one thing we have achieved is to show the developing countries what NOT to do, which would explain why companies such as Adani are so keen to create huge new coal mines down here, so as to provide real power to their developing worlds, instead of languishing whilst waiting for the sun to rise or wind to blow.
90
Sometimes, because there is a lot to take in here, (hence the three separate Posts) some of the text might tend to get missed or overlooked, so there is a pretty big point to see here.
Note that I set that 500MW parameter for the short sharp power losses, because when I started out collating the data, I really didn’t think there would be that many of those losses in (and above) that range, and so the original setting was 200MW. However, after barely looking at two Months of daily graphs, I was getting so many that I quickly realised that using that 200MW loss, then I would (quite literally) end up with many hundreds, so I set the base at 500MW, and that culled what I had to a much smaller total. (which also then snowballed, so I had to further break it down into three separate time frames)
So, now, that figure of 500MW power loss, and what might be overlooked here.
While some of the larger and more recent wind
farmsplants (please don’t call them farms) have relatively large Nameplate, that’s because they utilise the newer turbines on top of those huge poles, and those newer turbines are in the main all of them larger than 3MW, and up to 3.7MW, and getting larger.However, the earlier wind plants, well, all of them have smaller turbines in the range between 1.2MW and 1.7MW.
Hence the average turbine size is now just a tad lower than 2MW, and as each new wind plant comes on line, that average rises a little.
So, now can you see the point here that might have been glossed over?
That 500MW short and sharp loss of power due to high wind speed means that (around) 260 of those individual wind towers go off line, and it’s in a relatively concentrated area, so that’s around four to five of those wind plants dropping off line.
That’s for the short sharp losses of power.
Now look at that long sustained loss of power as the wind drops to almost nothing right under the centre of those large High Pressure weather systems.
Note the one I have used here as an example, (where the loss spread over those 20 hours) where 3650MW was lost. That’s around 1920 individual towers stopping. That’s about 16 or so wind plants stopped. On this occasion, that’s a loss of 82% of all the wind power on line across those 20 hours.
That’s the equivalent of Loy Yang A and Loy Yang B and one unit of Yallourn W going off line in Victoria, and that’s seven of Victoria’s ten coal fired Units. That has NEVER happened and never will happen, EVER. Victoria would go Black, and probably South Australia as well if that happened.
And yet it has happened with wind power on ten occasions in the last two years, and no one has batted an eyelid, and in fact, no one has even noticed, and what do think might happen if those coal fired Units failed in a similar matter? There would be screaming from the rafters.
See the overall point here?
Wind power can get away with all this, and no one will say a thing about it, and do you know why?
Nobody knows about it.
Tony.
300
Tony,
Yet AEMO reported on 30 July 2020 that the distribution of renewable sources for NEM ensures that steady supply is obtained because it all balances out.
See in particular their reference 3 to Blakers 2019 from the Australian Conservation Foundation who makes this balance out assertion in his abstract.
There is so much conflict between what you are reporting from observation and what AEMO are reporting from modelling that both cannot be right.
This topic of intermittency is so vital to Australian energy future that it has to be publicised and the true answer accepted and acted on.
Thank you for your observations. Looking forward to parts 2 and 3. Geoff S
130
Worth reading National Poverty Guarantee 2017-2018 …
https://web.archive.org/web/20180805061319/http://stopturnbull.com/national-poverty-guarantee-2017-2018/
00
What we are suffering from and paying for is;
Political Electricity.
To recover, yes we are almost down and out, we must have;
Engineered Electricity.
KK
40
Same old story: as soon as we rely on the weather to be useful, it isn’t.
Great article Tony, I’m looking forward to your following parts.
20
Great work Tony.
I would like to know if the constant ramping up and down in power output of coal generators as wind and solar plant constantly go online and offline causes them to wear out prematurely.
122
If you look at the charts, you will see that black coal just ramps up and down for the daily peaks, its was doing this even before and wind and solar existed..
Brown coal just remains steady and churning it out at an almost constant rate.
It is the gas power stations that carry most of the load of countering the erratic supply from the intermittents.
100
and => any
10
Would have been nice if the details included contracted power, which in the real world, and according to AEMO covers the longer ones.
Would have been nice if the details included comparison to other states like WA or to other countries like the USA where this effect is not seen.
Would have been nice if the details included the activity on the spot market, where you would see that coal is underbidding on the short periods.
Would have been nice if the details included the response of wind and coal to changing load.
As Andy says “excerpt the facts”
119
It shouldn’t take you long to do the wind pattern comparison to the rest of the world and present them here – wouldn’t it be nice if you presented data to back up your thoughts. The data is available.
131
Then why wasn’t it done?
013
Then why don’t you do a presentation similar to Tony’s to back up your concerns? Bloggers here respond to data and would welcome your input to allay our concerns about variable renewable energy (VER) in the Australian context. So far, the actual VER impacts here are a worry.
150
Rowjay, how would he ever understand the rotational inertia in the huge coal fired systems and what it was there for?
He has nothing to express except vague virtue signalling ” beliefs “.
Electrical Engineering 2020; the fantasy continues and we pay through the nose for it.
KK
40
I’m providing a critique of the post.
Tony and most here on this site:
Start with a concussion, excerpt all facts which do not supported that conclusion, and the ‘prove’ the correctness in an ideological sense of their position.
My argument is that any argument which does not consider dissenting facts is just propaganda
That is what Tony promotes
03
“I’m providing a critique of the post.”
No you are not, you are making a pitiful attempt at distraction from the facts posted in front of you.
“Start with a concussion”
Is that what happened to you.. at a young age.. many times !!
On of those kids that always lands on its head !
You have NEVER been able to argue a case with any actual data or facts of any kind.
You remain basically EMPTY of any data or facts..
Neither have you been able to comprehend or argue against data that is put forward by others.
“My argument is that any argument which does not consider dissenting facts is just propaganda”
So you agree that “climate change™” and your manic “belief” in it, is based purely on propaganda..
Yippee.. you finally got there. !
50
“which does not consider dissenting facts”
We are waiting….. so far all you have is.. NADA.. zip.. EMPTY.. an abyss !
10
Think of the Koalas.
30
Peter you’ve been trying to find fault with Tony’s work for a long time but the trouble is Tony is just reporting the facts and figures from AEMO and dissecting it down .
He has a lifetime of experience in the trade and you have a Green ideology and 10 years “Distribution” experience.
80
Possibly because you weren’t there to help him with it.
Make a name for yourself by being useful … if you can.
00
Just on your last point here Peter Fitzroy:
Look at the Load Curve for yesterday 6Aug2020, and that is at this link.
The black line at the top shows overall total power generation, and that is the same as overall total power consumption.
The coloured sections below that show the two coal fired power totals here in Australia, the dark grey is back coal total of NSW and Qld, and the browny colour is the brown coal for Victoria.
Now, not how closely, how very very closely, they follow the black line of total power generation, indicating that (totally contrary to what everyone is led to believe) coal fired power follows the changing load. That change in coal fired goes from a minimum of 14900MW at 4AM up to 18600 at the first morning peak, and than falls away a little to 15400MW in the mid afternoon. It then rises to the evening peak at around 6.30, when coal fired power is at 19000MW, and it then falls away again.
Now, this is not a fluke that just luckily happened on this day, because since the DAWN of power generation, coal fired power has done EXACTLY this on a daily basis, day in day out, every day, Summer Winter, all year round, ramping up and down by 4000MW to 5000MW, ….. FOLLOWING THE LOAD. That’s between 60% and 70% on a daily basis, and up to 80% on weekned days.
Now compare that to the same day for ALL the wind power in that same vast coverage area, (shown in the image at this link) and be assured, this shows a day when wind power was right on its year round average of 28.5% Capacity Factor.
Same black line for total power generation. That green colour you see rolling along the bottom of the graph, wll that’s wind power, and note how it bears absolutely, positively no relationship whatsoever to following the load, well pretty much expected when wind can only deliver 8% of all generated power.
As to all your other requests, well fell free to do those things yourself, as for the purposes of this exercise they don’t need to be done, and frankly, have absolutely nothing to do with what the Post is about, and for someone so red hot recently on staying on topic, you sure took the first chance to go off topic here.
Oh and by the way, if you do start the exercise for the U.S. or even WA, you’ll be the first person on Earth to do that. It took me four years of collating the data, three Months of checking it for this Series of Posts, and a couple of weeks to get the text right, so Peter Fitzroy, if you want that done, then knock yourself out. And just quietly, if you do that exercise, I’ll be expecting an apology as you’ll find that this effect is repeated everywhere.
Tony.
150
Look! Ee’s scampered.
40
Look! Ee’s scarpered
20
Yes I understand that point.
What was the contracted power for those periods?
With 10 years experience in the distribution industry I seem to have insights which escape you
07
10 years lavatory work, hey…
Stop pretending.
You have NO DATA, and you can’t comprehend the data that is put in front of you.
You have only your little fantasies which you have NEVER been able to back with anything.
You have proven your basic lack of insight into basically any form of reality.
You make stuff up, because it all you can do.
Wind cannot possibly sign a contract for regular supply.
Contracts mean nothing if the supplier cannot supply, and their whole existence is based on government subsidies and mandates.
60
Dwell I do interact with turds like you
18
“You have NO DATA, and you can’t comprehend the data that is put in front of you.”
You make stuff up, because it all you can do.
QED. !
50
petel STILL doesn’t seem to comprehend that wind electricity only exists when the wind is blowing.
It CANNOT follow loads.
It CANNOT increase when the load increases.
60
Were you a paper boy for ten years Peter ? It seems like your suggesting that the windmills didn’t have to produce power so shutdown and that is just plain ridiculous because they don’t know from one day to the next if it’s going to be windy enough to work .
70
petter thinks they signed contracts to deliver drops of 500MW to 3600MW over irregular periods at erratic intervals.
So funny ! 🙂
50
Certainly sounds like that’s his mistaken belief .
50
“thinks they signed contracts to deliver drops of 500MW to 3600MW over irregular periods at erratic intervals.”
Wait up. What if some foreign enemy was willing to pay for that?
30
Re Peter F’s point at #18 about contracted power.
Let’s say my demand averages 10 MW per hour, but varies from 7 MW per hour to 15 MW per hour.
I can sign up to take 7,200 MWhr per month from some windmills.
That’s an average output of 10 MW from 10 windmills, each 3 MW nameplate and 33% capacity factor, to exactly meet my average demand.
However my windy supplier randomly varies delivery from zero to 20 MW per hour.
What am I to do?
At times of high wind I will have to sell my surplus power (could be 5-13 MW per hour) to another consumer, or idle some windmills, and at other times when the wind doesn’t blow, I will have to buy anywhere between 7 and 15 MW per hour from another supplier on the spot market, or curtail my usage.
Therefore to meet my demand, the generator market must consist of my contracted 10 MW windfarm (nameplate 30 MW), plus 15 MW of reliable generators (say nameplate capacity 18 MW) to meet my peak demand.
Note that if the windmills were shutdown entirely, there must still be capacity available to meet my peak demand.
Conclusion: windmills are essentially redundant, simply reducing the average utilisation of regular generators.
Note that this is exactly the situation of the ACT Government, that declares that it is supplied 100% by “renewables”.
50
“As Andy says “excerpt the facts””
Of which YOU have NONE.. as always !!
You live a FACT-FREE existence, where actually facts are meaningless to you.
40
“or to other countries”
I have some German wind data from 2015, 2016
While it hasn’t be analysed to find the huge swings, it does show the following:
.. for about 75% of the time, the output is less than about 26% of nameplate
.. for about 50% of the time, the output is less than about 16% of nameplate
.. for about 25% of the time, the output is less than about 9% of nameplate.
Really quite pathetic when you consider that an old coal fired power station like Loy Yang can provide close to 100% of its nameplate basically whenever called on to do so.
https://i.postimg.cc/K8ZBtqK7/German-Windpower.png
50
Tony
The “unreliability factor” was known and catered for back in the day when windmills were the common water pump.
Either there was an extra-large tank or provision to pump with a pump jack and engine.
Also rule of thumb seems to be that if you want water there will be no wind. If you want to work on the mill head there will be.
80
“Also rule of thumb seems to be that if you want water there will be no wind. If you want to work on the mill head there will be.”
That sums up one of the biggest problems that Tony’s great post here is showing. Murphy’s law has been placed in charge of our power grid. When will the big fails happen?
50
Interesting article at Woods Hole Oceanic Institute:
[https://www.whoi.edu/press-room/news-release/florida-current-weakening]
It tells us the “Florida Current is Weaker Now Than at Any Point in the Past Century” Interesting.
The Florida Current is also known as “the Gulf Stream” — that river of sunwarmed water from out of the Caribbean, that warm water which gives Ireland, the UK and Norway their warm summers and bearable winters. Can we extend your Rule of Thumb, Siliggy, to add “When you expect/want/need warmth, you freeze.”
How much warming will they lose?
At what rate will they lose it?
How will the North Atlantic climate change? It’s going to be interesting …
– will the Beeb et al get far fewer or even no “heat waves” to rabbit on about (unless they change the definitions of those phenomena)?
In about four or five months we may start finding out … snow turning to ice will not be nice. Children who become used to ice may forget the joys of snow.
10
Tony, I look forward to Parts 2 and 3.
How should the real cost of windmills be calculated?
Take as an example the Hornsdale wind farm in SA, nameplate capacity 315 MW (99 windmills), average output 100 MW, variable output 0-200 MW.
To guarantee a reliable power supply, it should be required to store the excess of 100 MW and then deliver that stored energy when output is near zero.
Having a backup gas or diesel generator could be part of the solution, but that doesn’t address what to do with the surplus.
Pumped hydro would be one solution, but there is not much available by way of water storage in that area.
But wait, the big battery. At Hornsdale they built the “world’s biggest” battery, courtesy of Elon Musk, 129 MWhr, capable of delivering up to 100 MW (for 77 minutes) at a reported cost of $90 million. The battery generally outputs a maximum of 30 MW, and is primarily used for grid-scale inertia services and Frequency Control Ancillary Services (FCAS). Approval has been received to increase the battery farm by 50% at a cost of $71 million, funded by an $8 million Australian Renewable Energy Agency (ARENA) grant, $15 million in state funding, and $50 million in project financing from the Clean Energy Finance Corporation. Your taxes at work (not) again.
That represents an additional $160 million cost to make the windfarm somewhat more reliable, but based on your data that is still not enough.
The original cost of the windfarm has been reported to be $870 million.
Thanks to the Renewable Energy Target and Clean Energy Certificates, income for the farm comes from the wholesale price that was over $100/MWhr in 2018-19 dropping to $67 in 2019-20, plus the sale of CECs at about $40/MWhr.
Based on an average output of 100 MW, that’s 876,000 MWhr per year, times $107/MWhr equals $94 million/year. But nearly 40% of that income is thanks to Government subsidy though the CECs that is paid by electricity consumers.
Hardly a logical way to run an essential service.
140
No problems Robber – according to this article:
It would be good to know where these 0.1% best sites are – just don’t tell the Shut-the-gaters.
130
The Kidstone project way up 280km NW of Townsville would be one of them
https://www.genexpower.com.au/project-details.html
20
Oops !.. i meant to add..
250MW peak power
2000 MWh capacity ( 8 hrs at peak power)
$330 mil for the Hydro
$130 m for connector to grid
$??? For solar to power it
50
Yep, odd that hey don’t say what will power the pumping.
Coal probably 😉
30
Actually, in one of the project briefs, they do admit that the “pumping” would be powered by the Grid. (Mostly coal ?) but the intention of the project is to provide “Peaking” power and “Firming” for the RE generators..
ANU suggest that 0.1% of the 22,000 potential sites could provide the 450GWh needed for a 100% RE grid generation.
That implies just 22 projects, each one with 20 .0 GWh capacity.
BUT.. Most of the actual projects proposed so far are limited to 2.0 GWh @ 250MW peak output ?
So, you would only get 44GWH @ 5500 MW peak power ??
May have to think bigger, ?….or build a lot more pump projects ..220 maybe !
50
That will of course push the price of electricity up during those periods they want to use it for pumping water uphill.
Coal companies will love it. 🙂
30
Kidstone 270MW solar farm was $420 million…
20
Odd that when someone suggests building a new dam for actual water supply, the greenies fight it screeching and squawking all the way. !
50
Don’t forget what ruineconomy named “spinning machines” now being added at extra expense to “firming” to stabilise the grid the way power station generators stabilise electricity grids.
50
Re Hornsdale battery:
If batteries are getting cheaper why does a 50% increase in capacity cost 79% of the original cost**? Does that mean the original battery actually cost $142 million?
**when was that announced?
20
What a great business venture basis, government supported and protected “renewable” wind and solar business, taxpayer subsidies delivering energy, or not delivering energy when needed, or not delivering, amounting to around $500K per year per unit, maximum 25-year business plan and writing off assets and expenses incurred against taxable income, electrical energy pricing pushed up to one of the world’s highest.
No doubt the Electric Vehicle transition will prove to be lucrative for investors and cost consumers and the economy a huge price too.
40
“”So Climate Change is ruining wind power””
This backs up my feeling from reading all the IPCC reports – even the most recent ones – the physical basis. Clouds and wind are not well understood, or amenable to modelling. Did some research on clouds and wind and came up with the feeling that its far, far more variable than can be explained by the energy patterns. If it best explained by probability modelling, it means that it’s future patterns can’t ever be known, except as a probability. When those patterns move in a way that messes up human arrogance- such as reducing wind power that kills God’s heavenly birds and such as sudden cold snaps when people are speaking of “Global warming”, it looks like probability is ‘loaded’ dice. So there I am thinking it’s God. Prove me wrong. The thing is how can the ancient Hebrews have known? It’s not a lucky guess. “He causes the vapours to ascend from the ends of the earth; he makes lightnings for the rain; he brings the wind out of his treasuries (compressions- as in storing things by compacting them).”(Psalm 135:7)
40
A question for those with a technical background in these wind turbines…
i can understand why they have to shut down when the wind drops below a minimum level. BUT..
why do they shut down in high wind speeds ?
i know they have sophisticated fine “pitch” control of the blades to keep the turbine speed optimised to a fairly constant (15 rpm ??) in varying wind speeds, and i assume they use that to “feather” the blades ( to 0 rpm)
so why can they not control the blade pitch in high wind speeds to a minimum that maintains the optimum rotor speed, rather than just stopping completely.
Are not stationary blades just as vunerable as rotating blades ?
Does any one know ?
20
Chad
Around your questions. IIRC they have to keep the blades turning or there are even more gearbox/bearing problems.
So at very low wind speeds they are net consumers of electricity.
40
The answer likely involves forces transmitted to the tower. A windmilling propeller blade causes more drag than a stopped feathered blade.
30
The problem is that at high wind speeds the force on the tower is excessive. If you look on the internet (not Google) you can find images of towers that have buckled (or in a few cases been pushed over). The best I can offer is the advice when Call me Dave (Cameron) installed a (small) wind turbine on his house, an engineer noted that it wouldn’t give enough electricity to pay for itself (it didn’t) and if you did install one that would do so (i.e. larger) in strong winds it would rip the end gable right of the house.
The other problem is that how do you half brake? Either the brake is on or off. Trying to slow the blades so they only turn slowly would generate a lot of frictional heat, and they have more than enough fires in turbines anyway.
Your comment about ‘fine’ control isn’t quite correct. They try to generate as much as they can while the wind blows. There is some change in the blade angles but only to stop the blades rotating too quickly. However this idea has been in use in the Falkland Islands for some years. There it is the power station that has control and they deliberately run the turbines at less than the most efficient speed, so as the wind dies down they can switch the blade angles and get a bit more output, and vice versa. That gives them time to start (or stop) diesel backup.
The aim is to get a more constant supply from the turbines, and reduce the cost of (imported) diesel, which they thav reduced by 30% the last time I heard. The power station itself has 8 diesels of varying sizes and they start and stop them as required. Fortunately the Falklands are known for the wind blowing a lot of the time, so it is one of the few success stories of wind energy.
40
From a teh site…
30
Chad,
Good question.
Let me know if you get a comprehensive answer! Geoff S
10
We have the same problem in the UK.
Over the past few months wind has been providing between 10 GW and next to zero electricity, and solar between 8 and 4 GW at midday/
http://www.gridwatch.templar.co.uk/
How many batteries do we need to provide a secure supply of electricity
At present demand is 24.4 GW, but in the winter it can be double that.
Winter peak wind can be 10 GW, but solar is zero.
00
Stephen, ..nice data dashboard , !
I am amazed that UK power demand is so similat to Australia’s..peaking around 30 GW.
Considering the difference in population and industrial base.
00
Peter Fitzroy at comment #18.
Nice try.
You might like to indicate, clearly, how any of the matters that you raise as #18 have any direct bearing on the central issues raised in Anton Lang’s paper.
Perusing these comments of yours:
1. If wind was not intermittent, there would be no need for the AEMO to “cover” as you call it, “the longer ones”. So, are you here suggesting that all is ok because the AEMO contracts a band-aid solution?
And if such is indeed the case, provide detailed evidence to support the assertion. Caution: in so doing, you might unearth facts that show up wind energy’s deficiencies.
Remember, wind and solar were supposed to replace coal-fired plant. Why then, the need for “cover”?
2. “… where this effect is not seen.” Have you been hiding under a rock? If, for example, you had acted on the suggestion that I made to you some 3 weeks ago, and perused, even briefly, the recent papers by Professor Michael Kelly of the UK, you might have been rather more circumspect in coming up with this very obvious howler. Prof Kelly – for one – goes into great detail about the impacts of wind’s intermittency on a number of national grids. Oh dear – I have to laugh out loud at this one. A really nice try. Oh, and note the comment by “StephenP” at comment #24 as regards seeing exactly the same issues in the UK.
3. What is the relevance of any alleged underbidding by fully schedulable generation, given that, being intermittent, wind generation cannot ever guarantee supply? Also, provide full, detailed proof of the basis of this assertion. In so doing, no cherry-picking please: you have to show that the alleged behaviour is a systematic, long-term strategy.
4. You will find the detail of exactly that information in many of Anton’s daily analysis reports, that can be found at the link given at the end of the article. Or, haven’t you bothered to look?
What I really enjoy, Peter Fitzroy, is that you seem to think that it is perfectly ok for you to allow others to do all the work, so that you might then come along and cast stones.
So, here is your task. You have 2 weeks to provide a detailed, comprehensive report, covering the four, unsubstantiated, assertions at #18. Included in that report, you shall provide a detailed rebuttal, again fully substantiated with the relevant (note – relevant) data and analysis, of this report of Anton Lang’s.
By my reckoning, your deadline is the afternoon of Thursday, 20 August 2020.
BTW, Anton, yours is absolutely splendid work.
Well done Anton, Jo.
Regards,
Paul Miskelly
60
My electric utility has two 600 MW coal power plants four 100 MW NG (converted from pulverized coal) power plants and six wind farms providing 600 MW, nameplate power. They shutdown a 600 MW Nuclear power plant ten years ago and replaced it with the six wind farms in their efforts to reduce CO2 emissions. Yes, a brainless action but they sold it on “Saving Money.” Starting 6 years ago, each year as they added more Wind power my electric bill went up 5%. The thing I noticed that bothers me more than the price going up is the significantly more frequent power outages. At least every other week, on average, there is a momentary loss of power. These last any where from seconds (lights flicker, but not long enough for the TV to go black) to a minute or so. These can even two or three times in succession. At least once a month there will be an outage of well over five minutes, but less than 15 or so. When the nuclear power plant was on line and we had no Wind Turbines. it was extremely rare to have an outage. I can even remember going over a year with no outages, several times.
The big problem with these outages is the problems that they cause on my appliances. First thing to go was a big flat screen TV. Luckily it was under warranty, however it went again about a year later, after my repair policy expired. both times during one of these rapid fluctuations in power, $1,500. Next was my Air conditioner, only two years old and all they replaced was the Starting Capacitor $250. A few months later my Chest Freezer, $350. About a year later The Flat screen TV again. Luckily under warranty and I took their offer of buying a repair policy. Then the Microwave, Power “flash” outage while cooking. Al of these failures over five years and all happened from these “mini” outages. Air conditioners and refrigerators do not like momentary outages. It Ruins them.
The worst problem is that at least half of the things I have hooked up “Wirelessly” to my router need to be reset. That means shutting down the Cable Modem, router, computer, printer, Weather station, microwave, security camera, etc., etc. And then turning them on. Then of course all of the devices that display time need looked at and reset, else you have the flashing 00:00.
It think that my problems are worse than average because I live on the North side of town, the Nuclear power plant was on the north side of town and all of the Wind farms are much further north that that and run through the SubStation the NPP used. But I can Guarantee you that as you get more wind power and above 30% 0f your power is from Wind, as mine is now, you are going to have serious problems.
100
It sounds to me that you need a couple of good Uninterruptible Power supplies for your computer equipment except the printer. I have 7 computers, 4 NAS boxes, the ADSL modem and a managed network switch and a big wireless access point running off 3 large UPS units.
I do agree with you that anything over 20 to 25% of unreliables feeding into the grid you will have problems similar to what you describe.
20
The S.A. battery is credited by the fanatical greens with saving X dollars by eliminating a small number of these sudden changes. Can their own math method be used in reverse to calculate the obviously far greater cost of winds erratic failures?
60
Forget it, greens can’t add up and anyway the truth is what they say it is.
30