On average, every 3 days, wind farms generating as much as one coal fired unit, fail on the Australian grid
 TonyfromOz exposes a failure rate so common it’s hidden in plain view. Wind “Farm” intermittency is even worse than we thought.
On average, every three days within a one hour period there’s a sudden failure of 500 MW of wind generation — equal to one industrial coal turbine. That’s four full wind farms or about 250 spinning turbines that stopped spinning.
Every time a coal plant trips out, it’s reported as a problem of relying on our “old coal fleet”. But when the same power output fails from wind, it’s the new clean green future at work (!) , and a sign we need to spend another $20 billion to “upgrade the grid” with interconnectors we don’t need, and Hydro schemes we don’t want.
A few wind farms are bad for the grid. More windfarms are worse.
100 times a year we get a 500MW outage
TonyfromOz (Anton Lang) laboriously finds and documents two different kinds of failure. The largest and longest outages are when wind farms are becalmed. But there are many more short sharp and very sudden failures in high wind conditions where wind farms cut out.
The sharpest power cuts are happening in between the high pressure cells. As the wind picks up, production maximizes, only to crash as turbines hit their safety cut off points and drop out of production suddenly. About 50 times a year generation across the entire Australian wind farm grid falls by 500MW or more within one hour or less.
On the other hand, when large cell weather patterns traverse Australia whole windfarm regions are becalmed, and rendered useless within hours. This sort of failure can be as large as 2 to 4 GW of power disappearing in less than nine hours. This is like a whole coal power plant or even two (with 8 different units) producing virtually nothing. It never happens with coal but it happens about twenty times a year with wind power.
Those long term losses are happening with every High Pressure system crossing SA and Victoria from West to East, and they last around one a week . Some pass more quickly than others and some hang around for up to a couple of days.
Building more towers in the same area makes the intermittency worse –not better.
Baseload generation must sit idling ready-to-go to pick up the slack. Or the giant Snowy Hydro scheme must sit in reserve, assuming it has enough water to release. In either case, great capital infrastructure is being used inefficiently as a bandaid for a fickle unreliable and expensive generator. And we wonder why electricity costs have risen inexorably?
_______________________________________________________
Wind Power Generation Intermittency – It’s Worse Than You Think It Is – Part One
By Anton Lang, edited by Jo Nova
Introduction
Intermittency on every scale is a large problem, and constructing more of those wind plants is making the problem worse.
For four years I have been collecting data on wind power generation in Australia. After looking at this data on a daily basis for so long, I could see many variations, but I was not seeing the long term trends of the scale of that intermittency, how big it was, how suddenly generation would fall, how sustained the losses could be, and the quite large sizes of the falls.
Over the last three months, I went back over more than 730 days of data, and collated all the falls for wind generation. Strikingly, there were a lot of sudden falls, and there were a lot of sustained falls. To assess the frequency of the falls I needed to set some parameters. For generation losses I selected 500MW because it is around the average for a single large scale coal fired turbine (or “Unit”). Australia has 16 coal fired power plants, and there are 48 separate Units in toto at all of those plants. The total Nameplate is 23,000MW, so the average size of those Units is 480MW. So, the loss of 500MW of power in a short space of time is equivalent of one of those large scale coal fired Units going off line, something that renewable power supporters tell us is proof somehow that coal fired power is unreliable. Secondly 500MW equates to around four or more wind plants or “farms” of turbines as they are known. The total Nameplate for wind power is currently 7,728MW and there are 64 wind plants, so the average is 120MW and a 500MW fall in power is similar to four wind plants stopping. Those power losses are significant — not just a few towers here and there — a 500MW loss is like 250 to 270 of those individual wind towers stopping.
I divided the sudden losses into five different time frames. I assessed the number of times this happened and also the range of the power losses that occurred. All these separate failures occurred in the last two years and two months or 800 days.
… Time Frame Number of Incidents Range of power losses Short … Power losses in less than one hour (0 – 55 minutes) 53 500MW to 1340MW Power losses in One Hour (56-60 minutes) 54 500MW to 980MW Power losses between one and three hours (65 – 180 mins) 52 630MW to 1570MW Long Power loss between three and eight and a half hours (3 – 8.5 hours) 42 1240MW to 2490MW .. Power loss over sustained long period of time (9 hours or greater) 64 1500MW to 3670MW. (with 10 times over 3000MW)
As each of the time frames increased, I looked for larger power losses which would challenge the system. There were also many smaller sub 500MW incidents over the longer period which I did not include.
Keep in mind here that there were 265 occasions in the last 800 days where the power loss exceeded 500MW.
As often as I look at all this data, something that I did not see earlier has became more obvious — nearly all of those losses in the short time frames were when power generation was already quite high, and again, this is a further reason I have split all of this into those two areas, the three short time frame ones, and the two long time frame ones.
With all the images on this page, if you click on the image, it will open on a new page and at a much larger size, so you can better see the detail.
Wind Generation Sustained Power Loss
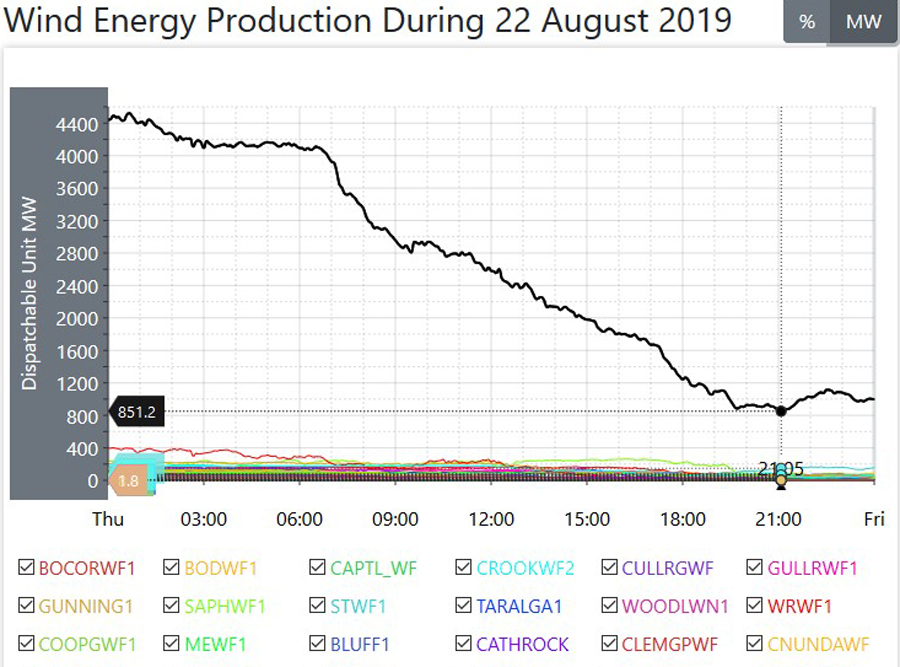
The longer and large losses are due to large High Pressure cells sitting over the Eastern states
I was already aware that when it comes to those long time frame power losses, it was apparent it was related to the weather. Every time one of those large High pressure weather systems came into an area in the South of the Country, then wind generation would fall away by a large amount. An example of that is shown in the image at the right, and here, you can see that power generation fell away from the high of 4500MW just after Midnight to that indicated low around 850MW, a loss of 3650MW across that time frame of 20 hours. So, what we have here is that the greatest percentage of all the data that I was recording was coming from that same area where those High pressure systems would pass over. This was the South Eastern area of South Australia, and the Central West area of Victoria. Now, that particular area is where the largest number of those wind plants are located. Australia has (now) got a total Nameplate for wind power of 7728MW. However, in that area I have mentioned here there is now a total Nameplate of 4916MW, and that is 64% of ALL the total wind plant Nameplate in the Country, two thirds of it all, just in those two States alone.
The shorter sharp losses are due to high wind cut offs
The short time frame power losses are related to the weather as well. We have been told often enough that these wind towers only operate between specific wind ranges. When the wind gets too high, then the wind towers automatically turn off, and the same happens when the wind is too low, they also turn off automatically.
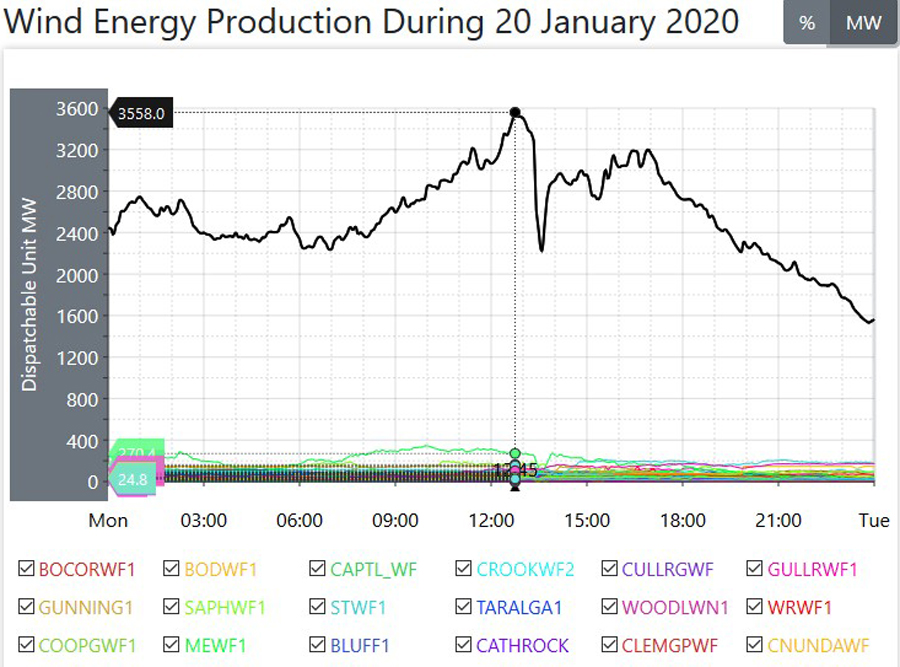
Short Term Large Power Loss Wind Generation
So, what is happening here for those short time frame power losses is that between the occurrence of those large High pressure weather systems over that area, moving as they do from West to East, the isobars are closer together, and because of that, the wind is high, and so, there is high wind power generation. However if the wind gets too high, then the turbines turn off.
An example of this is shown in the image at right, where power was already relatively high at the indicated high of 3558MW, and it quite suddenly fell 1340MW in 45 minutes. On that same image, you can also see that this happened earlier in the day twice, just after 2AM, and again just before 6AM, where, both times, it fell by more than 400MW, and then fell around 1500MW in a sustained period of more than seven hours.
A 500 MW fall shows that in a short space of time, a large number of towers turn off in high wind situations.
Yet again, the problem we have with the intermittency being supposedly resolved by constructing more of them, has in this case, also been made worse, as now there are more wind towers in that area, as more plants are constructed in that area, and now they are more susceptible to large scale losses in shorter time frames when the wind gets too high.
When this survey started back in May 2018 the total Nameplate for Wind Power was below 5000MW. In the 26 Months since then, the Nameplate for wind power has increased by almost 3000MW. This represents probably around 20 or more new wind plants, a lot of which has been in South Australia and Victoria.
This data I have collected here shows that the intermittency problem is getting worse, as there are more occurrences of power losses, and those losses in power generation are becoming larger.
In the next two Posts I will detail those losses, show you the tables of the scale of those losses, and explain them with respect to using three images for each time frame period across the 800 days of this data gathering task.
*****
Anton Lang uses the screen name of TonyfromOz, and he writes at this site, PA Pundits International on topics related to electrical power generation, from all sources, concentrating mainly on Renewable Power, and how the two most favoured methods of renewable power generation, Wind Power and all versions of Solar Power, fail comprehensively to deliver levels of power required to replace traditional power generation. His Bio is at this link.