Recent Posts
-
Monday
-
Sunday
-
One Nation are now the Party of the workers, and Labor the party of wealth and academics
-
Saturday
-
Net Zero anyone? USA bets big on coal and gas — overtakes China in spending.
-
Friday
-
Winning: Trump persuades The World Bank to drop its huge spending target on “climate”
-
Thursday
-
Bafflement?! Germany, a global leader in renewables but has one of the highest EU electricity prices
-
Wednesday
-
Horse-drawn carriages must have caused a Megadrought in Europe in 1540, right?
-
Tuesday
-
Monday
-
Sunday
-
UK facing devastating 36 degree heat — can’t decide whether to use air conditioners or rip them out
-
Saturday
-
Batteries failed on day One: A four day wind drought in South Australia wreaks havoc, high prices
-
Friday
-
The UN wants to be One World Government and it starts with a carbon tax on ships and planes
-
Thursday
-
What if Global Warming was just because something made the clouds go away…
-
Wednesday
-
Snowy 2.0 is the Trillion dollar Black Hole of Australia — sucking in energy, money, land, industrial relations, the dollar, our lifestyle
-
Tuesday
-
Monday
-
Winter Solstice
-
Saturday
-
We were throwing-renewable-energy away at record levels in 2025
-
Friday
-
Pauline Hanson, the centrist, just wants a free market in electricity, and an end to the renewable energy bribery
-
Thursday
-
Blame the Climate Yeti again for making your life more expensive! (It’s a smokescreen)
-
Wednesday
-
The Sunrise Project funneled $343 million from overseas to push net zero
-
Tuesday
-
Monday
-
Sunday
-
The US government has been secretly funding 120 dangerous biolabs around the world
-
Saturday
-
New report shows renewables are a drag on our national productivity
-
Friday
-
Thursday
-
Well, how convenient. AI data centers have arrived to be the fall guy for the Energy Minister
-
Wednesday
-
Billionaires are leaving the room with excuses — Bezos says “AI will solve climate crisis”
-
Tuesday
-
Monday
-
Sunday
-
The Craziest eco laws against Farmers. Let’s check that science…
-
Saturday
-
China cooks the carbon accounting books by 400 million tons
-
Friday
|
Some extraordinary statements from Owen Paterson, the man who was the UK Environment Secretary until a week ago. This is baking hot. Paterson also draws attention to the way big-goverment has fed big-government lobbyists 150 million euros since 2007. Can we get this man to Australia? — Jo
I’m proud of standing up to the green lobby
The Telegraph UK I leave the post with great misgivings about the power and irresponsibility of – to coin a phrase – the Green Blob.
By this I mean the mutually supportive network of environmental pressure groups, renewable energy companies and some public officials who keep each other well supplied with lavish funds, scare stories and green tape. This tangled triangle of unelected busybodies claims to have the interests of the planet and the countryside at heart, but it is increasingly clear that it is focusing on the wrong issues and doing real harm while profiting handsomely.
Local conservationists on the ground do wonderful work to protect and improve wild landscapes, as do farmers, rural businesses and ordinary people. They are a world away from the highly paid globe-trotters of the Green Blob who besieged me with their self-serving demands, many of which would have harmed the natural environment.
I soon realised that the greens and their industrial and bureaucratic allies are used to getting things their own way. I received more death threats in a few months at Defra than I ever did as secretary of state for Northern Ireland.
Keep reading →
9.4 out of 10 based on 153 ratings
Flagging an update (coming) to Big News Part III
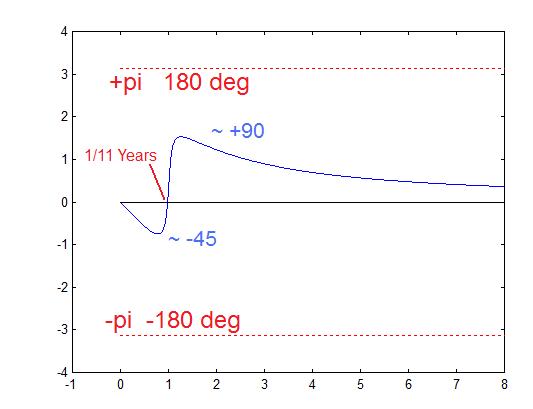
Score 1 for open science review, thanks to Bernie Hutchins, an electrical engineer who diligently asked the right questions about something that bothered him regarding the notching effect. We’re grateful. This will improve the model. On the downside, it means we’re slightly less certain of the delay (darn) — the notch doesn’t guarantee a delay as we had previously thought. But there is independent evidence suggesting temperatures on Earth follow solar activity with a one cycle delay — the lag seen in studies like Archibald, Friis-Christainsen and Usoskin is still a lag.
What does it mean? The step-response graph (figure 2 in Part III or figure 4 in Part IV) will change, and needs to be redone. The reason for assuming there is a delay, and building it into the model, rests now on the independent studies, and not on the notch. The new step change will need to be built into the model, and in a few weeks we’ll know how the predictions or hindcasting change. David feels reasonably sure it won’t make much difference to the broad picture, because a step-response something like figure 4, Part IV, explains global warming fairly well and will presumably arise again with the new method. But obviously it needs to be done to be certain.
The irony is that it was the FFT (Fast Fourier Transform) that produced what appeared to be a “non-causal” notch (and if it was non-causal, it would necessarily mean a delay). If David had used his slower OFT (Optimal Fourier Transform) the mistake might not have arisen, because, unlike the DFT and FFT, the OFT uses frequencies whose periods do not divide exactly into the length of the time series. In one of the those quixotic paths to understanding, the incorrect clue of a solar delay of one cycle “fitted” with the other evidence, and possibly David wouldn’t have seen the pattern if he’d used the OFT.
The previous post Big News Part III needs correcting (which is coming), and Bernie Hutchins needs a big thank you. Without his time and effort in comments, David would not have spotted the problem in the code. And it’s so much the better to know it sooner rather than later. — Jo
David Evans replies to Bernie Hutchins
That graph of the phase of your transfer function matches mine, so that pretty much seals it at your end. You appear to be analyzing the correct notch filter.
Your remark that “might have meant the DFT and not the FT” was an important clue. I had used DFT/FFT’s to get the spectrum of the step function. The DFT implicitly assumes a time series repeats to infinity — because the DFT uses only frequencies whose periods exactly divide into the length of the time series. The response I was calculating was therefore of a series of rectangular pulses, even though I was calculating the responses of a times series that was all zeros in the first half and all ones in the second half (so it looked like a step function). When I check the spectrum of what I thought was the step function, I now see that it has only the first, third, fifth etc harmonics — just like the Fourier series of a train of rectangular pulses. The amplitudes have the 1/f dependence like the spectrum of a step function, but the even-numbered harmonics are missing — but they are not missing in the spectrum of a step function.
So that finally resolves the discrepancy. My response was to a train of rectangular pulses and was incorrect. Yours was to a step function, and presumably is correct (it makes sense intuitively, but I haven’t checked it numerically yet).
Bernie, thanks for helping me find the bug, and thank you for your persistence. Well done! I am in your debt. I asked many people to check it, but you are the only one to find the problem. It is good to get this sorted out. (One other person calculated a response in Mathematica but the response seemed to come from infinity near t=0 as I recall, so something was wrong there.)
Everything else about the method worked, so my usual checks didn’t find any problems. The low pass filter and delay work just as well on a train of pulses as on a step function, so they appeared ok. Just changing the length of the time series usually exposes problems like this, because extending the time-series should not make any difference, so if it does there is a problem. In this case I had pushed it out from its usual 200 years to 20,000 years, and it made no difference. Changing the rate at which the function was sampled also made no difference. So it all seemed to check out numerically. It turns out the spectrum of a series of pulses is fundamentally different to a step function, so I was just consistently getting the wrong answer.
Keep reading →
9 out of 10 based on 53 ratings
The mystery of Australian temperature adjustments
Ken Stewart has been checking the Australian BOM official ACORN minima data against the raw data. This week he highlights the six very strange cases of Brisbane Airport, Amberley RAAF, Dubbo, Rutherglen, Rabbit Flat, and Carnarvon. In all these places the adjustments change the trend by more than 2 whole degrees C. It’s a kind of hyper-homogenization.
Thermometers are supposed to be accurate to a tenth of a degree. Australian average trends are sometimes calculated to one hundredth of a degree. What then do we make of adjustments that change the trends by a whopping 2 degrees, and decades after the data came in? The only thing we know for sure about Australian temperatures is that we need an independent audit. Why is it left to volunteers to check? Surely the Greens want good data too?
Some of these stations are isolated outposts, so theoretically they are the heavyweights on Australian area-weighted averages. The map scales can be a bit deceptive. In outback Australia the nearest neighbours can all be 500 km away (300 miles). Some dots on the map are not so much a town as a motel and a gas station. Sometimes one lonely thermometer gets the job of estimating temperatures across thousands of square kilometers. This applies to Rabbit Flat, and we’ll discuss that in a different post.
We’ve talked about the extraordinary case of Rutherglen before, where a cooling trend across a whole region becomes a homogenized warming one. And both I and Jennifer Marohasy have discussed the extreme oddness of Amberley.
But Carnarvon provides new material for playing Guess-why-this-got-homogenized? In the case of Carnarvon (see below) the raw trend shows an ever so slight warming over the last century, something like 0.2C, but the all-new adjusted “high-quality” ACORN trend is rising instead at around 2.2C per century.You might think Carnarvon was the aberrant outlier — a station that was different to the rest of the region so it’s been adjusted to fit. Except the original raw Carnarvon trend was virtually the same as the raw average of all its nearest neighbours (bar one). So all those must be flawed too? Well, the BOM didn’t think so, because the adjusted trends of neighbouring towns are only warming at a modest half a degree a century, while Carnarvon is ripping along at more than 2 degrees.
I’ve spoken to Ken Stewart, and he’s just baffled about all six stations. Perhaps there is a reason for these drastic adjustments. But without detailed and credible answers, how does a rational person have confidence in the current almighty ACORN set? There are too many mysteries (like, say, the hottest-ever day being in Albany, an obvious error that still hasn’t been detected by their “expert” peer review).
 Carnarvon (Western Australia) has ACORN neighbours: Learmonth (298km), Wittenoom (560km) , Meekatharra (524km), Geraldton (447km), and Morawa (538km). The only non-Acorn site with continuous data for the early part of last century is Hamelin Pool 6025 (174km away). Ken Stewart’s conclusion: –
The Acorn adjustment algorithm creates homogenised data by comparing with up to 10 neighbouring sites. I have shown that the adjustments have made the Acorn trends greater than, not only the raw data trends for each site, not only the raw data trends of the closest neighbours in the Acorn dataset, but in every case but one, greater even than the trends of Acorn homogenised data from the same neighbouring locations. The adjustments created thus appear to be spurious and the algorithm faulty.
Carnarvon adjustments don’t make sense
 ….Fig. 6a: Raw vs Acorn
Keep reading →
9.6 out of 10 based on 109 ratings
Don’t miss: The Book Launch: “Not for Greens” by Ian Plimer.
“Not For Greens is a powerful critique of the green movement and the damage it has done to living standards around the world.”
PERTH: Monday, July 21, 2014, at 6:00 PM, Fire and Ice, Subiaco Square (next to Subiaco train station), a mere $10. I’ll be there. The Perth Book Launch info.
MELBOURNE: Tuesday 22 July, 5.00pm for 5.30pm to 7.00pm, CQ Functions, 113-123 Queen Street, Melbourne RSVP (IPA)
BRISBANE: Monday July 28, 2014 5.00pm for 5.30pm to 7.00pm Pullman Brisbane King George Square, Corner Ann & Roma Streets, Brisbane
RSVP for Melbourne and Brisbane at the IPA here http://rsvp.ipa.org.au/. 03 9600 4744.
H/t to Lance thanks!
8.8 out of 10 based on 56 ratings
Wayward thoughts…
7.1 out of 10 based on 17 ratings
In response to Australia removing the Carbon Tax the ABC News report broadcast the best arguments of believers in man-made global warming . They tell us we should spend billions to manage a ubiquitous natural molecule with a fake market, in the hope we’ll get nicer weather. If you question that you are a bad, bad person. You are the kind of vile, stupid and selfish person, a troll, who doesn’t mind killing people with asbestos or tobacco, you are an international pariah, a shock-jock and an irrational, unthinking denier.
Ladies and Gentlemen, this is our national debate, by our leading “thinkers”, broadcast on our national public news service:
ABC News 17-7-2014
ADAM BANDT, DEPUTY GREENS LEADER: This is the Australian Parliament’s asbestos moment, our tobacco moment, when we knew what we were doing was harmful but went ahead and did it anyway.
RICHARD DENNISS, AUSTRALIA INSTITUTE: … We’re outing ourselves as a pariah. We’re outing ourselves as a country that’s not committed to tackling climate change.
BILL SHORTEN: Direct Action is a Clayton’s climate policy, designed for the audience of internet trolls and shock-jock radio announcers and climate sceptics.
It is but namecalling. They pretend it is science. The ABC put these arguments forward as if they were a sensible addition to the debate. Sarah Ferguson does not notice that the intellectual depth of the arguments amounts to social opprobrium and character attacks.
In a similar vein, Tim Flannery wants your money so he can “respond with the facts”. But instead of facts he offers us religious instruction about which beliefs are socially approved:
“…an unprecedented rise in climate denialism.”
“… these fringe views.”
“… support me and discredit deniers…”
Jo wonders which dictionary defines two-thirds of the population as “fringe”? It must be another Flannery “fact”.
9.6 out of 10 based on 168 ratings
 Albany, Western Australia. Not near a desert. Not near the tropics. Hottest place in Australia? Lucky, thanks to the BOM, that we have such high quality data to understand the Australian climate. Without it, we would never have found out that the hottest day ever recorded in Australia appears to be the 8th of February, 1933 in, wait for it… Albany, in the far cool south of Western Australia.
Chris Gillham emails:
“Guess where and when was the hottest day ever recorded in Australia? 50.7C at Oodnadatta on 2 Jan 1960? No way! Mardie at 50.5C on 19 Feb 1998? Get out of here! It was at Albany on 8 February 1933, that historic day when this normally chilly town on WA’s southern coast was razed with a temperature of 51.2C. Don’t believe me? You can’t question the accuracy of ACORN, a temperature network that shapes economic policy, and the screenshot from last night’s ACORN download for Albany max proves it …”
The all new marvellous ACORN dataset has been “expert peer reviewed”, it “employs the latest analysis techniques “ and it is “a complete re-analysis of the Australian homogenised temperature database”. Phew. The BOM lists their hottest days here, but they don’t seem to have noticed the hotter than hot Albany record yet.
It gives you a lot of confidence in the accuracy of all the other daily temps, doesn’t it? There doesn’t appear to be any sinister design here, just plain incompetence.
Australians need a full independent audit on our temperature records.
Keep reading →
8.8 out of 10 based on 139 ratings
As of today, Australia no longer has the most expensive “carbon” price in the world. The voters didn’t ask for a tax in 2010, but it was forced on them in 2011. They rejected it wholeheartedly in 2013 but it still has taken months to start unwinding this completely pointless piece of symbolism which aimed to change the weather. The machinery of democracy may be slow, but this is a win for voters.
11:15am EST today: The Australian Senate passes the carbon tax repeal bill.
“Australia has become the first country in the world to abolish a price on carbon, with the Senate passing the Abbott government’s repeal bills 39 votes to 32.“ SMH
Now we need to turn off the tap to all the other green gravy rent-seekers who ignore the evidence.
h/t Matthew (aka Matty thanks!)
Other news services are starting to cover this. All the cross-benchers except Nick Xenophon (who was absent) voted for the repeal. Labor and the Greens opposed it. News.com
Soon big companies will stop paying a penalty on carbon emissions, currently just over $25 a tonne, ending Australia’s most controversial policy implementation since the 2003 decision to join the Iraq invasion.
Labor dragged out the final debate stages with questions about the Palmer United Party’s amendment to ensure price cuts from the carbon tax repeal are passed fully onto consumers and businesses. The Greens took a similar line of questioning and quizzed the finance minister about the government’s promised $550 saving for households from the repeal of the carbon tax.
On the question of $550 per household per year — just as it was impossible to know exactly how much more everything cost with a carbon tax, it will be impossible to know exactly how much less we will have to pay, and it will take months for savings to be passed through the supply lines. And billions of dollars wasted will never be recovered.
9.4 out of 10 based on 226 ratings
Niger, Africa, is considering building a new small coal fired power station. Greenpeace have protested before at coal power stations in Africa. But how compassionate are those who don’t want Africa to use cheap coal fired power (like, say, professors at western universities?) TonyfromOz puts the issue in perspective. I knew much of Africa was very very poor, but this rather lays the dismal extent out before us. Mali, a nation of 15 million people produces the same amount of electricity as the small town of Dubbo, NSW. Niger, with 17 million, produces even less. All up, there are 23 nations in Africa that each produce less electricity than Dubbo. If we combine them, the 142 million people in those 23 nations are using the same amount of electricity as Adelaide in Australia (which has about 1.1 million people). Stark.
Perhaps we could ask Niger if they’d like to help reduce global temperatures by 0.0 degrees, or if they would rather save money and have electricity that works at night instead? — Jo
Guest Post – TonyfromOz
 Niger, Africa Recently, a new coal fired power plant was proposed for the country of Niger in Africa. Green heads say Africa should be going “renewable” instead, not producing more CO2.
However, when we look in detail at the power generation in Africa, we see some startling facts about how little electrical power they actually do have. The total population of the whole of the 58 African countries is at 1.15 Billion people, and probably close to 600 Million people or even more have no access whatsoever to any electrical power, let alone the readily accessible and well regulated supply which we in the Developed World take so utterly for granted.
So then, would this proposed coal fired plant add much to that poor access to electrical power? After all, it’s only a relatively small plant of just one Unit, and the Nameplate Capacity is only 600MW.
Here in Australia, recently, the director of the Earth Institute at Columbia University, Professor Jeffrey Sachs was here telling Australians that we need to move closer towards a low carbon economy. One of the things he said was the following: (my bolding)
Actually poorer countries have wonderful options because the price of photo-voltaics is falling so sharply, places like Mali. Actually the low-cost solution is off-grid photo-voltaic power. The fact that we can now put solar panels for pumps for irrigation, for refrigeration, for cold chains, for vaccines, for running schools, for allowing remote schools to be online. Those poor countries have options. — ABC interview
So is small scale Solar PV power any use to countries like Mali? There are 15.5 million people in Mali and they have a total power generation of 520GWH (gigawatt hours) per year, and while that sounds like quite a lot, it is very small per capita. It is about the same power generation as the town of Dubbo in NSW, Australia — which has only 40,000 people, not 15 million. Mali has 387 times more people than Dubbo has. And that the city of Dubbo is not special in the developed world. It has average power consumption for a city of that size.
So I invented “the Dubbo-scale” and went hunting to see which African nations have less power generation than Dubbo. (Which is roughly the same size as Bozeman, Montana, Cupertino city California, or Mentor, Ohio or Perth in Scotland.)
The US EIA lists power generation data for all countries. I then drew up a chart listing all those African countries scoring less than “1” on the Dubbo-scale of electricity production. There are 23 countries on this list, so more than half of all African nations produce less electricity than Dubbo.
Keep reading →
9 out of 10 based on 93 ratings
The Coalition must be thrilled today that the Australian Labor Party want to run the next election on the carbon tax. Could there be better news for Tony Abbott? Labor has vowed “to fight for “a serious, credible climate change policy’’ .”
The Carbon Tax was a centrepiece at the last election and the voters threw it out. Current polls show only 35% of voters want it. So far it has brought down two prime ministers and an opposition leader. The damage looks set to continue.
For Labor, nothing has changed. They still think it was right to tell the voters there would be no carbon tax in the 2010 election campaign, and then bring in a carbon tax. (Who cares what the voters think?) The Labor Party still thinks a tax can change the weather. They still are the gullible patsies for large financial houses bringing in a fake market in a product that nobody wants, that depends on unknowable “intentions”, and is prone to fraud. The Labor Party plan to help workers by transferring billions of dollars from citizens to the financial sector and green-renewable industry patrons, all in a quest to reduce the global temperature by 0.0C 50 years from now.
The Australian — Mr Shorten, speaking against the repeal, said Labor had been right to introduce a carbon price but “did the second best” when it walked away from calling an election in early 2010 “that the nation was entitled to have’’ on an ETS.
“We were right to have international pricing,” he said. “We were right to support an emissions trading scheme.
“We were right to have climate change as a political priority of the previous government.”
Mr Shorten said Labor did not apologise nor resile from its climate change policy.
This is all about the ultimate in big-government — global energy tax and control, with virtually no accountability to voters. The big-gambit is coming again, and Bill Shorten is all too aware:
He (Shorten) said Australia faced a choice next year in Paris when world leaders would gather to develop the next set of emissions goals for 2030.
As I keep saying, the only people who want a “free market” in carbon are those that don’t know what a free market is. Free markets depend on voluntary consent, on products that people willingly buy, and on efficiencies that come from having a product that people can see and assess for themselves.
9.1 out of 10 based on 64 ratings
UPDATE Thursday: DONE Success at 11:15am this morning in Canberra. The Carbon Tax is gone.
UPDATE: Weds –– This could take days. The repeal was before the Senate this morning. Labor and the Greens are “dragging the debate out” with speeches. “Filibustering” according to Finance Minister Mathias Corman (The Australian). More debate is due tonight. But the Senate has agreed to extend sitting hours after Friday and keep coming back until this is resolved. They were due to start a 5 week break on Friday. (See Sky News too). This doesn’t look like being resolved today. (SMH)
Sydney Morning Herald: It [The government] was concerned that while all eight cross-bench senators say they are committed to consigning the carbon tax to history in a final vote, as many as three might baulk at the use of a guillotine to bring an end debate and force that vote.
In a further sign the government had lost exclusive control of the legislative timetable, the Climate Change Authority bill was removed from the list of those to be considered, supposedly at the insistence of the PUP.
Sources said the CCA bill, the purported vehicle for Mr Palmer’s proposed ”dormant” emissions trading scheme, will not be presented this week. Fairfax understands there is also last-minute discussion over Mr Palmer’s belated inclusion of India in the basket of countries to which the CCA would be required to look when recommending that Australia should activate its dormant ETS.
This post will stay sticky at the top until this is resolved. New posts will appear underneath – Jo
Keep reading →
8.8 out of 10 based on 48 ratings
For all the fuss about an Emissions Trading Scheme (ETS), Australia already has a version of a market in carbon credits and it was set up in 2001 by the conservative Howard government. The RET, Renewable Energy Target, aims to reduce emissions by mandatory use of 20% renewable energy by 2020. For all kinds of reasons we are overachieving, and headed for 27% renewables mix (along with shocking electricity bills, see here too).*
“Official estimates suggest that the RET will generate a transfer of $20bn from householders and industrial users by 2020.”
So in this artificial government-mandated market, which sector is fast to get involved? Finance.
This is not so much an efficient free market as its pale cousin, the whimsical fake market. But free or fake, banks are there. You can’t blame them. But nor do we need to feed the machine unless there is a good reason.
Banks exposed to big RET risks
The Australian: AUSTRALIA’S banks are holding nearly $900 million worth of certificates designed to stimulate investment in renewable energy generation as the price of those instruments becomes captive to the political debate over green energy schemes.
Banks including ANZ, Macquarie Group, Westpac and Commonwealth Bank hold 5.9 million, or 20 per cent, of the 28.4 million large-scale energy certificates (LGCs) issued and yet to be redeemed under the Renewable Energy Target scheme, according to information supplied to the Senate.
Any artificial market almost instantly creates players with property rights. That’s the reason a trading scheme is much harder to unwind than a tax. Once it is created, automatically, there are lobby groups, armed with lots of our money, to keep it going. At least with a tax, voters might get the chance to vote for or against it. In a true free market, voters have the ultimate right — to ignore it completely. They can vote with their feet every day, and spend their money on something better. That’s not what is happening here.
The players in this market are not so much betting on natural events as they are betting on politics. Does that help the nation produce real things, or does it just turn us into a kind of casino where people can bet and lobby on the dice?
 The price was $40 – $50 a couple of years ago. This is a fake market determined more by political choice than by buyers and sellers making efficient decisions about the real world. Market sources speculated that the banks were holding large pools of LGCs under financing arrangements with renewable energy generators and electricity retailers. According to information on the holdings given to Senate Standing Committee on Environment and Communications by the regulator, ANZ is the second-largest holder of LGCs, with 4.36 million, behind Origin Energy, with 5.9 million. Origin is also the largest holder of retail certificates, with 372,677 of the 5.1 million on issue. The price of the retail certificates has climbed from about $25 last year to nearly $40.
Keep reading →
8.9 out of 10 based on 47 ratings
The latest Newspoll results say that Australian voters want Clive Palmer to stop blocking the repeal of the carbon tax.
[The Australian] A Newspoll conducted exclusively for The Australian after last Thursday’s chaos in the Senate saw the repeal bills rejected, reveals 53 per cent want the controversial tax to be abolished.
Only 35 per cent want the Palmer United Party to continue to block the removal of the tax, while 12 per cent are uncommitted.
So one third of Australia wants us to keep the carbon tax (they can always pay it voluntarily thinks Jo?)
Keeping the carbon tax is costing Australians $11 million dollars a day. There is a deadline. It’s Friday:
The electricity industry incurs $11 million a day in carbon tax charges and market-traded contracts have not been trading carbon since July 1. But a carbon price of $25.40 a tonne will be returned to the contracts if the repeal fails to pass the Senate by Friday. Mr O’Reilly said failure to achieve the repeal by Friday would complicate returning savings to customers by “an exponential amount’’.
Even 33% of Labor voters want the tax gone.
Keep reading →
8.9 out of 10 based on 64 ratings
For wandering thoughts…
7.4 out of 10 based on 28 ratings
Filed under: A Curiosity for a Friday
 The far side (left) does not look like the near side (right) there are no maria or “seas” on the far side. For 55 years some people have wondered why the near and far side of the moon look so different. (I can’t say it had occurred to me, but the answer is very cool anyway.) The far side of the moon has none of the dark flatter pans or seas called maria – instead it is covered from top to bottom with craters.
What I find even more amazing is that the Earth and Moon have been locked in an orbital dance where the same side of the moon always faces the Earth, round and round, and it goes on for billions of years. (Yes, and how do they know, I also wonder, but there is an answer below.) In any case, here’s a new theory that might explain the difference between the near and far sides. It’s very neat.
The Earth and Moon have a rather extraordinary relationship. Not long ago we heard how the gravitational tidal forces between them are so strong it causes tidal bulges in the rock of the moon that lifts moon-rock by 50cm in a roaming bulge that follows the Earth. And we know the Moon causes a daily shift in 70% of the matter on the Earth’s surface.
 A Mars-sized impact may have formed the moon. But as you ponder this intricate relationship of Moon and Earth, remember the moon definitely does not affect Earth’s climate. I know because a CMIP5 climate model told me so…
(By the way, the far side is also called the dark side, which doesn’t make much sense in the usual meaning of “dark” because it is not dark to sunlight, just to all eyes on Earth.)
[PENN STATE press release a few weeks ago]
This mystery is called the Lunar Farside Highlands Problem and dates back to 1959, when the Soviet spacecraft Luna 3 transmitted the first images of the dark side of the moon back to Earth.
The new idea that the strange difference in the near and far side started right at the beginning. If the Moon was made when a Mars size body smacked into Earth — the reasoning is that it would have left them both hot – as in 2,500C hot. The Earth and Moon became locked together in orbit from the start, with the same side of the moon facing Earth – and the molten minerals gradually were sorted into a gradient. It’s a bit of a supersized centrifuge — eventually the far side of the moon had more aluminium and calcium. The story goes that side would have cooled and hardened first with a thicker crust because the Earth heated the near side a bit more, or just slowed the cooling — like a kind of Earthshine effect. Then when meteors hit the thinner crust on the near side, lava welled out into big flat pools forming the maria.
Look, it sounds believeable. Who knows? I’m just drawn to the big ponderables…
The Earth and the impact object did not just melt; parts of them vaporized, creating a disk of rock, magma and vapor around the Earth.
Keep reading →
8.2 out of 10 based on 51 ratings
Clive Palmer, the coal mining Billionaire and his three (or four) PUP Senators have voted down the Carbon Tax repeal they said they would pass. It was quite the blockbuster day in Australian politics. They supported the government move to bring on the vote at 11:45am today, then decided not to vote for the repeal bill. They hold the balance of power. The carbon tax is still law. It may get voted on again by next Thursday, but if that fails, it won’t be voted on again til August, and millions in carbon tax payments are on the line.
There are at least three version of why the bill failed (the same thing happened the day Palmer met Gore). Sky News suggests PUP wanted to change their amendments. According to News.com, Palmer says the amendments put forward by the Coalition were older ones, and not the newer ones the Coalition agreed to, and he claims the government pulled a “swifty”. In an article in The Australian, it appears the problem was that the amendments were not circulated at 8.30 this morning. Given that Palmer has been known to feed scurrilous versions to the media, perhaps the confusion here is no accident?
Without seeing the actual amendments (can anyone find them?) it’s difficult to know, though at this rate those amendments will change by Monday, so the point is probably moot.
First up, lets look at the three versions of what happened (all of which may be right, who knows?) Secondly, we consider why the stakes are so high to get this through so fast. Our carbon tax is currently the worlds higest at $24 a ton, and businesses is not sure if it should be collecting it. The Business Council of Australia concludes “Electricity companies will be holding about $200 million in carbon tax by the end of next week”. Lastly we look at a hint that Palmer might be thinking of a real ETS scheme to be “attached” to the Coalitions Direct Action legislation. The joy of Australian politics. With such high stakes, Palmer may plan on having Abbott over a barrel by late Thursday next week.
9.3 out of 10 based on 53 ratings
The evidence for man-made climate change is now so overwhelming and convincing that the BBC has written to a Green politician to apologize for airing alternate views (the dumb punters might get the wrong idea, eh?). The head of the BBC complaints unit told the Green politician it would not happen again.
Well obviously, it doesn’t help the United Kingdom to allow riff raff like the former Chancellor of the Exchequer to present his views — unless he agrees with the doctrine, of course. How could anyone expect listeners who are merely doctors, lawyers, teachers, and businesspeople to be able to understand a debate this complex? (Only certified government approved scientists, and BBC journalists have the mental ability to understand the nuances of an argument which uses large numbers, like 97%). Henceforth, British voters must be shielded from alternate views. Repeat after me: there is a consensus.
The nub of the matter is that the Lord Lawson says he’s banned on the BBC. The BBC, of course, says he’s not. But there is this odd official decision: “The ruling found a false balance was created in that the item implied Lord Lawson’s views on climate science were on the same footing as Sir Brian Hoskins.” And there is that training for 200 senior managers on how to not insert “false balance” into stories. In other words — it doesn’t matter how logical or well informed you are, if you speak against the approved line of thought, the BBC must make sure the audience knows your views are less worthy. (For BBC audiences, I presume the new policy will be hard to tell from the old one).
The Lawson-v-BBC story is that once-upon-a-time he was invited to speak on the Today program quite often, but since he became an outspoken and influential skeptic, there was only one invitation in February 2014, and that might be all there ever will be. Lawson founded the hugely successful GWPF in 2009, and wrote a best seller on the topic of climate change, but wasn’t asked to talk on the BBC flagship radio program until February this year. It was a civil debate with the scientist Sir Brian Hoskins– chairman of the Grantham Institute for Climate Change. (Transcript here.) At least that’s how it seemed at the time. But for weeks afterwards the complaints raged:
Following the programme, on February 13, all hell broke loose.
Keep reading →
9.6 out of 10 based on 100 ratings
Even if we can’t be there we can still watch it live. In years to come people will marvel that the true spirit of science was kept alive by a small independent think tank. Thank goodness for Heartland.
The live stream (and links to talks from Monday and Tuesday).
Please tell us in comments which parts you appreciate the most. Jim Lakey tells me that “Australian MP George Christensen gave a great presentation (starting at the 28:30 mark), though it was panned by the ABC.” Typical. – Jo
——————————————————————————————————————–
[Official Heartland Release]
Day-Three Live Stream of International Climate Conference Features Lifetime Achievement Award to S. Fred Singer
Skeptic Conference Ends with Discussions of Latest Science Challenging UN Reports, Recognition of Professional Courage and Honesty
LAS VEGAS (July 9, 2014)— Today, the last day of the Ninth International Conference on Climate Change(ICCC9), will include the presentation of the “Lifetime Achievement in Climate Science Award” to Dr. S. Fred Singer, as well as 29 more presentations from leading “skeptic” scientists and policy experts of a human-caused climate crisis.
The live stream with full coverage of ICCC9 will begin at 8 a.m. PDT today (Wednesday, July 9.) The last of 70 total presentations at the conference will conclude 4 p.m. PDT.
Keep reading →
8.8 out of 10 based on 35 ratings
Dr David Evans, 8 July 2014, David Evans’ Notch-Delay Solar Theory and Model Home
At the introduction to this series of blog posts, we said we’d release the spreadsheet containing all the data, model, and calculations. All in one file for Microsoft Excel. Thanks for your patience.
The model, data, code and calculations are here: Climate.xlsm (20Mb).
Containing 44 datasets, 33 sheets, 90+graphs, and 15,000 lines of code
New Here? See this summary of posts. Evans looked at TSI (total solar irradiance) and Earths temperature, and discovered a mysterious notch filter. That implies some kind of solar effect occurs with an 11 year delay — or one solar cycle after the TSI. He built a model. See the hindcasts, and the prediction of imminent cooling. See the replies to critics.– Jo
 (Click to download the Climate.xlsm file. 20Mb) Why Excel?
I chose to do all the work for this project, right from the beginning, in a single Microsoft Excel spreadsheet for pc. It’s not the fanciest or the fastest, but an Excel spreadsheet is the most ubiquitous, and one of the friendliest programming environments as well. It runs on most computers—any Windows computer with Excel 2007 or later, and possibly on Macs with Excel 2011 or later (in principle it should work, but could someone who tries it let me know if there is anything that definitely does not work on Mac please?)
The models use VBA code, the BASIC programming language that is part of Microsoft Office. There are buttons on the sheets to make models run and so on. You can inspect and run or step through the code; it is all totally open.
The main, long discussion paper is still to come. There is more to this series of blog posts. We don’t want to preempt what is coming, and it’s useful to keep the discussion focused.
Some random screenshots for those who want to oogle without the 20Mb download. (No, it doesn’t begin to capture the sea of data.)
 (Click to enlarge) |
|
 (Click to enlarge) |
 (Click to enlarge) |
|
 (Click to enlarge) |
 (Click to enlarge) |
|
 (Click to enlarge) |
The optimization process by which we found the range of parameter values for the notch-delay solar model, and their most likely values, is complicated by the presence of many local minima. It is lengthy and was guided at hand at some stages, to trim the burgeoning number of possibilities in sensible ways. So at this stage we are also releasing excerpts from the main paper that define and describe the model, the total climate model, and the finding of the solar model parameters.
The spreadsheet was written for doing research—it is not a production version intended for consumers. It assumes the user knows generally what is going on. There are some descriptions and help, mainly in text boxes and comments (the red triangles in the upper right of cells—hold the mouse over the cell and the comment pops up).
People are welcome to make changes, but the only authorized copy of the spreadsheet will be at the download location above. Please send corrections or suggestions for changes to me at [email protected], and I’ll try to incorporate them (no promises about timeliness though, because it has been extremely busy around here since starting the blog posts, with a mountain of comments and so on to read and respond to).
An Open Source Software Project?
If there is sufficient interest, the spreadsheet can be turned into an open source software project. Does anyone know if GitHub is suitable for large Excel files? Software is usually built as many small text files but we have one large non-text file, so it is not clear that version tracking and differencing will work meaningfully. Also, if we go open source there is an administrative overhead for everyone.
Please note that any results you generate using the spreadsheet are not endorsed by me, and if you make graphs other than what is obviously intended in the spreadsheet, please take the “sciencepeak.com” label off them. (Please provide links back to credit the original work, without any endorsement implied, see below.)
Journalists and data?
By the way, this spreadsheet started life as an aid for journalists. The idea was just to have all the main datasets, with instructions on how to download them, and some pretty graphs as examples—to show journalists and news producers how to get the data for themselves.
Soap box time: True authority in science comes from the data. That was the point of the Enlightenment: reason and empiricism triumphed over superstition and abuse by church and state. People learned to trust data ahead of any human authority, and science was born. Empirical data became the highest authority in physics, chemistry, and biology.
However in modern climate science the mainstream media and most politicians go to the government climate scientists as their highest authority, not to the data. Sure the climate scientists show them some data, but only their favorite data—and for a theory to be true it has to agree with all the data. With the Internet it is easy to bypass the authorities and go directly to the data itself, but the old media isn’t doing that yet. Can downloading a file of numbers, reading it into a spreadsheet, and graphing it really be too hard for the media? Come on media people, I’ll show you how.
I was preparing this spreadsheet for journalists in late 2012 when David Stockwell convinced me to look for a low pass filter in the empirical transfer function, assuming the climate was mainly driven by solar radiation (TSI). All the data was there, so I built the Fourier transforms and analysis software right into the same spreadsheet, and got distracted from the journalist project.
By the way, I couldn’t find the low pass filter we were expecting, and I twice gave up on the project because the data analysis was definitely not finding the transfer function of a low pass filter (perhaps the TSI assumption was way wrong?). Then one day, on the point of abandoning it again, I realized there was a notch instead, which was unexpected and interesting.
Sharing and using the model
- Attribution — Please give appropriate credit to Dr David Evans, provide a link to the Notch-Delay Solar Project Home Page, and indicate if changes were made, with a brief description of the nature of all changes. You may do so in any reasonable manner, but not in any way that suggests David Evans or ScienceSpeak endorses you or your use.
- ShareAlike — If you remix, transform, or build upon the material, you must distribute your contributions under the same license as the original.
- Permission –– To use any part of this work in a for-profit project, please email [email protected].
- Cite as: Evans, David M.W. “The Notch-Delay Solar Theory”, sciencespeak.com/climate-nd-solar.html, 2014.
The world needs more independent science
This large work is offered freely, and has been entirely self-funded and funded through donations to Jo Nova’s blog. There are no government grants, and no UN programs paying for analysis like this. To all those who help make it possible we are more grateful that you can imagine for assistance and contributions of all shapes and sizes.
You can help support more independent scientific research at the Paypal Tip Jar or by direct deposit or cheque.
| …… |
|
……. |
|
…….
|

Click for details |
| *Due to strange Nanny-state rules, you can’t donate freely to me, but you can buy me quantities of $1 emergency chocolate. (No. I can’t believe it works this way either.) |
Jo notes: I dislike group emails, and have not been able to thank every one personally, though I wish I could — I know most people would rather I write and research for public consumption instead. There are some direct depositors who deserve a mention: so thank you to Rodney, David M, Jules, Tom, Fay, Keith, Max, Bartels, Aaron, Phil, Fred D., W.E.B, Peter H, Peter K, Keith, Jim, Lawrie, M.J.B, Black Duck, W.B.C., Reed, I also owe one Peter C a letter in reply. Special thanks to MC, SB, BM, PF, GJ, PM, JD, DE, GB, VM, JP, TL, HC. There are too many good people to name. We’re grateful to every one of you. I still owe many emails!
Skeptics are winning, against all the odds, but there is still a lot to do, and if you’ve enjoyed the latest revelations, we’d be delighted to get your help so we can do more.
————————————————————
About Dr David Evans:
David Evans, PhD, M.S. (E.E.), M.S. (Stats) [Stanford Uni], B.Eng, M.A., B.Sc. [Syd Uni] worked with Fourier analysis and signal processing, and trained with Professor Ronald Bracewell late of Stanford University. Evans main focus is researching mathematics (Fourier analysis, calculus, the number system, multivariable polynomials, and related topics). He consulted full-time for the Australian Greenhouse Office from 1999 to 2005, and part-time for the Department of Climate Change from 2008 to 2010, and was the lead modeler in developing FullCAM, the carbon accounting model that Australia uses for the Kyoto Protocol. Evans also produces the GoldNerds excel sheets that have become the industry standard for investors in precious metals on the ASX. He is available for contract work.
UPDATE: New version 1.15 posted Wednesday 2pm Perth time, hopefully fixes “clock” compilation problems on 64-bit Excel. Should now run on 32 bit and 64 bit Excel on Windows, and on Mac. Thanks to Mark Gutzwiller, DT Christensen, and Don Jordan in the comments below for a fix.
9.5 out of 10 based on 111 ratings
Sabra Lane interviews Bernie Fraser, Chairman of the Climate Change Authority on the ABC 7:30 report. She only had time for a few questions. Shame then, to only ask one’s everyone knows the answer to.
Instead of asking Fraser how many dollars each Australian will have to spend to lower global temperatures by one degree Celsius, Sabra Lane asks him about global psychology instead: “On the Renewable Energy Target, there’s a lot of talk about the Government watering it down or getting rid of it. What impact is that having on Australia’s reputation?
What does she think the head of any “authority” dependent on the fear of a carbon-crisis for its existence was going to say? Not much — Sabra, no one overseas cares a lot about what we do?
Keep reading →
9 out of 10 based on 78 ratings
|
JoNova A science presenter, writer, speaker & former TV host; author of The Skeptic's Handbook (over 200,000 copies distributed & available in 15 languages).

Jo appreciates your support to help her keep doing what she does. This blog is funded by donations. Thanks!


 Follow Jo's Tweets
 To report "lost" comments or defamatory and offensive remarks, email the moderators at: support.jonova AT proton.me
Statistics
The nerds have the numbers on precious metals investments on the ASX
|


Recent Comments