Flagging an update (coming) to Big News Part III
Score 1 for open science review, thanks to Bernie Hutchins, an electrical engineer who diligently asked the right questions about something that bothered him regarding the notching effect. We’re grateful. This will improve the model. On the downside, it means we’re slightly less certain of the delay (darn) — the notch doesn’t guarantee a delay as we had previously thought. But there is independent evidence suggesting temperatures on Earth follow solar activity with a one cycle delay — the lag seen in studies like Archibald, Friis-Christainsen and Usoskin is still a lag.
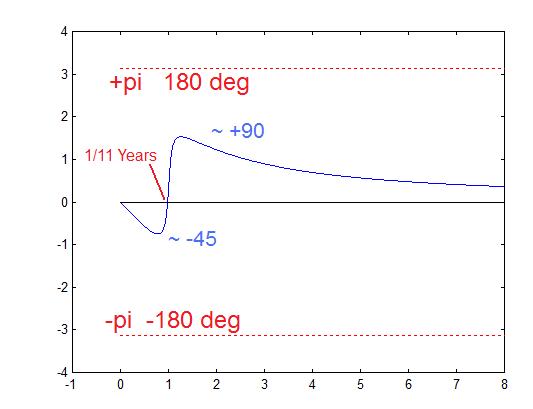
What does it mean? The step-response graph (figure 2 in Part III or figure 4 in Part IV) will change, and needs to be redone. The reason for assuming there is a delay, and building it into the model, rests now on the independent studies, and not on the notch. The new step change will need to be built into the model, and in a few weeks we’ll know how the predictions or hindcasting change. David feels reasonably sure it won’t make much difference to the broad picture, because a step-response something like figure 4, Part IV, explains global warming fairly well and will presumably arise again with the new method. But obviously it needs to be done to be certain.
The irony is that it was the FFT (Fast Fourier Transform) that produced what appeared to be a “non-causal” notch (and if it was non-causal, it would necessarily mean a delay). If David had used his slower OFT (Optimal Fourier Transform) the mistake might not have arisen, because, unlike the DFT and FFT, the OFT uses frequencies whose periods do not divide exactly into the length of the time series. In one of the those quixotic paths to understanding, the incorrect clue of a solar delay of one cycle “fitted” with the other evidence, and possibly David wouldn’t have seen the pattern if he’d used the OFT.
The previous post Big News Part III needs correcting (which is coming), and Bernie Hutchins needs a big thank you. Without his time and effort in comments, David would not have spotted the problem in the code. And it’s so much the better to know it sooner rather than later. — Jo
David Evans replies to Bernie Hutchins
That graph of the phase of your transfer function matches mine, so that pretty much seals it at your end. You appear to be analyzing the correct notch filter.
Your remark that “might have meant the DFT and not the FT” was an important clue. I had used DFT/FFT’s to get the spectrum of the step function. The DFT implicitly assumes a time series repeats to infinity — because the DFT uses only frequencies whose periods exactly divide into the length of the time series. The response I was calculating was therefore of a series of rectangular pulses, even though I was calculating the responses of a times series that was all zeros in the first half and all ones in the second half (so it looked like a step function). When I check the spectrum of what I thought was the step function, I now see that it has only the first, third, fifth etc harmonics — just like the Fourier series of a train of rectangular pulses. The amplitudes have the 1/f dependence like the spectrum of a step function, but the even-numbered harmonics are missing — but they are not missing in the spectrum of a step function.
So that finally resolves the discrepancy. My response was to a train of rectangular pulses and was incorrect. Yours was to a step function, and presumably is correct (it makes sense intuitively, but I haven’t checked it numerically yet).
Bernie, thanks for helping me find the bug, and thank you for your persistence. Well done! I am in your debt. I asked many people to check it, but you are the only one to find the problem. It is good to get this sorted out. (One other person calculated a response in Mathematica but the response seemed to come from infinity near t=0 as I recall, so something was wrong there.)
Everything else about the method worked, so my usual checks didn’t find any problems. The low pass filter and delay work just as well on a train of pulses as on a step function, so they appeared ok. Just changing the length of the time series usually exposes problems like this, because extending the time-series should not make any difference, so if it does there is a problem. In this case I had pushed it out from its usual 200 years to 20,000 years, and it made no difference. Changing the rate at which the function was sampled also made no difference. So it all seemed to check out numerically. It turns out the spectrum of a series of pulses is fundamentally different to a step function, so I was just consistently getting the wrong answer.
Odd that I didn’t spot it earlier. I am usually very aware of that particular phenomenon: I mention it specifically in the main paper, I took care when using the model to simulate temperature to use step responses and NOT work in the frequency domain so as to avoid any possibility of such a problem, and a major advantage of the OFT is that it avoids this type of problem because it uses frequencies other than those whose periods divide exactly into the length of the time series. Let my guard down here because I used an FFT for speed (the “step function” time series is 8,000 points long).
There may have been some confirmation bias at work. In the development I had already realized early on that there seemed to be a delay just from fitting TSI-driven models with notches to temperatures. So when I computed the “step response” of any simple notch filter and “found” it was non-causal, that seemed like the answer. Simple. Computing the spectrum of a general notch is difficult, and the proof was left on a long “to-do” list.
So what does this mean for the notch-delay model? Possibly not much, but there will be a delay (ahem) while I recompute things and update the model and graphs.
The causality of a notch doesn’t support the mandatory nature of the delay that I thought I had established, but there is plenty of other evidence to suggest a delay is needed. There are half a dozen independent findings of a delay around about 11 years in the literature, and a solar influence fits better with a delay (e.g. Lockwood and Froehlich 2007 — they show that solar influence doesn’t fit without a delay). Either the sun has little effect beyond the small TSI variations, and we’re left with CO2-driven climate models that don’t work and a mystery about all the warming before 1900, or there is some solar effect that appears to be delayed from TSI changes. While the notch does not *necessarily* mean a delay, certainly the *possibility* of a delay is strong. So there is sufficient reason to include a delay in the solar model — so the model remains as before, with no change. (Clarification: the form stays the same, the parameters will vary).
What has changed is the link between the model’s transfer function (fitted to the empirical transfer function) and the model’s step response (use to compute temperatures). This is broken, and I’ll have to find another way to compute the step response from the model’s transfer function, then rerun all the optimization and so on. It might take a few weeks before it’s all fully sorted out.
(By the way, finding the step response numerically from a transfer function is difficult. The DFT/FFT turns out to be unhelpful, because it uses frequencies whose periods exactly divide into the time series length. The correct method might involve numerical integration, to imitate the Fourier inversion integral directly. These MIT course notes discuss ways of doing it, solving differential equations, and notes that the general purpose method in MATLAB method fails sometimes (page 23, problem 3) – implying there is no easy method that always works. Note that we need to find the step response of not just a notch filter, but a notch combined with a low pass filter and delay in a particular configuration, for which an analytic solution is unlikely–though I’ll have a go.)
Fitting the solar model to the observed temperatures and the empirical transfer function will presumably produce broadly the same results, and again find that a step response vaguely like the one found previously fits the observed temperatures best. So I expect the theory still broadly holds.
In particular, an eleven year smoother with an eleven year delay will likely still be a crude approximation to the upcoming reparameterized model, so the marked fall in the solar radiation trend somewhere around 2004 is still likely to point to a significant temperature fall starting around 2015 – 2017. But until the results of the re-optimization are finished again there is no point in speculating further.
This is a triumph of open science, in my opinion. Many eyeballs in this case found a problem that review by several peers did not (though because it wasn’t an official peer review, expectations and standards would have been different).
On the whole, aside from the obvious benefit of now being closer to the truth, this is a good development for the notch-delay solar theory. I think people will find the hypothesis of a delay easier to accept from disparate observations and a good fit, rather than an unfamiliar mathematical argument (more of a numerical argument really, which turned out to be incorrect anyway).
Again, thank you Bernie for helping me get to the bottom of this. — David
REFERENCES:
Archibald, David, http://www.davidarchibald.info/papers/Past-and-Future-of-Climate.pdf, 2010
Archibald, David, “Solar Cycles 24 and 25 and Predicted Climate Response”, Energy and Environment, Volume 17 No. 1, 2006, pages 29–35
Friis-Christainsen, E.; Lassen, K. ,(1991) “Length of the Solar Cycle; An Indicator of Solar Activity Closely Associated with Climate”, Science, , pp. 698-700
Lockwood, Mike; Froehlich, Claus, “Recent oppositely directed trends in solar climate forcings and the global mean surface air temperature”, Proceedings of the Royal Society, 2007
Moffa-Sanchez, Paola; Born, Andreas; Hall, Ian R.; Thornalley, David J.R.; Barker, Stehe, “Solar forcing of North Atlantic surface temperature and salinity over the past millennium”, Nature Geoscience, 2014, Supplementary Information
Solheim, Jan-Erik; Stordahl, Kjell; Humlum, Ole, “The long sunspot cycle 23 predicts a significant temperature decrease in cycle 24″, Journal of Atmospheric and Solar-Terrestrial Physics, 2012
Soon, Willie W.H., “Solar Arctic-mediated Climate Variation on Multidecadel to Centennial Timescales: Empirical Evidence, Mechanistic Explanation, and Testable Consequences”, Physical Geography, 2009, pp. 144-184.
Usoskin, I. G.; Schuessler, M.; Solanki, S. K.; Mursula, K., “Solar activity over the last 1150 years: does it correlate with climate?”, Proc. The 13th Cambridge Workshop on Cool Stars, Stellar Systems and the Sun, Hamburg, pp. 19 – 22, 2004
Usokin, I. G., M. Schuessler, S. K. Solanki, and K. Mursula 2005, Solar activity, cosmic rays, and the Earth’s temperature: A millennium-scale comparison, Journal of Geophysical Research, 110, A10102.