
By Jo Nova
It’s just another day in the hottest ever hyperbole race. The most unprecedentedly unprecedented record where more scientists on Earth than ever before, forget more of the Pleistocene than they ever have in history.
We know it was hotter in the Holocene, hotter in the Eemian, and hotter for most of the last 200 million years, but we have 130 years of thermometer records so it’s time to get hysterical. Just because the seas were 1 – 2 meters higher, or nine meters higher, it’s nothing…
Here’s how 2023 became the hottest year on record
By Carolym Granling and Nikk Ogasa, Science News
This year didn’t just shatter records. It changed the scales.
Graph after graph tracking this year’s soaring global temperatures reveal that not only were the numbers higher than ever recorded in many places around the world, but the deviation from the norm was also astonishingly large.
Michael Mann says it’s the fastest rate of warming for millions of years. Naturally, no science journalist thinks to ask him how he could possibly know this?
What’s especially concerning, experts say, is that “the rate of warming over the past century has no precedent as far back as we are able to look, not only hundreds or thousands, but many millions of years,” according to University of Pennsylvania meteorologist Michael Mann’s book “Our Fragile Moment.”
Think about how impossibly hard it is to know how much the world warmed from say 3,450,000 BC to 3,449,900? I mean in the last 10 million years there are 100,000 whole centuries. How many samples do we need each century from around the world to estimate what the “global” rate of warming was in every single century? If we just have three samples from the year 2 million BC, could we really say we knew what the temperature was?
Here (below) is one estimate of temperatures for the last 50,000 centuries. It’s a wild ride. Really, truly, could anyone say there wasn’t one century that warmed faster than our last one?
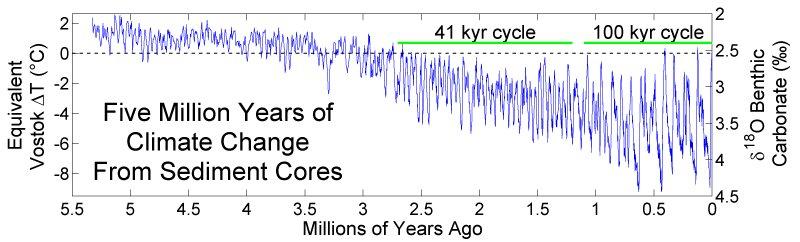
Graph based on work by Lisiecki and Raymo in 2005. Image created by Robert A. Rohde / Global Warming Art
Has Michael Mann found an unknown trove of temperature records from Australopithecus onward, or was it just a moment of mad arrogance fueled by 30 years of propaganda?
See also my last post on this:
- Hottest in 125,000 years say EU scientists — as if Cavemen could measure the temperature to a tenth of a degree
h/t to Marc Morano (Climate Depot)
REFERENCE
L. E. Lisiecki and M. E. Raymo (2005) — A Pliocene-Pleistocene stack of 57 globally distributed benthic δ18O records, Paleoceanography 20, 1003


2024 will be the year of scary stories, both covid and “climate change” and a US Presidential election which will be centred around these scares and that the Left will do absolutely anything to “win”.
551
Still waiting for the El Nino?
A Solar Maximum occurs and it gets hotter in some places. This is then applied to the entire planet’s average temperature over tens of thousands of centuries and somehow related to GHGs. Who’d have thought?
Cross their palms with silver and they will say anything is true.
231
Ever heard of the Climate Reference Network in the US? It’s 150 weather stations that are in rural areas. I see one of them here in Montana all the time. It’s in the Glacier National Park/Blackfeet Indian Reservation area east of the Continental Divide. I am there every weekend from April to October doing wildlife photography of brown and black bears, wolverines, wolves and mountain lions, etc.
Anyway for twenty years there has been no change in temperature. I wonder why?
See for yourselves.
wattsupwiththat.com/u-s-surface-temperature/
270
Good link. What caught my eye is a statement on the site which I’ve paraphrased:
“The data comes from the network which is properly sited (away from human influences and infrastructure)”. Sounds better than down here where our bureau can place thermometers next to airport tarmac or incinerators
190
When weather stations were set up there was no expectation that decades or even centuries down the line the data would be used to create a ‘global average temperature’ and to prove a false claim that this temperature was increasing. Even more so with the beloved airport temperature readings the vast majority of which did not exist prior to the Second World War, have changed beyond all recognition in size and aircraft numbers, and experienced a complete change in aircraft type using them. Sadly aviation needs to know the weather conditions for safety reasons so even the small grass field aerodromes have weather stations.
30
Jon R. One more time…..
The climate hysterics have a mental (and greed) problem…Monomania basically…..which is the pathological obsession with the weather as a means of making money for themselves. Classic case is Al Gore: one trick pony who’s landed billions from that one trick and just keeps going…but all the hangers-on are of the same demented ilk.
OK so we know this, and in days gone by maybe they’d be in asylums someplace etc, but these days all manner of crazies are allowed to walk among us. Even wanted- murderers and known terrorists. The climate-mad are but one more set. Do not become a monomaniac obsessed with them!
BTW: Up here in balmy FNQld it’s roasting (every day mid-high 30s). It’s humid with no indication there’ll be any change soon. Yet, every motel, hotel, holiday apartment, camp-ground, cabin, caravan park is packed with visitors from down south who could be relaxing in much cooler climes…Sydney yesterday max 24.8, Melb 20.4 (FFS!) etc etc but who are NOT.
Please JoNova readers: Do not swallow the line pushed by the mentally ill that the citizenry are afraid of heat. They love it, and are migrating to Qld by the millions.
You’re all being played as suckers, so pay THEM no attention whatsoever! I do not go out to discuss obsessions with my dogs each time they bark, so why would you care what barking mad fake-scientists and scammers have to say?
41
There was probably a 10 degree change today. Maybe 40° C over the whole year. It’s extraordinary that the average of all can show a trend of less than a degree per century when changes in weather patterns, rather than global climate, can cause a bigger trend over a decade.
40
The US 48 states is only 1.5% of Earth’s total surface area, similar to Australia.
Climate in 1.5% does not have to match the global average.
In fact, USCRN has been in a rising trend since 2005, mainly before 2011.
NOAA has the NClimDiv network used for the global average temperature … that WUWT in the US claims has 96% improperly sited weather stations.
NOAA also has the much smaller USCRN network claimed to be 100% properly sited, rural, automated weather stations that require no adjustments.
Mysteriously, both networks have almost identical US average temperatures.
In my opinion, that could have only two explanations:
(1) Land weather station siting does not matter … which is very unlikely, or
(2) NOAA has their hands on the scale:
That means NClimDiv is adjusted, or USCRN is adjusted, or both are adjusted to better match each other.
I can not trust NOAAs NClimDiv with 96% improperly sited weather stations. The first 2009 WUWT survey showed a lot of improper siting. NOAA fixed nothing — they allowed the siting problems to get worse in the next decade.
I do not trust NOAA, so I do not accept their claims that USCRN is accurate.
The integrity of the people collecting data is just important as the data.
Here in SE Michigan USA, our winters are significantly warmer with much less snow than in the 1970s. We call that Michigan warming and we love it.
Warmer is good
Colder is bad
More CO2 is great for plants.
Do not trust government bureaucrat climate scientists, or any other leftists — truth is not a leftist value.
52
I “served” 20 Detroit area winters. I dreaded October-March with the biting cold, howling winds, dark skies, sleet, snow, ice, slush. I left 44 years ago for California which has sadly become infected with its own “political climate change” into lunacy (central CA is reality-based, it’s SAC, SF, LA that ruin it).
10
Despite obvious colder temperatures in many places, they still maintain the fake claim of “fastest eeevvveeerrr” warming. They know that no one in the Lamestream media or professional scientists who want to keep their jobs, or scientific organisations will question it.
421
David. Already covered this a hundred times. I see no indication that the average citizen believes ACC to be a real thing, nor to be worried about this not-real thing…..
Fossil-fueled vehicle sales are BOOMING. Fossil-fueled planes, buses, trains and ships are taking billions world-wide to exotic climes…ESPECIALLY those with heat. Aussies are NOT flocking to Antarctica..are they (see Qld and Northern NSW for where they ARE going), David?
Facts are that the climate scammers are making dough off the feeble-minded in the same way Nigerian Princes, ab-blaster salesmen, Air-Fryer Chefs, Kitchenware spruikers etc are making a killing from the none-too-bright.
It was 20.8 degrees max in Melbourne yesterday. What person with an IQ higher than their shoe-size thinks THAT’S hot? Most southern-slickers are up here in Qld demanding to be boiled alive!
51
The real thing under attack is science and the scientific method itself as part of the general war against truth and the promotion of post-modernism which does not believe in objective reality.
Hence, not being allowed to ask questions about this. Anyone who does is sacked/fired if in employment or canceled, ridiculed or unpersonned otherwise.
512
David, Hatetruth must be stopped.
252
David/Honk,
100 thumbs up from me . Nailed it.
181
They know they’re wrong and have been since Hansen’s loony yap fest in 1988 and Gore’s BS and fraud etc.
They were answered decades ago by the scientists who carefully told us the truth in “The Great Global Warming Swindle”, but they want the OECD countries to further WASTE more precious time and TRILLIONS of $ for SFA and for another 35 years.
Of course China, India and the NON OECD have used their brains and embraced RELIABLE BASE-LOAD energy like coal, gas, nuclear etc that will last for 70 years.
So why are they so bright and why are we so DUMB?
362
Here’s the GGW Swindle and it holds up very well and I doubt those genuine Scientists would change much today.
https://www.youtube.com/watch?v=BY-gRFSaP7o
181
Forget fake government statistics about the standard of living. Real observations suggest that the standard of living in Western countries is decreasing for non-Elites and has been for years now, as is the plan, as trillions of dollars is siphoned away from ordinary people via taxes to pay subsidies or via electricity bills or other increased costs.
And where have these trillions gone that have been wasted and siphoned off in this scam? They haven’t disappeared. They have gone into the pockets of the Elites behind the scam, the biggest fraud in history
301
They are pushing the hot temperature story hard because many of their weather/climate old stories are utter failures which is why they have become a one note concern while many other weather metrics doesn’t support their climate cult concerns thus go silent.
Fact: No Lower Troposphere Hot Spot exists.
Fact: No Positive Feedback Loop exists.
Fact: The AGW conjecture died years ago due to many prediction failures.
All we have left are climate cultists desperately supporting a vile scam which means they are anti science as they support the way of politics pushing that scam.
361
Even if anthropogenic global warming were real and not the biggest scam in history, what is the point in destroying Western economies to “stop CO2” (what they call “carbon” (sic))?
China has twice the CO2 emissions of the next biggest emitter the United States and China’s emissions are rapidly rising. And India is on the ascendancy as well. Europe and the US’ emissions have been static or falling for decades.
Stupid countries like Australia are destroying their power stations while China builds two coal power stations PER WEEK.
Climate alarmists must know about the scam and be part of it.
Why do I think that and not just that they are useful idiots (well, some of them are but their leaders are not)? Because they also keep telling us that wind power is the cheapest and most reliable form of electricity generation (an obvious lie). If that were true, why would China be building power stations instead of windmills?
Why are alarmists silent about China’s unlimited CO2 emissions? Answer: Because the climate alarmist leadership is hugely profiting from the fraud.
See CO2 emissions graph at:
https://commons.m.wikimedia.org/wiki/File:World_fossil_carbon_dioxide_emissions_six_top_countries_and_confederations.png
291
David they should admit that the USA + EU co2 emissions per year are lower today than they were 52 years ago ( 1970 to 2021) and 54 years if updated to the end of 2023.
Your linked graph shows this very clearly and yet China + other countries’ emissions have soared for decades.
If China can build hundreds of new COAL stations, then Australia should be able to build at least a few new RELIABLE BASE-LOAD COAL or GAS stns ASAP.
And we can also save our environment in the sea and on the land. IOW a very happy WIN, WIN for everyone.
171
Here in the UK they have been trumpeting that today but it was then revealed that our reduction was mainly due to our importing stuff from china instead of making it ourselves. Overall co2 levels of the countries you mention are due to our loss of manufacture and importing stuff.
This is why carbon border taxes are due to start coming in this year.
141
The globalist Australian Government has a policy of copying the very worst policies of other woke countries so no doubt we’ll soon see that here.
It looks like Brexit (in the flawed way it was implemented) didn’t do much for UK independence or rational thinking huh?
151
There should be a special tax on Chinese made solar panels and wind turbines made using coal
90
The best way to deal with changing climates is with a strong wealthy economy. The Earth’s climates have been changing for billions of years and the real global warming will occur in about five billion years when the Sun goes red giant.
20
AGAIN here’s Willis Eschenbach’s “Where’s the Emergency” post from WUWT and he’s updating all the time.
His last update was 29th DEC 2023.
https://wattsupwiththat.com/2021/04/25/wheres-the-emergency/
He challenged the Dessler fool with this data but Dessler refused to engage him, but he did threaten to have Willis banned from his site.
Willis laughed and said Dessler was pathetic. Dr Koonin won his debate against Dessler and he also had to apologise to Koonin for his teams gutless framing of Steve in an earlier exchange.
221
The U.S. Weather Service has, for a site 50 miles south of me (Yakima), a plot of weather readings to be found at the link below.
For December, 3 days were well above average. Only the 5th equaled the record high. Unfortunately the chart doesn’t say when that was.
Five miles away from me (Ellensburg) was never close to a record.
https://www.weather.gov/pdt/CliPlot
The concept of “global warming” fails the global part.
121
Is the Yakima station the one at the airport, where one might expect lots of jet traffic with exhausts blowing onto the station in December, giving record high readings?
https://forecast.weather.gov/MapClick.php?lat=46.6045&lon=-120.5072
101
Yakima is a small place, but did have an international flight get diverted to there last month. Caused an issue because passport and security are not normally available.
You can have a look, here:
Lat/Long: 46.56398, -120.53488
Airport Operational Statistics (2022)
Aircraft based on the field: 133
Single engine airplanes: 106
Multi engine airplanes: 15
Jet airplanes: 5
Helicopters: 6
Gliders airplanes: 1
Aircraft operations: avg 97/day *
48% transient general aviation
32% local general aviation
10% military
7% air taxi
3% commercial
* for 12-month period ending 31 December 2022
71
The Urban heat island effect has corrupted many long established tempature measuring stations.
“Urban heat islands” occur when cities replace natural land cover with dense concentrations of pavement, buildings, and other surfaces that absorb and retain heat.
81
The chart displaying the 41kYr and 100kYr positioned over the time periods gives the wrong impression of what actually occurs.
The sea level reconstruction gives a much clearer picture of how the shorter precession cycle dominates these changes. This is the reason why interglacials last around 15kYr.
The transition to deeper cycles 2.5Ma followed the uplifting of the Panama isthmus. This closed the tropical interconnection between the Pacific and Atlantic so the oceans across the equatorial zone were no longer linked.
Earth recovers from a glacial episode when the land ice makes its way to ocean level in sufficient quantity to create large icebergs that eventually cool the ocean surface and slow dow ocean to land advection. The current cycles are not 100kYr. They are multiples of the precession cycle:
https://1drv.ms/i/s!Aq1iAj8Yo7jNhHVBY-1Ocs-HRzaV?e=O2ELIJ
The changing solar intensity due to the precession cycle is modulated by the Obliquity and Eccentricity cycles. The Fourier analysis of the reconstructed sea level has a sharp peak at 23.3kYrs.
140
‘Common symptoms that could signal heat-related illness are dizziness, nausea, vomiting, headache and lethargy’. Coincidentally, these very same symptoms affect climate realists when listening to the tired diatribes from climate bedwetters.
150
Those symptoms are also similar to Twiggy Forrest’s “lethal humidity” scary story.
Back in the day this was called “heat exhaustion”, the most extreme form being “heat stroke”.
Rates of heat stroke do appear to be increasing, despite no genuine significant increase in temperature. I am guessing this is because a) people no longer have what used to be called common sense or knowledge about sun exposure and b) people, including children, spend most of their time indoors in an air conditioned environment and are not acclimatised to being outdoors.
In contrast, in my bushwalking (hiking) club, compromised of people who regularly go outdoors, I have never seen a case of heat exhaustion, let alone heat stroke, except once during a genuine heat wave people were stuck out in an area without tree shelter on a long hike at Wilson’s Promontory (southern Australia) when several people succumbed to heat exhaustion but quickly recovered and walked out.
81
* comprised, not compromised…
50
I gave up bushwalking when I caught in a gale in the Victorian Alps
No fun at alll!
70
Actually, when one is not accustomed to hot weather, one loses a lot of salt in sweat. The symptoms can be treated with a dose of salt and water. Metabolic adjustment to heat leads to much lower salt loss.
20
Great comment
Symptoms of a leftism overdose are alternating bouts of nausea and laughter
40
Unfortunately, people believe what the Seat of Authority tells them and do no research of their own at all. Global Warming is neither Global nor Warming in any scientific sense.
81
True, the hemispheres are usually out of sync.
Australia didn’t experience a Medieval Warm Period. while the Little Ice Age was universal, albeit slightly out of sync.
https://www.antarctica.gov.au/magazine/issue-26-june-2014/science/historical-temperature-reconstructions-show-hemispheric-differences/
The invention of a one world temperature is seriously flawed.
61
“The invention of a one world temperature is seriously flawed.”
Short, concise synopsis of the entire issue.
The anthropogenic origin of the fallacy of anthropogenic warming.
Ever notice nobody offers up what the ‘right’ One World Temp should be?*
2024 and The Age of Science has led us to this state of Gobbledygook.
And the winner is … Carl Jung.
*(‘Healthy’ global temp may have a correlation to ‘healthy’ cholesterol levels.)
42
Sorry Honk, scrolling accidental red.
20
The perfect climate was at 3:06pm on June 5, 1850.
Any change in either direction is a climate emergency, catastrophe,
disaster.
holocaust, OR EVEN WORSE …
that will kill your dog
50
Oh, June 5 1850 … the day before the Germans bombed Pearl Harbor.
Coincidence?
I don’t think so.
40
“Australia didn’t experience a Medieval Warm Period”
Really?
Surprise, Surprise … Mediæval Warm Period turns up in Antarctica!
http://joannenova.com.au/2019/07/antarctica-was-warmer-one-thousand-years-ago-and-life-was-ok/
… and New Zealand
Temperatures were inferred from δ18O data obtained from four stalagmites found in caves at Waitomo (38.3°S, 175.1°E) on New Zealand’s North Island for which 19 TIMS uranium series ages were measured.
The Medieval Warm Period occurred between AD 1100 and 1400 and was warmer than the Current Warm Period.
http://www.co2science.org/data/mwp/images/l2_waitomo2.gif
20
When a man known to have some scientific and statistical education and experience makes such a statement, it becomes blatantly obvious that he is knowingly lying and simply intent on creating a false dialogue.
200
Well, i don’t know about stats as far as Mann is concerned. Much of the problem with the hockey stick graph comes from really bad stats, as well as outright chicanery. I will need to do some more reading, but apparently there have been 25 Dansgaard–Oeschger events which lead to between 5 and 8 degrees c warming in as little as 40 years, much faster than today’s mild warming. These increases are followed by long, slow cooling over hundreds of years. 2023 is definitely an outlier as far as temperatures and weather events and cannot be considered as part of any long term trend. Much of this years “weather” can probably be attributed to the Hunga – Tonga volcano dumping millions of tonnes of water vapour in to the atmosphere. According to some estimates, it may take up to 10 years for the water vapour content of the upper atmosphere to return to “normal”. Just as an aside – von Hann, 1908 paper, as verified by Kramm et al from University of Fairbanks, Alaska in 2019, average global surface temperatures were 14.4 c. Temperature.Global average for 2023 was 14.44 c. Data sources for Temperature.Global are: NOAA Global METARs, NOAA One-Minute Observations (OMOs), NBDC Global Buoy Reports, MADIS Mesonet Data. As of 11.35 am New Zealand time today, Temperature.Global average temperature was 14.44 c assessed from data collected from 62,975 weather stations over the last hour, last station processed was Karup, Denmark. So, that would mean no warming at all for over a century. Mmmmmm.
90
“2023 is definitely an outlier as far as temperatures and weather events and cannot be considered as part of any long term trend. Much of this years “weather” can probably be attributed to the Hunga – Tonga volcano”
2023 is a continuation of a 1975 warming trend and thewarmest year in that rising trend. The last six months of 2023 was the warmest six months in the instrument record and possibly the warmest six months in 5,000 years.
The Tonga volcano has had no observed effect on the global average temperature in 2022 and certainly no effect in 2023. Volcano Nuts make a lot of claims about volcanoes causing global warming with zero data to prove their claims.
03
The LIA finished around 1850 and the temps have been warming from then. Between 1910 and 1940 there was a large spike in temps (which, BTW, has been adjusted down over the years) until a cooling period between 1950 and 1975 (another ice age coming?). Temps rose again until around 2005 when they was a slight plateauing of temps which worried some scientists (see the released emails around 2009 for confirmation of this). Then adjustments began to show more warmer by reducing temps prior to the 1950s which resulted in world temps seemingly increasing rapidly.
For instance, here’s Darwin’s temp data before the adjustments.
https://data.giss.nasa.gov/cgi-bin/gistemp/show_station.cgi?id=501941200004&dt=1&ds=1
Here it is after the 2011 adjustments.
https://data.giss.nasa.gov/cgi-bin/gistemp/stdata_show_v4.cgi?id=ASN00014015&ds=14&dt=1
You can still see the unadjusted data in a light colour in the background.
30
LOL
What is a woman?
What is average global temperature?
110
Add to the list…
Can a black person be a racist?
And just to be nasty because I don’t know of many.
Can a conservative be a member of the Liberal Party?
80
How were Australlia’s “First Nation Peoples”?
51
Power.
ALL of this is about POWER.
Not just the stuff that falls out of the outlets in your house, but ABSOLUTE power over the Untermenschen.
As they say in the classics:
“Power corrupts”;
Absolute power corrupts ABSOLUTELY”
And the degenerate psychotics are openly after ABSOLUTE POWER.
As per this extract from , “Atlas Shrugged”:
““Did you really think we want those laws observed?” said Dr. Ferris. “We want them to be broken. You’d better get it straight that it’s not a bunch of boy scouts you’re up against… We’re after power and we mean it… There’s no way to rule innocent men. The only power any government has is the power to crack down on criminals. Well, when there aren’t enough criminals one makes them. One declares so many things to be a crime that it becomes impossible for men to live without breaking laws. Who wants a nation of law-abiding citizens? What’s there in that for anyone? But just pass the kind of laws that can neither be observed nor enforced or objectively interpreted – and you create a nation of law-breakers – and then you cash in on guilt. Now that’s the system, Mr. Reardon, that’s the game, and once you understand it, you’ll be much easier to deal with.”
130
Those symptoms are also similar to Twiggy Forrest’s “lethal humidity” scary story.
Back in the day this was called “heat exhaustion”, the most extreme form being “heat stroke”.
Rates of heat stroke do appear to be increasing, despite no genuine significant increase in temperature. I am guessing this is because a) people no longer have what used to be called common sense or knowledge about sun exposure and b) people, including children, spend most of their time indoors in an air conditioned environment and are not acclimatised to being outdoors.
In contrast, in my bushwalking (hiking) club, compromised of people who regularly go outdoors, I have never seen a case of heat exhaustion, let alone heat stroke, except once during a genuine heat wave people were stuck out in an area without tree shelter on a long hike at Wilson’s Promontory (southern Australia) when several people succumbed to heat exhaustion but quickly recovered and walked out.
10
As mentioned last year – OK it was just a few days ago – our official record hot day was back in 1973 (42.4C) almost 51 years ago and still yet to be beaten, despite ‘meteorologist’ Mannequin’s ongoing shenanigans and Guterres’ wet pants.
Looking at the charts, there’s no exceptional heat occurring in the Land of Oz nextdoor to us: apart from typical mid-40s outback, coastal temps appear to be cooler than usual and wetter than average – a sea breeze will do that, even though ‘professors’ playing computer games point at their screens shouting BURNING EL NIÑO MAN!
Are your dams full to overflowing yet?
110
Lake Eildon, near us, is too full at 98%
70
You Kiwis call 42C “Hot”?
The highest temperature recorded in Victoria was 50.7oC recorded in January 1906 at Mildura.
The highest temperature ever recorded in Australia is 50.7 °C (123.3 °F), which was recorded on 2 January 1960 at Oodnadatta, South Australia, and 13 January 2022 at Onslow, Western Australia (as well as Mildura).
The highest temperature recorded in California, 134 degrees F (56.7°C), is also the current hottest air temperature on record on Earth and was measured in Death Valley, California, on July 10, 1913.
60
Well, not according to the Australian temperature records I have seen.
Bourke New South Wales – 52.8 c 17/1/1877
Cloncurry Queensland – 53.1 c 16/1/1889
But the BOM is determined to wipe all records prior to 1940 because they are inconvenient for modern global warming.
91
Mildura recorded 123 on Saturday and 124 F on the Sunday. 123.5 F is 50.8°C. Somehow, BOM managed to turn 124 F into 50.7 °C and 123 F into 50.1 rather than 50.3.
I know that it was in the shade but not a Stevenson Screen. It’s still 4 degrees higher than the record at the AP of 46.9°C set in 1990.
But it does highlight how much politics influences the data.
40
Further to the comments on this topic.
It appears that Mildura’s temp was taken on a Glaisher Stand. This allowed the BoM to reduce the temp to below 50C.
https://ams.confex.com/ams/90annual/techprogram/paper_155748.htm
OK. Now Onslow had a 50.7C recently to match Oodnadatta’s 50.7C on a SS in 1960. Onslow is on the coast and near Marble Bar yet on that day, MB did not reach 50C. Also Onslow’s temp was taken by an ethermometer which has a one-second response time. So if they can adjust Mildura because of a different measuring standard, why haven’t they done the same with Onslow. They have the data comparing SS with the ethermometer but won’t release it. Mmmm!
TD, here’s Bourke temp for 1877.
http://www.bom.gov.au/jsp/ncc/cdio/weatherData/av?p_display_type=dailyDataFile&p_nccObsCode=122&p_stn_num=048013&p_c=-461043039&p_startYear=1877
One way to get rid of the evidence.
And Cloncurry shows no daily data on the BoM site. However, a book published by the BoM in 1995 (‘The Wonders of the Weather’ – Bob Crowder) states that Aus highest temp was 53.1C at Cloncurry on 16 Jan, 1889. In the forward it claims that these temps have been ‘checked and verified’. Apparently the thermometer was placed in a beer crate in the shade which the BoM advised sites to use before SSs were rolled out. So it may not have been 53C that day but it would still have been +50C.
The BoM needs to ‘fess up on the differences between LIG thermometers and ethermometers – if they can do it for GS v SS, then we need to know what they won’t reveal.
40
Some certainly are:
Leslie Harrison 115.8% 12:02pm 02/01/2024 Dam is spilling
Little Nerang 103.4% 11:49am 02/01/2024 Dam is spilling
Maroon 96.1% 12:00pm 02/01/2024
Moogerah 81.8% 12:00pm 02/01/2024
Nindooinbah 103.8% 12:00pm 02/01/2024 Dam is spilling
https://www.seqwater.com.au/dam-levels
50
So why did Mann and other so called Scientists use data for years that was turned UPSIDE DOWN?
He was told repeatedly for years that he was wrong and yet the Tiljander data was also used in other , later studies as well?
All this idiocy passed peer review BTW and the original scientists who were telling him he was wrong were ignored.
Is this donkey the type of fool that we should follow by WASTING TRILLIONS of $ because other clueless donkeys were also stupid enough to believe him?
McIntyre and McKitrick etc tried to highlight this Zombie science for years and the Finnish scientists were very unhappy as well.
https://wattsupwiththat.com/2011/06/22/manns-inverted-tiljander-data-survives-another-round-of-peer-review/
91
Wood you trust that Mann?
I don’t think I wood.
His wood is knot good.
90
It is too knotted.
60
We’ve got our own homegrown idiot here who said it would never rain again and if it did it wouldn’t fill a dam.
80
Mann’s Hockey Stick was totally pulled apart by McIntyre and McKitrick. Mann was very selective with which tree rings he used. When he suddenly realised that the tree ring data was showing a cooling from 1960, he stuck the temperature record on to the graph without revealing what he had done (thus using two proxies which invalidates the whole process). Hence the expression, ‘hiding the decline’ and ‘Mike’s nature trick’.
30
Mildura 2023 XMAS day was the coolest on record at 17.9 c and was lower than the 1972 Xmas day at 18.5 c.
Both were recorded at the airport but a lot more buildings, concrete, bitumen , jets etc + UHI warming today than the old airport 51 years ago.
Certainly a lot of people were wearing jumpers and didn’t like it a bit.
60
Why didn’t Mildura’s “coolest eeevvuuurrr” Christmas Day make the headlines? It certainly would have if it was the “hottest eeevvuuurrr”.
Actually, by the time the BoM have applies their secret and irreproducible (and hence not scientific) process of “homogenisation”, it may well turn out to be the “hottest eeevvuuurrr”.
140
David our local very lefty rag did tell us in a very small column, but I didn’t hear or see elsewhere and certainly not on their ABC.
But you’re correct it would’ve been yapped about if it was the HOTTEST EVAH and all due to their terrible CC.
41
And Russia, China, Korea and Japan are all very cold and wishing there will be GLOBAL WARMING© soon.
90
Has Michael Mann found an unknown trove of temperature records from Australopithecus onward, or was it just a moment of mad arrogance fueled by 30 years of propaganda?
No, he found a teleconnected Bristlecone pine 😀 I swear it ! 😀
101
Honestly, it’s all complete bollox isn’t it ?
Climate, like western democracy and certain other illnesses, I have to say IMO the people who push this nonsense are either liars or certifiable idiots
90
If hyperbole doesn’t work, use bigger hyperbole.
40
Is that pronounced “hy-per-bowl” (ref Gillard 2012) or “hy-per-boll-ee” (ref my English teacher 1965)?
10
“If you tell a big enough lie and tell it frequently enough, it will be believed.”
-Walter Langer (Psychoanalyst)
40
Go outside now and tell me if you feel warm or can light a fire.
20
Come on Baby Light my Fire –
https://www.youtube.com/watch?v=cq8k-ZbsXDI
50
Near the southern Australian coast at a very damp 18 degC I would suspect that I would not feel especially warm outside. As for lighting a fire outside, apparently there are no possibilities of doing that leagally, since p[en fires are banned by legislation during the summer months. Whether the ground is damp or dry makes no difference in a court of law.
OK a bit further north the local citizens may be experiencing an Australian summer weather pattern…. But did not someone imply that we live in a big country?
30
Real-time Global Temperature 14.4C – wow, we’re boiling:-(
60
Hey, Blackout Bowen, how is that Energy Plan going? And how is that ALP Modelling going?. Going, going, GONE. Just like the Climate Alarmist Modelling.
How about Nuclear Energy you fraud.
https://twitter.com/i/status/1741672841429549523
60
Bowen is the living caricature of a simpleton.
100
Australian rainfall was just a little above the average for 2023.
But Jo’s corner of SW Australia was well below average and so was NSW, Vic and SA and Southern Australia.
And the rest of WA was also below average, but NT was above average and all of Northern Australia was above average and also above for QLD. Tassie was below average and also SE OZ, MDB.
Eastern OZ was right on the average.
Check it out.
http://www.bom.gov.au/cgi-bin/climate/change/timeseries.cgi?graph=rranom&area=aus&season=0112&ave_yr=0&ave_period=6190
41
Adelaide and much of southern SA had above average rainfall for 2023. Just back from 10 days on Yorke Peninsula – end of December and still tinges of green everywhere. Most unusual for this place at this time.
30
Canberra and the ACT claims to run on unreliables which is just a fraudulent accounting trick.
They should be forced to run on unreliables for real, plus Parliament House should have its emergency generators disconnected.
112
Why?
See if you can write one cheerful thing in 2024.
313
I’ll take the challenge, let me think.
30
O.K.
Happy New Year.
30
HNY. You are not a miserable left obsessed so and so.
11
True, but I did notice that your leaf motif leans to the left as I see it.
From your perspective it’s to your right; so confusing.
10
Because who wants to know the truth, when the new science is all about the vibe, right?
40
The accounting “trick” (fraudulent???), otherwise known as locking in renewable futures, has gives us cheaper electricity.
05
two words. King Island
100
So, I just heard a meteorologist asked by a reporter, why there’s so much rain if we’re supposed to be in an El Niño phase. The response was that El Niño is not responsible for weather – “It’s a climate driver”. I found this interesting on two points:
1. What? CO2 is not the sole driver of climate?
2. Climate drivers are not responsible for weather? You mean every ‘hottest day’ is not because of climate change?
The narrative is quickly unraveling.
100
🙂
Verbalism at its finest.
10
BTW here’s a very short video of Mawson in Commonwealth bay Antarctica in JAN 1912 and the bay is ice free, unlike when the ship of fools were locked in ice about 10 years ago.
This is the video that the Bolter linked to then and he certainly annoyed the bedwetters at the time.
https://www.youtube.com/watch?v=k-9yJ6-6aEs
60
Your chart doesn’t appear to be published literature, but the author notes:
Vostok temperatures have risen by over a degree since 1950. A single site is not appropriate but Vostok is consistent with Mann’s claim that this is the fastest rate of warming for millions of years.
321
Sorry but Mann’s claim is bogus as are most of his claims. As previously mentioned, during Dansgaard–Oeschger events, global temperatures rose by 5 to 8 degrees c in as little as 40 years. Be very careful when you quote Mann, especially after what he did to Tim Ball. He is an odious little weasel with no credibility except amongst the climate mafia. I respect and listen to most “climate scientists” even if I disagreed with them, as open and honest discussion is always an adult way to conduct yourself and a way to learn. But there is no place for Mann in any adult and balanced discussion on climate, especially given his pension for litigation against anyone who disagrees with him. What it must be like to have such a fragile ego and be so insecure about the crap you are spouting. You can mention any climate scientist you like, but you damage any credibility you may have as soon as you mention Mann.
150
Mann is actually highly respected and it quick to critique those who over-emphasises the danger. His willingness to take people to court shows principle, not a lack of it.
115
Sorry Simon,
Mann is only respected by the others in the climate mafia. He took Tim Ball to court in Canada. Whilst the University of Pennsylvanian paid Mann’s court expenses, Tim Ball had to pay all his own costs. Mann dragged out the case for 7 years. Ball’s defense team asked Mann for the data that produced the hockey stick graph and Mann’s team refused. They basically said why should we provide you with the raw data when you will only use it to prove us wrong. In the end Ball won and Mann’s case against him was dismissed. Mann was ordered to pay Tim Ball’s cost and damages. Tim Ball died in 2022 and Mann had not paid him a single cent. Because the case had bankrupted him, Tim Ball’s family had to raise money for his funeral expenses from a give a little page. That really tells you what sort of man Michael Mann is. A man of principle? Really??? You certainly have some strange definition of principled.
80
Simon’s ‘principles’ can be seen from his two posts above. He supports Mann’s claims about warming based on a single ‘local’ site yet then implies Trcky’s repudiation is invalid because it is based on ‘local’ temperatures.
60
The actual events around the case are here:
https://climatecasechart.com/non-us-case/michael-mann-v-timothy-tim-ball-the-frontier-centre-for-public-policy-inc-and-john-doe/
The lesson is clear, don’t go around defaming climate scientists and accusing them of fraud without actual evidence.
17
“The lesson is clear, don’t go around defaming climate scientists and accusing them of fraud without actual evidence”
Would be nice if climate nutters like Mann provided actual evidence of man-made ‘climate change’ or ‘global warming’…
20
Simon, you seem to have a penchant for ignoring the truth and then doubling down.
10
Fair dinkum, Simon. How can one respect Mann when he added a second proxy (ie, temp data) to his Hockey Stick graph when the tree ring data showed a decline in temp from 1960 AND DIDN’T MENTION THAT HE HAD DONE THAT. Hence, the expression, ‘hiding the decline’. If it wasn’t for McIntyre and McKitrick investigation, no one would have noticed. Check what he said in 1980s and see if any of his predictions have eventuated.
20
Hi Simon,
Wrong!!! According to the encyclopedia Britannica: Dansgaard-Oeschger event, any of several dramatic but fleeting GLOBAL climatic swings characterized by a period of abrupt warming followed by a period of slow cooling
According to NOAA D-O events had a GLOBAL footprint.
As far as Mann is concerned the lesson is clear, don’t go around defaming climate scientists and accusing them of fraud when they will deliberately set about making you bankrupt without mounting any defense and then not pay a cent of the awarded expenses to the defendant. Very principled indeed
20
Not millions of years, that is hyperbole.
‘Several long ice-core records have been collected in Antarctica, with the longest continuous one about 800,000 years, and older ice found in other places but disturbed by ice-flow processes so that a complete, continuous record beyond 800,000 years is not yet available from ice cores. Other sedimentary records go much further back in time, but don’t trap bubbles of old air, so estimates of older atmospheric concentrations rely on indirect indicators and are slightly less certain.’ (Penn State)
70
Jo’s chart is based upon oxygen isotope concentrations from sediment stacks. The data seems to confirm Mann’s assertion.
213
Okay, ocean and lake sediment are acceptable proxy.
Closer to our own time, the Younger Dryas signal was picked up on the Tibetan Plateau using lake sediment.
https://agupubs.onlinelibrary.wiley.com/doi/10.1029/2018GL080225
30
On face value the Eemian Interglacial was warmer.
https://commons.wikimedia.org/wiki/File:Vostok-ice-core-petit.png
‘ … fastest rate of warming …’
Clever trick, totally unfalsifiable over eons of time.
61
Simon,
One degree that means it will now be -65C when it was -66C I am terrified!!!
HAW HAW HAW,
what YOU don’t seem to realize is that when there is an increase of warm air going to the poles that is a sign of a coming cooling trend since the planet is increasing the loss of energy from the planet that can’t be sustained thus a new cooling cycle is coming in soon just as it did around 100 years ago when the arctic started melting significantly as it did in recent years that has now stabilized to a flat trend.
You like many warmist/alarmists ignore past and present natural cycles because you never developed a decent level of science literacy to understand them.
50
http://lorraine-lisiecki.com/LisieckiRaymo2005.pdf
You make stuff up
The benthic proxies come from tropical sites. They just use Vostok equivalent as what it’s a proxy for. So they show that the tropics cooled to its coldest since the beginning of this ice age, about half a million years ago, then warming equivalent to 8 °C at Vostok in a short time. The time resolution is too poor to show it was over 100 years or 1000 years, and while the latter is not the same as 0.8°C per century of global average, the argument is that Mann lied about knowing.
20
With reference to the “symptoms” of being exposed to “rapidly rising temperatures” a toxicologist once told me, in reference to a range of common symptoms – “the symptoms are few, but the causes are legion”.
Those symptoms listed could be from over indulgence on New Years Eve, or food poisoning, or ………
60
1. The graph “Five million years of climate change from sediment cores” has about one point per 10,000 to 20,000 years. You absolutely cannot see any century in that. Not even close.
2. When Lisiecki and Raymo produced that graph, they ‘adjusted’ the figures to make a closer match with the 100,000-year Milankovich cycle which they thought controlled the glacial / inter-glacial cycle (it doesn’t – note that Ralph Ellis and Michael Palmer did the initial hard work not me). I emailed Lorraine Lisiecki about two years ago, asking for the unadjusted data. I got no reply (that’s not a criticism, sometimes emails from new sources go in the spam bin).
140
Thanks Mike. That’s useful information.
70
“Lisiecki and Raymo constructed this record by first applying a computer aided process of adjusting individual “wiggles” in each sediment core to have the same alignment (i.e. wiggle matching). Then the resulting stacked record is orbitally tuned by adjusting the positions of peaks and valleys to fall at times consistent with an orbitally driven ice model (see Milankovitch cycles).
[] Many studies have produced evidence that the two strongest orbital cycles (obliquity, 41 kyr and precession, 26 kyr) probably do drive changes in ice volume. The data in the figure have been fitted to these periods and also to the longer, much weaker 100 kyr eccentricity cycle. Over the past ~1 million years there have been a number of very strong glacial maxima and minima, spaced by 80,000 – 120,000 years, but the evidence for orbital forcing of these events is less secure. It is likely that this ~100 kyr cycle is controlled by some other as yet unknown mechanism. For further discussion of orbital periodicities see Milankovitch cycles.”
File:Five Myr Climate Change.png
(It’s also preserved multiple times on the Wayback Machine).
Note: I said “they ‘adjusted’ the figures to make a closer match with the 100,000-year Milankovich cycle”, but actually they adjusted to the 41,000 and 26,000 year cycles as well.
20
That picture is me in summer, 1978, before air con.
I love them claiming this hotter than ever stuff. I say, if this is 1.5 rise, then it’s not really that bad, is it? In fact, it’s effectively the same as the 1970s as I remember.
60
Comments about the 1931 “consensus” book that was used to try and silence Einstein.
50
Oh dear Jo! “Fastest hottest rate of warming for millions of years” prompts me to recollect one wonderfully-informed statement made by an honourable member of the House of Commons in 1828 (or thereabouts!): “Anyone travelling at more than thirty miles an hour will surely suffocate!”
And the honourable gentleman would have felt quite at home with the climate change (‘anthropogenic’, of course!) zealots today …..
Hmmm ….: Now for some personally-assembled propaganda of which Joanne is aware – but who knows? It might provide some entertainment – and I would welcome any criticisms/suggestions as I’m hoping that this might help to get through to Mr & Ms Average, and particularly to our propagandised Youth. Although (Gulp!) it’s leads on eventually to that subject which our learned Minister for Energy & Climate Change (or is it the other around?) disapproves. (Oh, Dear again!)
http://www.galileomovement.com.au/media/SaveThePlanet.pdf (A good title, I think!)
40
This sounds like a joke, but it’s apparently real. The Left have become parodies of themselves.
If the data don’t fit the Official Narrative, just replace the data with what it’s “meant” to be.
SEE LINK FOR REST
50
“Junk Science Alert: Met Office Set to Ditch Actual Temperature Data in Favour of Model Predictions.”
Have they actually gone mad.
50
Enjoying our extreme harmful summer so far, you know because El-Nino was going to result in all of us roasting. Admittedly we’re only into the second month of summer and the later ones are usually warmer, but December we had a above average minimum and max by 2.6 and 1.1 respectively. But rain, that was not supposed to happen if I recall, 79 mm for December against the long term average of 32.8 mm, and this month only 2 days in and we’ve already had 54.4 mm and its still raining, so already 30mm above the LTA, and there is much more forecast for later this week The ABC is still raving about extreme bush fire danger this summer due to El-Nino, their latest sensationalist article, “As Victoria’s bushfire season looms, one powerful reminder of Black Saturday hangs in the air”
I just love summer thunderstorms!
60
So do I.
30
what do they teach in highschool science to get away with such drivel?
30
“Michael Mann says it’s the fastest rate of warming for millions of years. Naturally, no science journalist thinks to ask him how he could possibly know this?”
Why would journalists ask that question? After all, we have it on good authority (his), that Mann is a Nobel Prize winner.
30
Hottest in 125,000 years say EU scientists
Except the planets been in a long term cooling phase for the past 8,000 years and despite the mild warming for the past 200 years after the little ice age, it still is.
8,000 years ago was 2~3 degC warmer than today.
20
Correction. ‘For millions of years’ to be replaced by ‘Since yesterday’.
10
No Ed. It’s millions. I asked my mate Ai coz I ain’t got no Ri (Real Intelligence)
10
What’s remarkable is that paleo records are resolved in years, decades and centuries whereas instrumental records resolution is seconds in the electronic instrument era. To make the claim that these are unprecedented is like saying there is no record of human development prior to written languages.
20
the Global Whiners should have said 128,924.5 years ago, which sounds a lot more scientific than 125,000 years ago, or a million years ago.
I prefer real science.
Such as this experiment which will be in the next Nature magazine.
Led by Mrs. Bertha McGillicutty, who is not a scientist, but is a very good cook.
At noon outdoors ion a sunny summer day in Sydney, she had . Mr. McGillicutty, who is completely bald, stand outdoors in the mid-day sun for an hour without a hat. Then, in front of many Australian TV cameras, she fried an egg on Mr. McGillicutty’s
bald head.
That is scientific proof that Sydney recently the warmest climate in millions of years. If not longer.
20
So hot on the night of 1.2.24 that I had to change into a skivvy and tracksuit pants just to stay warm. Ohh! That’s right, “climate change” covers all this now. Summer here didn’t wake up until December and even then, it still stutters but reality? Who cares?
The irony here is that the elite are so smug and certain, that all is proceeding as planned, that they do not care about how blatant are the lies that they push nor how incompetent are the fools they appoint. Every time Biden trips (verbally or literally), or Barry went on “holiday” on Xmas or Easter they laugh at just how gullible so many are. The smug arrogance they show is supremacist in every way.
10
[…] https://joannenova.com.au/2024/01/fastest-hottest-rate-of-warming-for-millions-of-years/ […]
10