If there was enough money, fame and power on the table (think seismic proportions, money that moves the economic landscape), would it be possible to take a small unproven scientific theory as an excuse and, with the best PR teams in the world, promote it, support it, and make it appear unquestionable?
If it were cloaked in the most “innocent” of motives, and shrouded in terminology that veils the truth, would it not run unchecked for years, unless some big vested interest opposed it? And if there was no particular big vested interest to oppose it, isn’t it possible that if the only harm it causes is to the giant disorganized mass known as humankind, there would be no committee of humankind to check its momentum.
On Watts Up tonight, we get some insight into just one specific example of how corrupt science can be. It’s yet another day in the history of the climate-scam where people may say years from now… remember that night we got the news about Darwin? Thanks to Willis Eschenbach’s dedicated analysis.
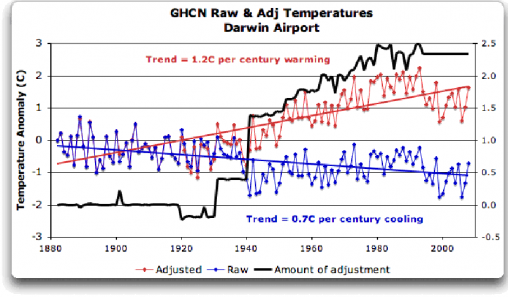
The blue line is the raw unadjusted data from Darwin. There are five stations there and their records are a very tight fit. It’s unusual for all five stations to agree with each other. Yet one of the three top climate centres in the world has “adjusted the data” using corrections that are graphed in black. (More artificial adjustments?) The raw data shows a trend down of 0.7 degrees C per century. After adjustment, the data “shows” a trend up of 1.2 degrees warming per century. It’s the scale of this shift that is so brazen. We’re supposed to be looking for a rise of one fifth of a degree per decade, and that statistical adjustment gave us half that rise.
Could Darwin be a local anomaly?
If Darwin had some freak local conditions, then we would expect to see the raw data in graphs from other top-end towns as trending much higher. Here are the graphs for Wyndham, Derby, Halls Creek and Broome. The graphs are from WA Climate Net, an excellent data set. Direct, Broome is 1100 km from Darwin, or 690 miles. (By road, it’s 1876 km from Darwin). (Thanks to MapCrow for the distances). I thought I would post these graphs to give people a rough idea of the historical warming across the far tropical north of Australia.
Western Australia
none there
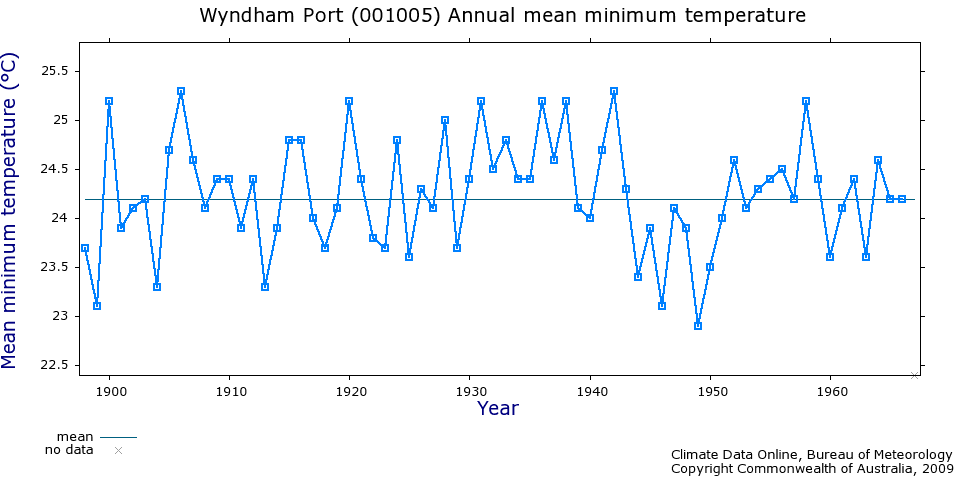
Global Warming missed Wyndham too.
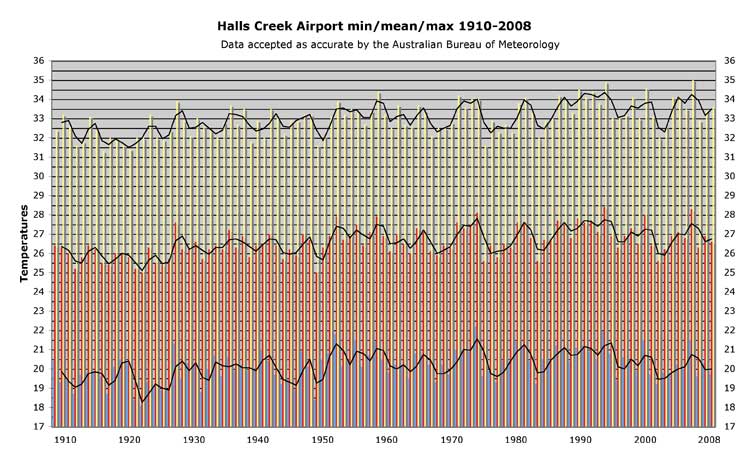
Halls Creek is inland, and there is a slight rising trend starting around 1920. About 1 degree C?
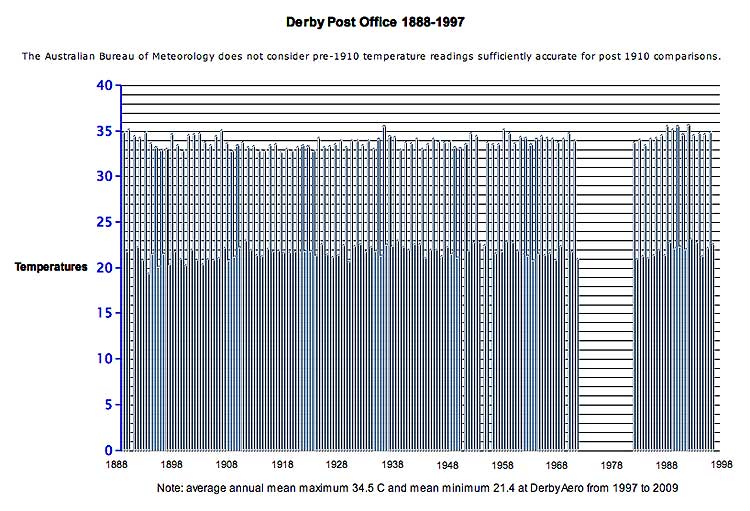
Derby is coastal, and again, no global warming…
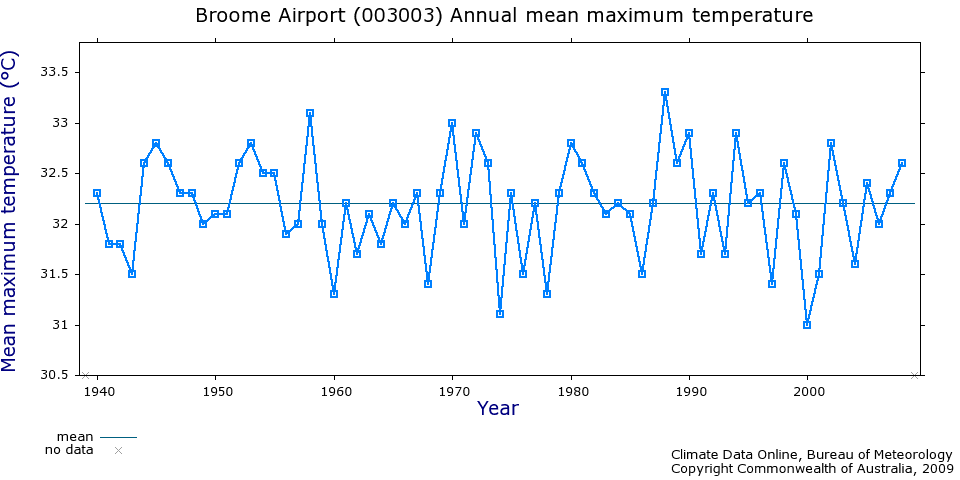
Broome is… running smack on average too.
These towns span thousands of square miles, and yet there is nothing to suggest major warming in any of the coastal ones and only a slight climb in the inland town. Nothing large enough to drag the average for the region up.
David Evans and I posted a joint paper about six weeks ago “The Future of Climate Alarmism is Bogus Statistics.” It all seems so tame now, but this was before ClimateGate, and before today’s revelations. The bogus statistics were there all the time.
Just for a looksee, I alsoo went searching for the warmer tropics in the Northern Territory and Queensland. What I found was a mixed bag, but long records at outstations (without major airports) showed that global warming appears to have more effect on computers at NOAA, than on the northern part of our landmass. There is some evidence that it affects airports too.
Tropical north Australia
…
Northern Territory
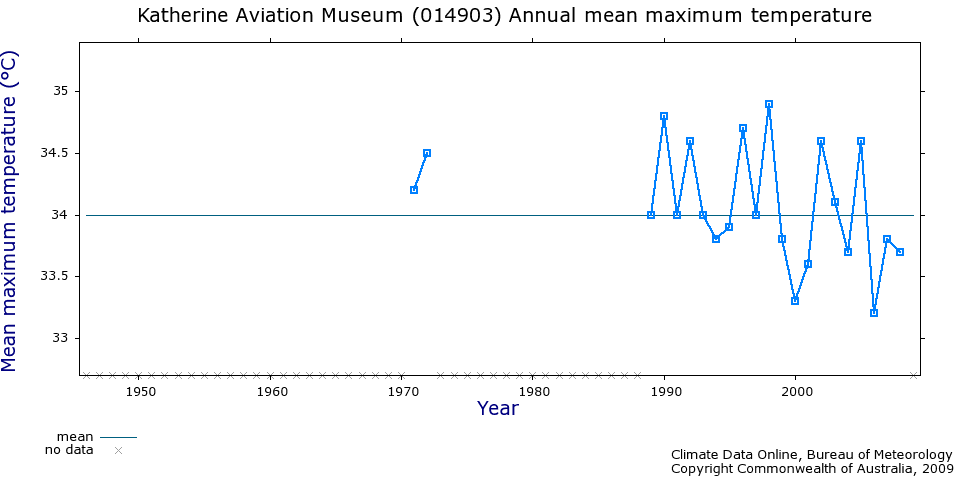
Katherine aviation museum (that’s right, there is hardly any data from the Northern Territory over long periods).
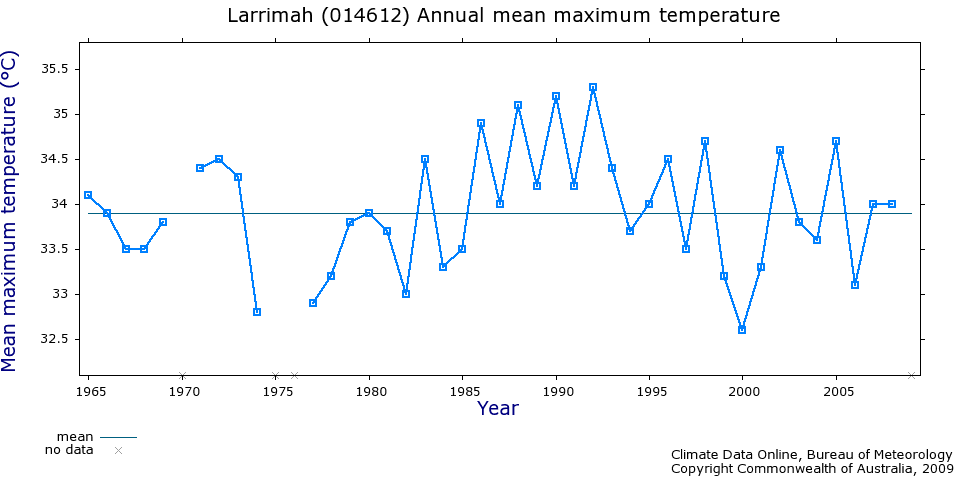
Larrimar NT (1965 – 2007)
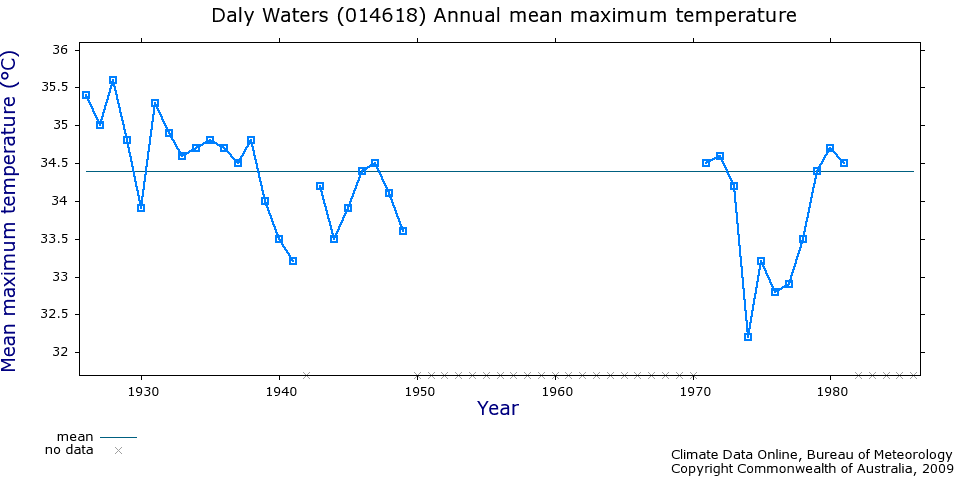
Daly waters (1930 – 1980) Cooling trend?
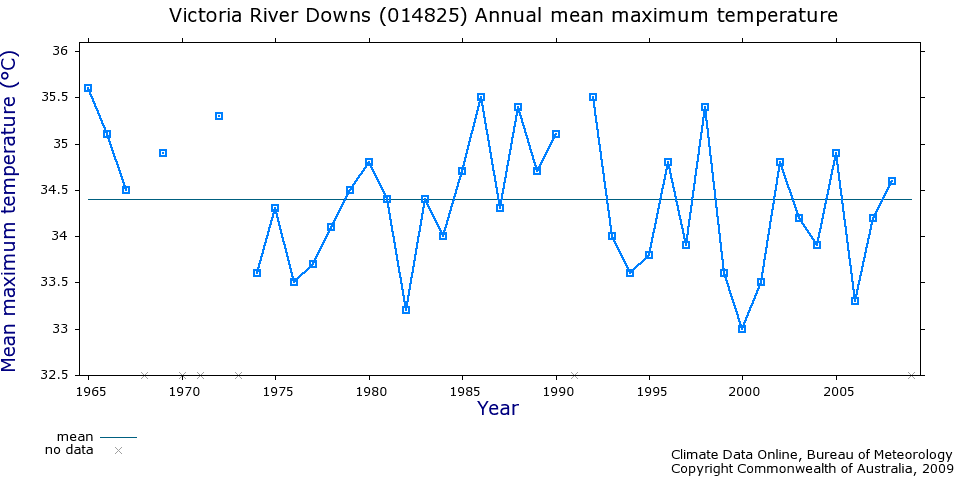
Victoria River Downs, NT, no warming since 1965 – 2009.
Queensland (West)
…
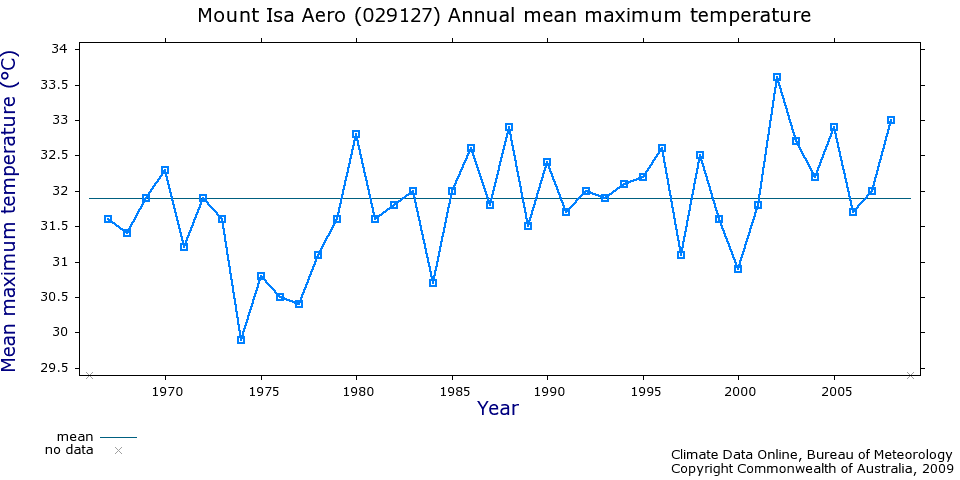
Mt Isa, Queensland. Another airport with a rising temperature, but it matches the towns far to the west and south. Perhaps it’s a real effect? (See Camooweal and Urandangi) But it’s also near Julia Creek (unfortunately missing data) and in the same quarter as Boulia, which has a long term record which is more complete than most of the others, and yet shows no warming.
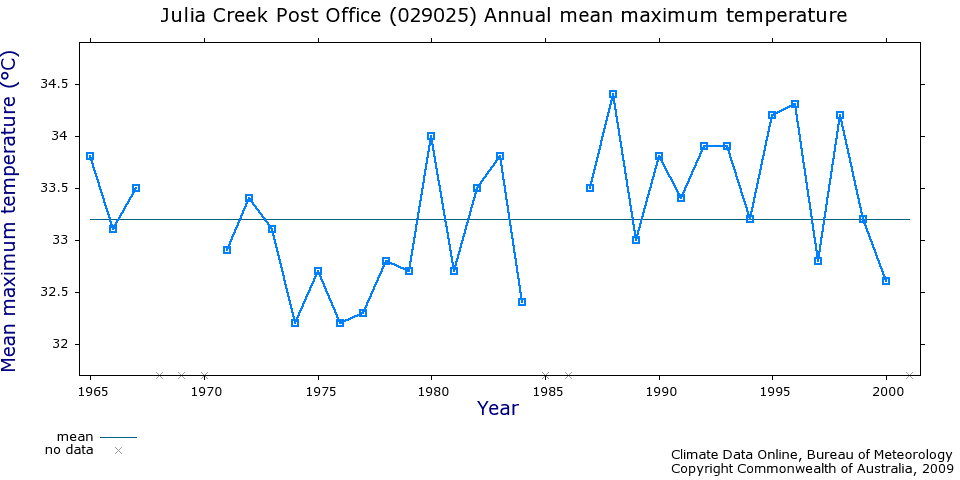
Julia Creek (1965 – 2000)
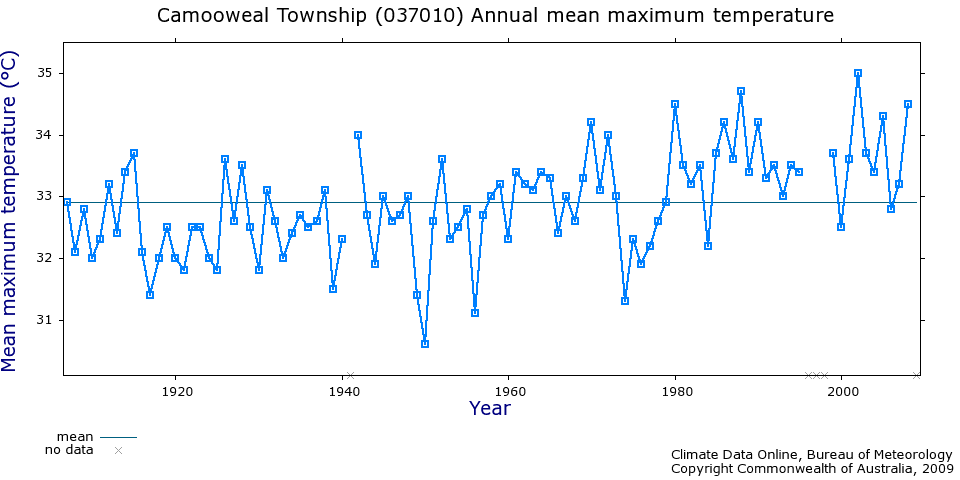
Camooweal does appear to be warming. It’s a small town on the border of the Northern Territory and Queensland
…
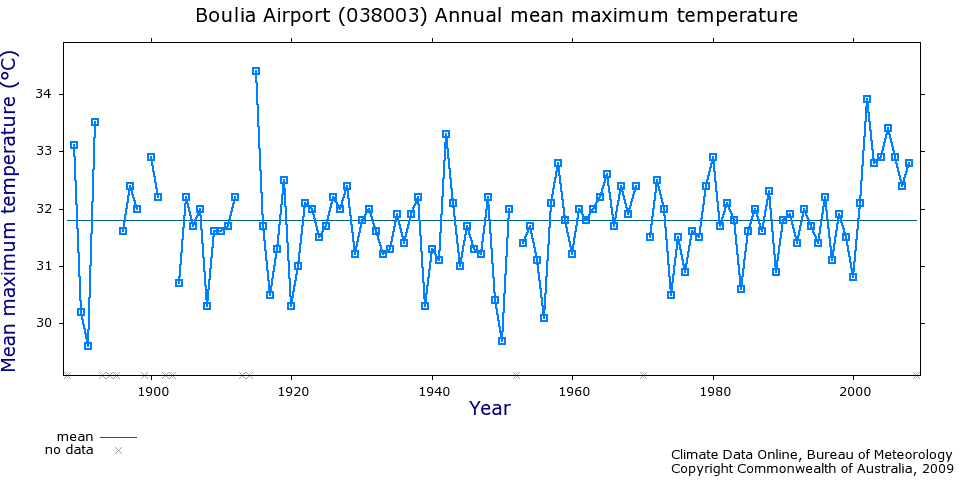
Boulia, Qld (More info here, that map tells you a lot…) An airport with no warming and long continuous records – 1886 – 2009!
Latitude: 22.91° S Longitude: 139.90° E (Just in the tropics).
…
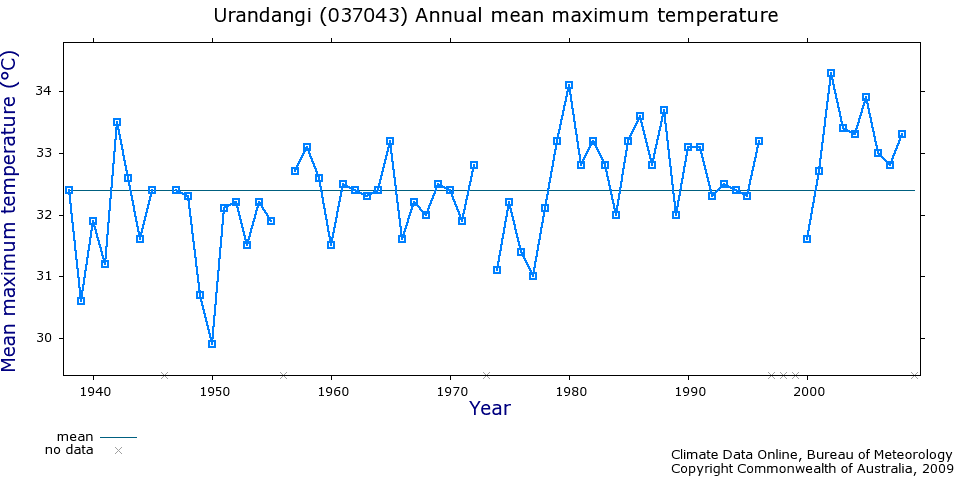
Two cases of warming! Urandangi Qld, 150km from Mt Isa on the border of Queensland and the NT ( yes, inland, south of Camooweal).
Queensland (East)
…
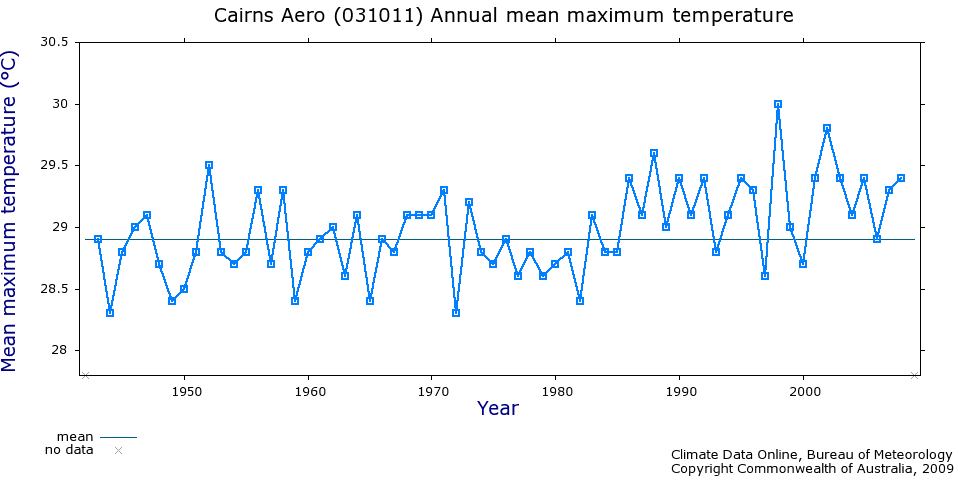
Cairns Airport – – another airport with more traffic and larger areas under concrete?
…
…
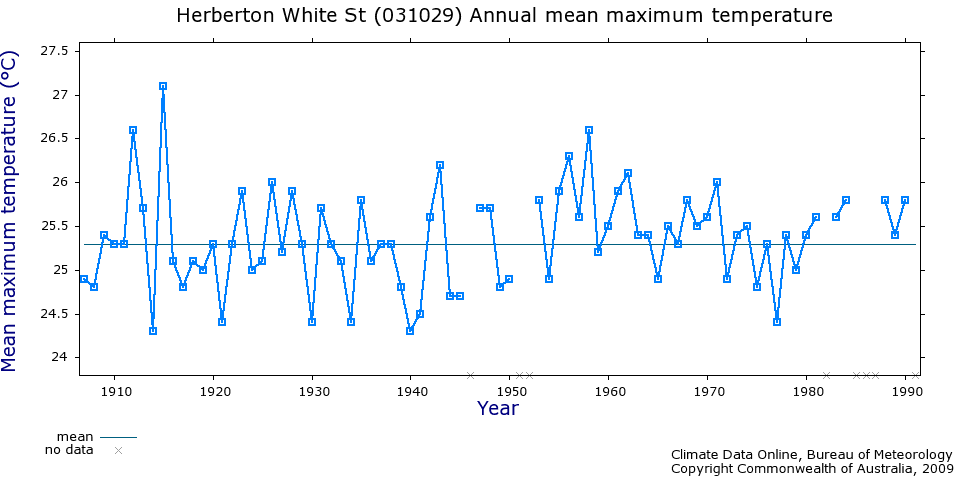
Herberton Qld (1910 – 1992) No warming in Herberton, and it’s about 100km from Cairns.
………
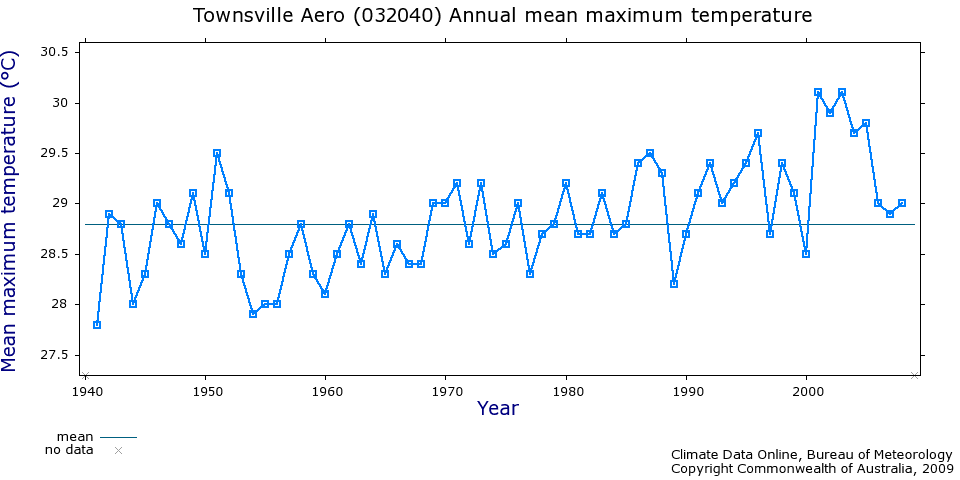
Townsville Aerodrome shows a clear rising trend since 1940
…
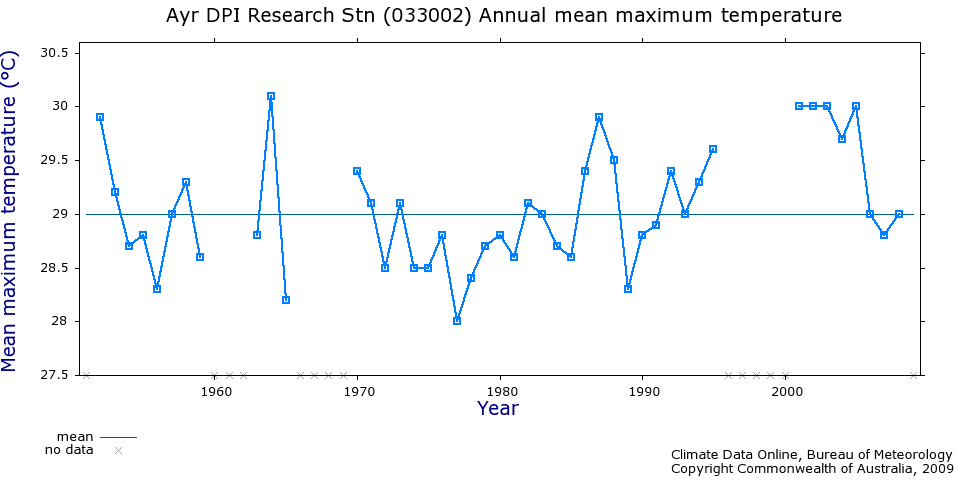
But Ayr Research Station 70 km away shows no warming during the same time period (1950 – 2009).
Does …..
I generated these graphs using the Bureau of Meteorology website, and there are more sites there to look at.Perhaps you can find the missing warming locations across the vast north that would bring the average up? Is there any way the official calculated averages for northern Australia could reflect the data we have on the ground?
UPDATE: This is the graph from the IPCC (As from Watts Up). You can see this on the big page within AR4. The IPCC uses the GHCN to show Northern Australia is “warming”.

UPDATE 2: (Dec 21). Watts Up have revisited this in more depth.


What’s the average of 4 and 2?
Mathematician: 3
Physicist: 3
Chemist: 3
Geologist: 3
“Climatologist”: That depends on what year we are talking about…
10
Another one of those scientific “tricks?”
10
This is no doubt a legitimate example of climate temperature manipulation. Someone who can summarize and present this material in a way that a “regular person” can understand it, will be doing a great service for all of us who want to see honesty and integrity returned to the sciences.
20
You remind me of the so-called proof that 1 = 2. Falacious of course, but the details are hidden in a lot of obfuscation so you have to look to find the problem.
10
Should add that climate research seems to have the same problem. But someone finally blew the lid off.
10
Hi All,
I just came across the graph at the follwing link which ha been bandied around in Copenhagen:
http://www.metoffice.gov.uk/climatechange/science/explained/explained5.html
To me, as a mere mortal, it seems weird that the Y axis is the “anomoly relative to 1961 – 1990” that the period between 1961-1990 on the X axis should be hovering around the 0 mark?
It isn’t.
As mentioned, I am not a statistician, but this looks pretty suspect to my eye.
10
PoGi,
Q. I have a continuous curve over 24 hours, how do I calculate it’s mean?
A. You add the minimum to the maximum and divide by 2.
Or to put it another way:
(x0+x1+x2+ 59 +x4+x5+x6+x7+x8+x9+ 25 +x11+x12)/12 = (59+25)/2 = 42
Climate algebra!
10
Forgive my question. Maybe I’m just ignorant of something. But what do they mean by anomaly and why do they use it?
It would seem to me that if the temperature at some given place is x on any given day and time then that’s the temperature then. If on some other day and time the temperature is y then that’s the temperature then. What is anomalous about that? This seems like trying to make data show something it doesn’t show. What can be anomalous about something that you can’t control?
I can understand that if I set my oven for 350 F and it goes to 400 F instead then that’s anomalous behavior (not as expected, though I would call it erroneous). But they’ve no way to expect the temperature anywhere to be a certain value.
Help!
10
Hey Roy,
I think how it works (could be wrong) is they pick some baseline period i.e. 1961 – 1990 and then take the average temperature over that period. The anomaly is then the difference between temperature recorded and the baseline average.
10
Steve,
Thanks.
I think I’ve got that part now. But it doesn’t seem to represent anything real. It also seems highly subjective since it would depend on your choice of baseline period.
Why do they use this statistic?
Oops, I see now. The individual temperature records from different places would differ quite a bit, but the anomaly over the same period would be what we see in the graph if temperatures were changing in a similar pattern over that time. So it allows them to easily compare the trends in different data sets.
10
Roy,
The reason anomalies are used as opposed to the raw temperatures is that the scale of changes is so small compared to most temperatures, that the actual changes are impossible to see. Think about 20 degree average temperatures vs a 0.15 degree/year change…
If you are curious, look at some of the Arctic/Antarctic raw temperature records vs. the anomalies to see what I mean.
10
OK, got it.
Thanks for the help.
10
… AND ON JOANNENOVA.COM TODAY, WE GET SOME INSIGHT INTO JUST ONE SPECIFIC EXAMPLE OF HOW TO DRAW A REALLLLY LONG BOW FROM A REALLLLY SHORT PIECE OF STRING.
10
See figure 5.1 HERE
10
Brilliant! This post is so helpful and far more informative than the once trusted bbc who strangely report just one side of the argument and as little facts as possible – its like the poor things dont have internet.
20
@Rumble
No, the issue is that the IPPC may have fraudulently revised the North Australian temperatures to show a trend in strict conformance with a pre-ordained political bias. I say “may” because they have still not released the station data. If the data has to be altered to suit their political bias, it means they are unsure of the science, otherwise why “game” the debate? If they haven’t done this, why not release the station data? This is not science, its politics.
20
10
a = b + c
Multiply by (a-b):
a(a-b) = (b+c)(a-b)
Expand:
a^2-ab = ab-b^2+ac-bc
Subtract ac from both sides:
a^2-ab-ac = ab-b^2-bc
Factorise:
a(a-b-c) = b(a-b-c)
so:
a = b,
or if you prefer, any number equals any other number you want it to.
AH! Thats what was done! They got their algoroithms from ENRON!!!
20
Wow good post JoNova! Congratulations on getting this analysis out so quickly following Willis’s revelations. Now lets see what other “homogonised” station data is up to.
10
on the first wattsup ‘darwin’ thread (there’s a new one up now)a chris gilham (see below) points out how west australian met temps for august were changed in november and he posted the met response when he pointed out the changes.
given australia features heavily in the WMO report the MSM is all over today, and august is one of the months involved, according to abc’s report below, one wonders if west australia was the only one involved in ‘value-adding’ to allow the claim this year could be fifth warmest.
ABC: UN report singles out Australian weather
The WMO report said the heatwaves happened in January/February, when the hot
weather contributed to the disastrous Victorian bushfires, in August and
again in November..
The report is based on data from NASA and the US Government’s National
Oceanic and Atmospheric Administration, along with data from the UK’s Hadley
Centre and the University of East Anglia, the university at the centre of a
scandal involving leaked emails from climate researchers.
The data is preliminary as 2009 has not yet ended. It will be revised early
next year.
Mr Jarraud said the WMO issued its 2009 summary early so it could be
factored into discussions at Copenhagen on global warming.
http://news.smh.com.au/breaking-news-world/un-report-singles-out-australian-weather-20091208-khtd.html
wattsup: The Smoking Gun At Darwin Zero
8 12 2009
by Willis Eschenbach
COMMENT: Chris Gillham (07:04:21) :
Last week while updating my website (http://www.waclimate.net) with
temperatures across Western Australia for November, I noticed something
peculiar about August 2009 on the BoM website.
http://www.bom.gov.au/climate/dwo/IDCJDW0600.shtml
The mean min and max temps for August had all gone up by about half a degree
C since first being posted by the BoM on Sep 1.
Below are the min and max temps for the 32 WA locations I monitor, with the
BoM website data at the top as recorded from Sep 1 to Nov 17, and below them
the new figures on the BoM website since Nov 17 .
August 2009
Albany
9 16.2
9.4 16.6
Balladonia
5 20.7
5.5 21.1
Bridgetown
5.7 15.7
6.2 16.1
Broome
14.6 29.2
15.1 29.7
Bunbury
8.2 16.7
8.7 17.2
Busselton
8.7 17
9.2 17.4
Cape Leeuwin
11.8 16.2
12.2 16.6
Cape Naturaliste
10.5 16.7
11 17.1
Carnarvon
11.4 23.2
11.8 23.6
Derby
15 32.7
15.6 33.2
Donnybrook
6.7 17.2
7.2 17.6
Esperance
8.3 17.7
8.8 18.1
Eucla
7.9 21.5
8.4 21.9
Eyre
4.3 21.6
4.5 22
Geraldton
9.5 20
10 20.5
Halls Creek
16.1 32.6
16.6 33
Kalgoorlie
6.8 20.3
7.2 20.7
Katanning
6.1 14.7
6.5 15.1
Kellerberrin
5.3 18.6
5.6 18.9
Laverton
7.5 22.4
7.9 22.9
Marble Bar
13.8 31.1
14.3 31.5
Merredin
6.1 17.7
6.5 18.1
Mt Barker
6.8 15.6
7 15.8
Northam
6.2 18.4
6.6 18.7
Onslow
13.8 27.7
14.3 28.1
Perth
8.8 18.5
9.3 18.9
Rottnest Island
12.4 17.3
12.9 17.7
Southern Cross
4.6 18.1
5 18.6
Wandering
5.3 16.1
5.6 16.6
Wiluna
7.5 24.8
7.7 25.2
Wyndham
18.3 34
18.8 34.4
York
5.6 17.9
5.9 18.3
I’ve questioned the BoM on what happened and received this reply .
“Thanks for pointing this problem out to us. Yes, there was a bug in the
Daily Weather Observations (DWO) on the web, when the updated version
replaced the old one around mid November. The program rounded temperatures
to the nearest degree, resulting in mean maximum/minimum temperature being
higher. The bug has been fixed since and the means for August 2009 on the
web are corrected.”
I’m still scratching my head, partly because the bug only affected August,
not any other month including September or October. There’s been no change
to the August data on the BoM website since I pointed out the problem and
they’re still the higher temps.
So if anybody has been monitoring any Western Australia sites at all (or
other states?) via the BoM website, be aware that your August 2009
temperature data may be wrong, depending upon whether you recorded it before
or since Nov 17, and it’s not yet known what’s right and what’s wrong.
http://wattsupwiththat.com/2009/12/08/the-smoking-gun-at-darwin-zero/
10
Save those files! They (BOM) might try to delete or change them? Get time/date/stamp. Good luck
10
JS
Okay, let’s take a DEEP breath here.
Maybe “the IPCC” – whatever you mean by that – did something really devious.
Maybe whoever did this analysis had devious motives.
Maybe whoever did the adjustments made a mistake.
Maybe whoever did this analysis made a mistake.
Maybe whoever did the adjustments can argue a strong case for them being statistically valid. Maybe they can’t.
The point is: we don’t know. We may know later, but we don’t know yet.
You can rant and rail all you like against “alarmists” and their conduct but if you startle at every shadow and jump to any premature conclusion your bias leads you to, than you’ll be seen as even less credible than those you criticise for making too much, too soon of too little.
On the strength of questions raised by one blogger’s analysis of a small and curious data set – and without the benefit of a rebuttal or balancing comment by anyone involved in actually doing that work – you JS are prepared to allege that the worst possible construction that can be put on this – scientific fraud – may have taken place and effectively extrapolate that to the whole of the IPCC and ALL the data. Don’t be surprised if someone accuses you of being histrionic.
Jo asserts that her site is all about “logic and reason” and yet she sets the scene on this page with a fantasy guaranteed to emotively colour what follows with conspiracy innuendo. If you are genuinely sceptical you will think about why she did that.
Worse, she goes even further than you to assert in what I consider to be an unreasonable, illogical, insupportable (as yet) and unequivocal (yet again) bald allegation that this is a
Sounds much more like the same-old same-old politics to me.
P.S. Another viewpoint on ClimateBeatUp here:
http://www.youtube.com/watch?v=P70SlEqX7oY&feature=player_embedded
10
Roy, clue,
The other reason anomaly analysis is used is because data anomalies can masquerade as anomalous trends, especially when time averaging is performed.
10
10
The Andrew Weaver break-in occurred in 2008 (!)
Anything to distract from Climategate…
10
[…] This post was mentioned on Twitter by Aaron Turpen, Aaron Turpen. Aaron Turpen said: Smoking Guns Across Australia: Where’s the warming? Looking at 16 other locations. « JoNova http://bit.ly/5ncKQo […]
10
New draft Copenhagen Treaty available on Scribd, file name 091127copenhagen
or try this link
10
The derivation of the graph at the top of this post requires explanation. From a scientific point of view these people are doing more discredit to themselves than what the skeptics would ever achieve by breaking in to offices and access the raw data. I have tried to get a credible explanation from NIWA (New Zealand) for the adjustments made to the Wellington and Hokitika temperature data. It looks like the have used the same algorithm (or is that AlGoreithm) to derive the trends in Darwin. Unfortunately, without an official request it looks like these people do not condescend to explain their data manipulation to mere mortals.
10
If you think that’s bad, you should try the tax office. And don’t start me on Cabinet documents, police crime data, intelligence files, medical records . . the list is endless.
10
*DEEP Breath*
Rumble,
Sure, I’m happy to wait to see the explanations for the adjustments before I cast judgment.
I just hope that one day all the historic temperature series raw data (and I mean raw) is made open source. Then anyone with the appropriate meteorological training should be able to tell if adjustments made are warranted.
I don’t like the idea of being asked to trust data when the person telling me to trust them is not willing to make their original data available to me.
10
But…but… but….. You haven’t allowed for the “adjustments”….
If you skeptics can have your factual and proven UHI adjustments. We AGW Proponents can have our completely bogus CO2 modeling adjustments…. and any other adjustment that comes to mind……. It’s only fair! 😉
10
Another great Post Joanne…more detailed than,http://www.climatechangefraud.com/climate-reports/5808-the-smoking-gun-at-darwin-zero Most people here appreciate what you do…But we know in Life we can’t please them “all”! Right, Rumble??? 🙂
Check out the latest from Copehagen: Copenhagen Climate Summit in Disarray After ‘Danish Text’ Leak
http://www.globalwarminghoax.com/e107_plugins/forum/forum_viewtopic.php?1442.last
and another great article by Mr. Briggs: ClimateGate: ‘The Copenhagen Diagnosis Fails Logic 101
http://www.globalwarminghoax.com/e107_plugins/forum/forum_viewtopic.php?1441.last
and this article tells a story that’s been around for a while, since the 1800’s? Global Warming Theory Not New but Simple Reborn Malthusianism
http://www.globalwarminghoax.com/e107_plugins/forum/forum_viewtopic.php?1440.last
10
The met bureau has just released new temperatures and station data for 1000 stations, CRUTemps
provided by East Anglia CRU. Only the “adjusted data are provided, not the original measurements,
and only one figure ( min, max, mean – i dunno)
Anyway, this data seems to show Darwin temperatures significantly lower today than in 1882.
10
Thank you Joannenova.
10
Here’s a “Heads Up” on something I came across in an advertisement tonight!!! I was amazed lightly put…My question is what do YOU think about this happening to your from your neighbor…..
http://www.ecosnoop.com/index.php?option=com_ecosnoop&view=list&select=recent
Also, may I ask, has anyone here seen this before????
10
Would someone please explain something about the conspiracy.
A conspiracy is a group of people banded together to achieve some harmful or illegal purpose. This implies a common purpose.
What common purpose is shared by The Australian Bureau of Meteorology (who say AGW is happening), the Chinese Politburo (who say AGW is happening), the CEO of Woolworths in Australia (who says AGW is happening), the South African Department of Environmental Affairs (who say AGW is happening) and the General Commission for Scientific Agricultural Research of the Syrian government (a dictatorship that says AGW is happening)?
Do these people co-operate with each other in the vast global conspiracy?
10
Artic sea ice expands significantly for two years in a row by nearly one million square kilometers
– Lame Stream Media spins it as “Third lowest minimum on record”
and “Symptomatic of Climate Change”. Sheesh!
Quote “The actual lowest point of the year occurred on September 12th when the extent of sea ice was 5.1 million square kilometers (1.97 million square miles) — this was some 580,000 square kilometers above last year’s minimum and 970,000 square kilometers above the record set in 2007.”
I’m starting to think that the media have brainwashed themselves.
10
Alan,
Ummm.. Nice try, but no Banana (Apparently wespac have the banana market wrapped up – heehee).
I think you will find that a conspiracy doesn’t have to involve everyone with the same views to be bunched together. There are always people who get sucked in along the way and others who join in for their own personal financial reasons.
Of course, I’m sure someone out there has managed to twist everyone in the AGW camp into the one vast conspiracy, just as some leaders here in australia make offensive remarks about anyone who doubts AGW.
With regards to the breakins and threats rumble, has it occurred to you that some passionate alarmists from the fringe might be even more angry at these guys for jeopardising “the cause”?
10
@Alan
No conspiracy is actually required.
This was all started by Margaret Thatcher funding the Royal Society of Science
to “prove” Her theory of CO2 caused global warming. There was no any funding for the contrary view.
It is just human nature for most people and Government agencies to naturally agree with what they believe to be “the consensus” majority view, to avoid being ridiculed.
This is especially so if “the consensus” is espoused by media celebrities, Presidents, United Nations official pronouncements and political parties seeking green votes.
The climate scientists don’t need a conspiracy, either, just a vested interest in not making themselves look foolish by admitting publicly to private doubts and in keeping their research funding going, which is totally predicated on adopting the AGW worldview, right or wrong.
Just look at what happened to David Bellamy – he admitted he did not believe in Global warming and he was immediately banned from employment at the BBC.
In one of the CRU emails a scientist say to another words to the effect of : I’ve just got off the phone with Greenpeace and they want you to say in your scientific that there will be a 50% increase in Droughts in Australia, because Australias are concerned about drought and it will help with the Media launch.
The scientists are not predicting climate change scenarios, they are just adding an aura of “scientific truth” to apocalyptic scenarios to help with media promotion of the AGW scare. It is all being made up.
10
Thanks to Pat for pointing out my concern re the accuracy of August 2009 temps from the BoM website.
I like to keep a monthly update on my site comparing the average mean min and max from the early 1900s to the most recent 12 months at 32 different locations from Halls Creek to Albany. I acknowledge such a comparison is statistically irrelevant, but it’s nevertheless good fun.
The data for the 12 months to October 2009 showed min temps were .39 degrees higher and max temps were .6 degrees higher than the early 1900s (mostly 30 year averages). For the 12 months to November, however, these difference leapt to .53 and .92 degrees.
The discrepancy caused by the August 2009 BoM bug added about .04 degrees to the Dec 08 – Nov 09 average temps. The huge increase was mostly caused because November 2009 replaced November 2008 in the 12 month average. The BoM makes a point that November 2009 was very warm:
http://www.bom.gov.au/climate/current/month/wa/summary.shtml
November 09 was warm but Nov 08 was also cooler than the historic mean average, particularly max temps which suggest above average cloud cover over WA in Nov 08.
Albany
Nov 08 – 11.2 and 18.7
Mean – 10.7 and 20.7
Nov 09 – 13.7 and 20.9
Balladonia
Nov 08 – 11.5 and 23.7
Mean – 11.3 and 27.8
Nov 09 – 13.4 and 30.3
Bridgetown
Nov 08 – 9.5 and 21.9
Mean – 8.8 and 24.2
Nov 09 – 9.4 and 24.4
Broome
Nov 08 – 26.6 and 33.3
Mean – 25.1 and 33.6
Nov 09 – 26.6 and 35.5
Bunbury
Nov 08 – 10.6 and 22.1
Mean – 9.7 and 22.1
Nov 09 – 12.4 and 24.2
Carnarvon
Nov 08 – 17.5 and 26
Mean – 18.6 and 27.4
Nov 09 – 18.9 and 30.4
Derby
Nov 08 – 25.9 and 38.3
Mean – 25.5 and 38
Nov 09 – 25 and 39.4
Donnybrook
Nov 08 – 10.3 and 22.7
Mean – 10.4 and 24.8
Nov 09 – 11.8 and 25.9
Esperance
Nov 08 – 12.4 and 20.3
Mean – 12.7 and 23
Nov 09 – 14.2 and 26
Eucla
Nov 08 – 13.8 and 23.6
Mean – 13.3 and 24.1
Nov 09 – 15 and 28.3
Eyre
Nov 08 – 13.1 and 22.8
Mean – 12.1 and 24.1
Nov 09 – 12.6 and 27.1
Geraldton
Nov 08 – 13.2 and 25.2
Mean – 13.8 and 27.1
Nov 09 – 14.4 and 29.1
Halls Creek
Nov 08 – 25.7 and 38.4
Mean – 24.5 and 38.3
Nov 09 – 25 and 39.4
Kalgoorlie
Nov 08 – 12.6 and 25.5
Mean – 14 and 28.9
Nov 09 – 16 and 31.2
Katanning
Nov 08 – 9.8 and 22.1
Mean – 10 and 25.1
Nov 09 – 10.3 and 27.4
Kellerberrin
Nov 08 – 9.8 and 26.2
Mean – 12.2 and 28.9
Nov 09 – 12.5 and 30.8
Laverton
Nov 09 – 14.9 and 27.2
Mean – 14.2 and 27.2
Nov 09 – 17.9 and 31.3
Marble Bar
Nov 09 – 22.9 and 39.3
Mean – 21.5 and 38.4
Nov 09 – 24.2 and 40.3
Merredin
Nov 09 – 11.6 and 25.7
Mean – 13 and 28.4
Nov 09 – 14.3 and 30.3
Northam
Nov 08 – 11.2 and 25.7
Mean – 12.4 and 28.5
Nov 09 – 12.3 and 29.8
Onslow
Nov 08 – 18.4 and 31.2
Mean – 19.2 and 33.8
Nov 09 – 21.5 and 36.1
Perth Airport
Nov 08 -12 and 23.9
Mean – 12.6 and 25.7
Nov 09 – 12.8 and 27.4
Rottnest
Nov 08 – 14.6 and 21.2
Mean – 15.7 and 22.8
Nov 09 – 16 and 23.6
Wiluna
Nov 08 – 16 and 30.3
Mean – 17.8 and 34
Nov 09 – 18.4 and 34.2
Wyndham
Nov 08 – 28.6 and 40
Mean – 27.2 and 39.5
Nov 09 – 27.7 and 39.9
Meanwhile, the BoM has replied to my email seeking clarification as to whether the pre or post November 17 temps on the BoM website are the official temps.
Reply: “The bottom ones are correct. The bug only affected averages for August 2009.”
The answer relates to how I put my question and means the higher temps on the BoM website since Nov 17 are officially correct. It also confirms an upward adjustment was only made for the August 2009 data, so researchers should make sure their databases are accurate if recorded from the BoM website between September 1 and November 17. I don’t know if the BoM bug affected only WA figures or all Australian figures for August 2009.
I’m not sure why the BoM thanked me for pointing out a problem they must have known about by Nov 17 so they could make the upward adjustment, but I’ll assume it was a sloppy way of thanking me for asking.
10
CRU Computer code fudge factor.
Plot this in excel and you get a great hockey stick and without any temp data at all.
Sorry cant load a picture. Jo maybe you could plot this data as a stand alone graph. use a base of zero at 1904 and watch the fun start.
10
Further to Alans (36) question…
I not sure there is an actual conspiracy but more an “aligning of the planets”.
Influential political groups, such as the UN, and leftist governments want to enforce their policies upon us rather than the people setting their own policies. There may also be desire to redistribute global wealth.
The environmental and animal conservation NGO’s want to enforce policies of curbing development and industrialisation.
There may also be a hybrid form where leftist political supporters infilitrated enmass the NGOs. Check out Patrick Moore who founded Greenpeace and why he quit the organisation in the 80s.
They are all pushing their individual specific causes and agendas. The idea of “CO2 is pollution causing catastrophic global warming and we need to act” is just a means for them all to achieve their objectives. They end up having a synergistic effect on the momentum of the AGW idea.
As it gained traction, the media jumped in and then the population became convinced. Once this happened, other governments felt compelled to jump on board. The scientific process became corrupted in order to keep the grants coming. “Peer reviewed” meant getting your mates to review your papers while you reviewed theirs and anyone who disagreed, other scientists or evidence or journals, were shut out and ostracised. Now with the wealth redistribution policies in sight, poorer nations are jumping in along with financial giants. Money has a distinct smell. I notice the squabbling going on at the moment in Copenhagen has nothing to do with “saving the planet” but “how much do we get”.
The only thing they weren’t counting on was that temperatures would stop climbing and then start to drop.
10
University of Victoria spokeswoman Patty Pitts said there have also been attempts to hack into climate scientists’ computers, as well as incidents in which people impersonated network technicians to try to gain access to campus offices and data. However, those incidents took place at the Canadian Centre for Climate Modelling and Analysis, she said — an Environment Canada facility located at the university. As such, Environment Canada would be the investigating agency.
“They have a completely separate computer system from ours,” Ms. Pitts said.
The office break-ins took place late last year, Mr. Weaver said, while the other alleged hacking attempts at his colleagues’ offices — all unsuccessful — took place within the past few months.
Both campus police and the Saanich Police Department helped probe the office break-ins, Ms. Pitts said, but to date, no suspects have been identified nor arrests made.
Sujata Raisinghani, a spokeswoman for Environment Canada, said while the agency has no evidence of “successful” hacking attempts at the climate modelling centre, it cannot comment on “threats against its infrastructure” for security reasons.
“Environment Canada routinely monitors its infrastructure and takes necessary precautions to protect its information assets,” she said.
Mr. Weaver believes the timing of the alleged attempts to breach security is linked to the coming Copenhagen summit. In the Jones case, he blasted the media for being sucked in by the minutiae of old emails rather than trying to determine who is ultimately responsible for what he called an agenda-based campaign to discredit climate science.
“The real story in this is, who are these people and why are they doing it?” Mr. Weaver said, noting the Jones controversy was not the result of a “lucky hack” days before the Copenhagen conference. “They’re trying to find anything. They don’t care what it is.”
10
Steve McIntyre’s Air Vent now says that Alaska has been “bodged” too.
Maybe the “Artificial Correction” to hide the decline applies to some surface temperatures too, as well as tree ring proxies.
10
[…] The baked thermometer records: Africa, GIStemp, Darwin Zero, Alaska, Australia […]
10
[…] wonders what sort of reception they will come home to, especially as climategate widens with NZ and Australian data found to have been fraudulently manipulated to show a warning that doesnt exist. All the while the […]
10
I am not accusing the Australian BoM of anything. This is about the three main centres who collect and adjust temperatures globally and the IPCC use of their adjustments.
I’ll add this graph below to the post. This is what the IPCC suggest has happened in Northern Australia. They ignore almost all the data collected by the Bom. Most of the stations they include are at airports. They won’t release their data. They are hiding things like the Darwin adjustment. Who knows what else?
None of the critics here has made any attempt to explain why the adjustment for Darwin could possibly have any legitimacy.
Like I said, “it’s one specific example”, and the critics have no answer other than to blather, exaggerate words, try the “Conspiracy theorist” smear, and cling to their faith (or their payments).
What justifies the IPCC graph? Where could they have got the data, or it is just the result of a photoshopicus analysis?
10
Thanks Neville, and Black Duck for notice of this significant Watts Up post that kicked this off.
10
The thing about these ‘adjustments’, is that they are completely unnecessary. The purpose is to look for trends, so absolute differences are irrelevant, besides, this will be uncorrelated error among stations and will tend to average out. Even upgrading equipment shouldn’t necessitate a bias. This only changes the uncertainty, although it may indicate that the uncertainty of previous measurements was larger than otherwise stated. Even heat island effects won’t have too much of an effect on the result, as long as there are sufficient unaffected measurements. Land measurements should only make up 30% of the samples anyway while the other 70% must come from ocean measurements.
George
10
Rumble Mourdre wrote:
“droughts have become hotter, with effects on rainfall, evaporation and runoff, and, more generally, water availability for human use (Nicholls 2004).”
Drought in Australia is defined as rainfall over a three month period being in the lowest decile of what has been recorded for that region in the past.[see http://www.bom.gov.au/climate/glossary/drought.shtml%5D. Drought is a relative term and rainfall deficiencies need to be compared to typical rainfall patterns including seasonal variations. Specifically drought in Australia is defined in relation to a rainfall deficiency of pastoral leases and is determined by decile analysis applied to a certain area.
I’d like to know the following:
1. How do you measure the temperature of a drought? What would it mean, say, to declare that the 1890s drought was so many Kelvins cooler than the current drought?
2. How does a “relative term” have effects on “rainfall, evaporation and runoff”? Does drought make rainfall sadder, more intelligent, aggressive, or what.
3. Do your droughts come in different colours/patterns/designs? I’d like to order a paisley one 😉
I must admit that of all the many sciences I have studied, this post-modern science leaves me somewhat nonplussed.
The document to which you refer, The Garnaut Report, has drought increasing in Australia, yet the CSIRO data indicate the exact opposite. [Look up Pan Evaporation Paradox and you will see what I mean].
10
Rumble Mourdre wrote: “Jo asserts that her site is all about “logic and reason” and yet she sets the scene on this page with a fantasy guaranteed to emotively colour what follows with conspiracy innuendo. If you are genuinely sceptical you will think about why she did that.”
Please explain why you believe Willis Eschenbach’s analysis is a “fantasy”. Logically, if you believe that Willis’s example is a “fantasy”, you should be able to point us to an example of temperature records that show the purported warming yet do not require adjustment in order to do so.
You might also want to explain why Warwick Hughes’ observation of ten years ago that a HADCRUT gridcell with no stations was warmer than the surrounding gridcells and presumably obtained by averaging those surrounding gridcells. To the best of my knowledge, that has never been explained.
Please note that I do not deny that the planet has warmed over the last century; there is abundant indirect evidence that this is so. So it’s a puzzle why it appears necessary to conduct inexplicable and unexplained manipulations to the underlying data. You might also explain why it’s so difficult to get these CRU/GISS/NOAA folk to explain such to lukewarmers like myself and get us on-side, rather than fob us off and induce us to be sceptical of their claims.
10
co2isnotevil wrote: “Land measurements should only make up 30% of the samples anyway while the other 70% must come from ocean measurements.”
Here lies another mystery. HADCRUT is a homogenisation of land surface temperature records with sea surface temperature records. Why? Ships at sea have traditionally taken air temperature records, so why not use them? Sea surface temperature is more often than not different to air temperature at the same location, so it seems that CRU mixes apples with oranges as if they were the same fruit.
10
Joanne,
Have a look at this brand new Darwin station Data from Hadley CRU.
Darwin temperatures are located in folder 94 of a 3MB ZIP file of CRU temperature station data just released by UK Met Bureau.
These are the “adjusted” temperatures supplied by Hadley CRU and they do NOT match the IPCC GRAPH, either.
In fact they appear to show a cooling trend, and are exactly the same as the GISS Data.
See CRUTemps to download the zip file.
10
Rumble Mourdre: The death threats were shown to be a scam by pro AGW enthusiasts who wanted the public to think calm sensible sceptics had the same traits as the CRU ‘scientists’
10
It feels to me like we are getting bogged down.
My “complaint” about any/all of the data is this. In order to know if the planet is warming, we need to have ACCURATE data of past temps. It’s patently obvious that we DO NOT. Not even the sattelite data. Those things can’t account for variations in surface winds and have only been in operation for a blink of an eye. The Stevenson Screens are a dogs breakfast, ice core data have problems of chemical reactions/changes under enormous pressures. Tree ring data? well no comment necessary.
To top all that off, we have the infinate problem of a starting date, ie what is normal? This joints been turning for 4.5 billion years but the wags at GISS and CRU and BoM use 30 years in the 2nd half of 20thC as their baseline.
What if Thatcher was a doyen of the coal miners and she was anti nuclear? What if she gave the Royal Society millions to show that more CO2 would avert another little ice age and the “catastrophies” associated with that? I’ll bet London to a brick a programmer could use the exact same data sets we have now to show the planet cooling.
We are all caught up in a massive political/economic power play, thak goodness it’s all happening in an era of internet and fast easy communications, otherwise we’d all be STUFFED BY NOW by the vested interests.
If anybody thinks the real power players in this saga have the planets best interests at heart, I’m sorry to say you are dearly mistaken. If anybody thinks allowing an organization like the UN to take control of this issue is a good idea, I’m sorry to say you are seriously mistaken. And finally, if anybody thinks scientists are any more noble or honest than the rest of us and that all they say and present to us must be true, then I’m sorry to say you seriously are in need of counselling.
10
Most recent media statements report an average land and sea temperature combination. I am interested to know when they became the standad rather than land temperatures alone. Can sea temperatures from 100 years ago be reliable and if we look at land temperatures alone do they show the same warming trend. in other words what percentage increase is land and what is sea. Is ther a website that that can be seen.
10
I like algoreithm. Sky had a a loop on antarctica running all day yesterday(8 dec) that stated that temps had increased 3c, didn’t models predict cooling? Also in AIT gore said that when the ice melted in n us to create the great lakes it interrupted ocean cycles and kept n europe in an ice age for a further 600 years. So if the glaciers,greenland, the arctic and the antarctic all melt it is not warming we should worry about. Is it?
10
Jo,
Naughty naughty. Disingenuous defence. You’re not giving yourself the benefit of your own full quote:
No, what you said was:
You didn’t just jump to a conclusion, you pole-vaulted there and declared the accused guilty without the benefit of hearing evidence for the defence. Logic? no. Reason? No. Honest scepticism? No.
Popmpous Git:
The reference was not to Eschenbach’s analysis – which remains to be tested – but to this piece of conspiratorial mumbo-jumbo written by Jo and designed specifically to taint whatever followed:
That is not scepticism, it’s devious emotive rubbish.
If the facts are so solid, the example so clear, why does she feel the need to precede them with this?
Ask yourself that.
Same-old same-old politics.
10
Tony:
1. Oh really, where’s the evidence for this scam please?
2. CRU scientists are issuing death threats to sceptics now?
Pull the other one.
10
Hey Jo, the american express on your donation link doesn’t work, only visa and mastercard?
10
This kind of thing was my original suspicion.
Thanks co2isnotevil
10
I noticed this post by a Dominic White at WUWT:
“It appears you quote the explanation for the homogonisation results in your own entry. Have a look at http://www.bom.gov.au/climate/change/datasets/datasets.shtml which details how and why the data was homogonised (all the research is public). Their opening paragraph:
“A change in the type of thermometer shelter used at many Australian observation sites in the early 20th century resulted in a sudden drop in recorded temperatures which is entirely spurious. It is for this reason that these early data are currently not used for monitoring climate change. Other common changes at Australian sites over time include location moves, construction of buildings or growth of vegetation around the observation site and, more recently, the introduction of Automatic Weather Stations.”
No scandal at all, just a change in themometer housing in Aus. The resulting data set for Darwin is at: http://www.bom.gov.au/cgi-bin/climate/hqsites/site_data.cgi?variable=meanT&area=nt&station=014015&dtype=anom&period=annual&ave_yr=3“
10
Also I’d have thought that “we get some insight into just one specific example of how corrupt science can be” was treading a very fine line.
10
If thats devious emotive rubbish, what’s this?
10
Mattb: We know climate science is corrupt. Phil Jones and Tom Wigley have agreed those were their emails. We know the hockey stick was a miscarriage of science, and it is still defended by the NAS, Nature, and the IPCC. They are complicit.
And lastly, even if there was one change in temperature gear in Darwin, or even 2 or 3 changes, why is there a steady stream of adjustments, dozens of tweaks? Why does this collection of adjustments, like all the others on other equipment at other locations randomly correct for “biased cooling” and never biased warming?
10
A few points relative to the temperature anomoly plot at
1. The term “anomaly” is defined as “Deviation or departure from the normal or common order, form, or rule.”. I find it odd that this term would be employed to describe changing temperatures rather than, say, variation or deviation. Historically, change IS the rule for global temperature. Anomaly is a loaded term predisposing the reader with a sense of something wrong – he who controls the rhetoric frames the argument?
2. There is much focus on the “accelerated” temperature increase for the 1971-2000 but the period from 1910 through 1939 shows a comparable rate of increase when there was considerably less fossil fuel consumption than the later period – did anyone fret over global warming then?
3. Stranger to me is that the WWII years 1939-1945, during which heavy industrial output and fossil fuel consumption must surely have peaked and millions of tons of chemical explosives were expended, shows a negative temperature gradient of greater magnitude than either of the accelerating temperature periods before and after. To be my own devil’s advocate, perhaps the wartime activities were offset by reduced activities in other activities, yet this seems an interesting blip worth exploring.
10
I would suggest that significant changes, especially site moves, would mean you are dealing with two separate data sets.
I wonder whether these guys aren’t being dishonest with the data, just that they are confused about basic statistical analysis. What they really should be doing is analysing the trends for individual time series (unadjusted) rather than trying to artificially create a longer time series from discontinuous data.
I also wonder whether their calculations of the mean have changed. Back when manual measurements were made the maximum and minimum were read and the calculation of the mean was easy (add the them and divide by 2). With automation and measurements being taken at much frequent intervals, if they are adding all the measurements up and dividing by the number of measurements (I haven’t been able to determine if this is the case (can someone enlighten me?) then they are calculating a completely different statistic. It is quite conceivable that this latter measure would distort a trend line considerably.
10
Jo,
With regard to post 64, the word is “despicable”.
10
Grant:
Come on… they KNEW. It is a scam and certainly amazing that govs allow small groups of people’s data to create policy.
Well… NO MORE. The people need to demand that if PUBLIC policy is to be made, then the PUBLIC needs to see the data and all views first.
Swine flu, 9/11, AGW, etc., have all ties to gov and $$$$$$$.
It is obvious from the emails that they absolutely had an agenda and nothing was going to get in the way of falsifying data and making claims that a life giving gas CO2 is a problem is sheer nonsense.
10
This global cooling is breaking out all over the world!
10
The most important stuff from the leaked data was how the fraud was done.
Well the fraud and collusion to shut down peer review was a close second.
It’s all in now for the fraudsters …
10
Rumble Mourdre
You quote; ‘The greatest warming has occurred in central Australia (Murphy & Timbal 2008).’
A few facts first using Alice Springs as it does have long-term records.
The 30 year max av temp was 28.9C from 1881-1910 (PO site). The 30 year max av temp was 28.8C from 1971-2000 (airport site). Sites are only 9km apart and about 30m difference in elevation.
The highest max temp was 30.7C in 1880. 2002 had a yearly av max of 30.5C. Spot the warming??? I can’t.
10
Channel 10 Melbourne weather presenter just before 6pm last nite said something like: Melbourne is headed for its second warmest year on record and the last 6 months were the warmest ever (presumably meaning it was the warmest June-November on record).
I couldn’t find anything on this on the Channel 10 website. Perhaps this is line being developed to counter the lack of warming in the last 10 years.
A few months ago another pro AGW line on the TV weather was that in recent decades there have been vastly more heat records broken than cold records.
Can anyone point to data to counter this?
10
KDK “Come on… they KNEW. It is a scam and certainly amazing that govs allow small groups of people’s data to create policy.”
I was just being uncharacteristically (for a skeptic) charitable. And I was trying to figure out how you can homogenise data from two different weather stations (moving the equipment form one site to another constitutes a new site and new data series).
Niles: Your point about the term “anomaly” is extremely good. I have always struggled with why deviations have been described as anomalous. Another example of the post-modernist hijacking of commonly understood terms and attaching new meaning to it. Unfortunately when a logician argues these things with a CRUdite they get frustrated.
10
Rumble,
regarding your statement:
This sounds like the standard run of the mill situation for any organisation with an IT infrastructure. Just in case you haven’t got out lately, these sorts of stunts have been happening everywhere to all sorts of organisations and businesses.
The advice I have been getting is that this situation will only get worse over time for everyone.
So yes, there will be more hacks like the CRU hack – some for good reasons like this one, and unfortunately many for bad reasons in the years ahead.
To somehow try and imply that the poor climate scientists are being targeted by hackers more than many other organisation is bunkum. I would almost bet that they haven’t been targeted as much as say a Biomedical company would have, for example.
Hackers generally have the bias that “All data should be free”.
10
The mean maximum temperature for Darwin Airport (station 014015) is available here and looks like this:
The same BoM gives the “high-quality climate site data” for Darwin Airport (station 014015) here and looks like this:
The BoM’s raw data looks like Willis Eschenbach’s graphs, while the BoM’s high-quality climate site data looks like the GHCN/IPCC graphs.
So is every country’s Bureau of Meterology in on the “hide the decline” scam as well?
10
I should explain terms I have coined.
CRUdite – someone who is still in denial that the release of information from East Anglia University exposes shonky manipulation of data, efforts to frustrate opposing viewpoints and subversion of the peer-review process. These individuals are rarely individuals and are subject to “group think” and have a homing instinct for conferences. They are very similar in nature to the Luddites of the 19th Century. Crud is also a more genteel way of expressing their brand of science. Crud (create, read, update, delete) rights are granted them to their databases, and they make questionable use of “delete”.
10
Jo (re 64)
I agree, that’s devious emotive rubbish too.
But in raising this and putting up another graph you appear to be simply doing the magician’s “watch-my-left-hand” trick as your right hand continues to sneak away from making a direct response to my challenge to you to justify your unequivocal and biassed statement that the above is a “specific example of how corrupt science can be”.
It was a political slur: you played it fast and loose to secure your own political base, and you know it. Argument from authority: Jo says it, it must be so. Once again, you do not and cannot possibly know as yet that this is a valid, fair or reasonable conclusion to draw from the limited evidence you have available.
You tacitly admit this yourself when you ask:
And lastly, even if there was one change in temperature gear in Darwin, or even 2 or 3 changes, why is there a steady stream of adjustments, dozens of tweaks?
If you don’t know the answer to that question well, hey, I can’t take your pre-judged corruption claim seriously.
Ah, but we just “know” they’re all as bent as a dog’s hind leg, don’t we? That’s enough for us.
You have now responded defensively twice on this issue but you still have not got to the heart of the matter.
Come on, Jo, be a good egg – I’ll concede that we can all get a little carried away in the heat of battle and don’t always choose our words as carefully as we should. Maybe you could reassert that you’re personally in no doubt that this is an appalling piece of science only marginally above killing babies on the moral scale but concede that, well, it’s too soon to be sure and we need to wait and see.
Then we can all move on and watch with interest how this matter unfolds.
10
You don;t need to refer to the CRU emails jo… you say THIS is a specific example of corruption. That is pretty plain speaking. Corruption. Personally I’d have the lawyers looking in to it if I was at the BOM.
10
Grant…. if ever there was an example of “group think”…
10
Matt, Rumble,
You know, there’s a saying. What goes around, comes around. That being said, I’m not a real fan of ad hom’s, arguments from authority, hidden agendas, dirty politics and other distractions from either side of a debate. The only authoritative arguments I accept are those of first principles physics. and even these are not ‘settled’, as there’s always the possibility of a more comprehensive physical theory, that in the limit converges to existing physics. For example, Newton’s Law of Gravity is no less valid today, then is was before Einstein came up with General Relativity.
You may have noticed that the AGW skeptic talking points haven’t changed in the face of climategate. The only difference is that there’s now a lot more evidence of that which was suspected. Perhaps this has emboldened AGW skeptics and now you feel like you’re the ones being persecuted for your understanding of the science.
In the end, it will be what first principles physics says it is. If climategate tells us anything, it’s that trying to extract trends from sparse proxies has been shown to be an invalid approach. It’s become abundantly clear that the expected trends are so small, relative to natural variability and uncertainty, that if you push the error in one direction or the other, you can make the data look like whatever you want and still ‘technically’, not be lying. Of course, it all depends on the definition of lie …
George
10
I had this link shoved at me by someone I’ve been trying to convince that he’s wrong about AGW. His claim — this proves Climategate means nothing.
http://www.popularmechanics.com/science/earth/4338343.html?page=1
What scientist publishes in Popular Mechanics?
The author is Peter Keleman, professor of geochemistry at Columbia University’s Department of Earth and Environmental Science.
After pointing out all the problems at CRU he insists that it means nothing and global warming is still a big threat.
I’ve never heard of him. Anyone know anything about him?
10
Roy,
This guy seems to subscribe to the precautionary principle argument on the grounds that the science is too complex to understand. I consider this claim to be as bogus as the claim that the science is settled, which of course if it’s too complex to understand, can’t possibly be settled.
George
10
CO2isnotevil (re 81):
Couldn’t have described ClimateBeatUp better myself! Trying to extract trends from a few comments in stolen e-mails?: yes. Expected fraud/conspiracy trends so small?: yes. Making the data look like whatever you want?: yes. Sceptics still technically not lying?: I’ll be generous, yes. Approach invalid?: yes.
Thanks for this! A gem.
10
I may be wrong (there’s something you don’t hear from a warminista) but I seem to remember a monsoon failure about that time (2002) which may account for the spike in temperature in the Boulia, Qld region
10
I’ll take a different tack to most everyone else here…
Let’s assume that the adjustments are not a fudge factor just to make things look bad, but rather let’s assume that these are really needed, even though it’s not apparent to us why – in other words, we will assume that these people are doing the best they can with what they have and trying to do the best science they can. No bad motives assumed, just the opposite in fact.
The Darwin adjustment amounts to, IIRC, 1.9C / century. Since the adjustments are not made with reference to a known good, calibrated source, but are infered from the data itself (as well as meta-data for the site and other similar data from nearby stations), this needs must be an estimate. Let’s assume that the estimate is a good one. Even so, we do not know that the adjustments is perfect, even if it was – we are estimating a reasonable number. Nothing untoward yet.
However, because we are making an adjustment based on an estimate, we must inflate our uncertainty by at least the same margin as our adjustment. So our estimate of the trend at Darwin is now +1.2C/century +- 1.9C/century. Plus the uncertainty still needs to be inflated from this figure for measurement uncertainty as well – if we are only reading to 1C resolution, we’d need to add +-0.5C to that as well, which takes us to +1.2C/century +- 2.4C/century.
Don’t know about anyone else, but when the uncertainty is twice the trend, I’m not sure we have anything “alarming” going on – under those cirsumstances, I am concerned that we are even considering a $100+ billion change to the way our economy works.
What’s truely alarming is that if we change the way we do the calculations, we can come up with a different result from the same data. I would be curious to see the trend in the minimum data and the trend in the maximum data as well, rather than just the average. I’d like to know more of the stats than just the trend of the mean of minimum and maximum with no uncertainty.
10
Roy Hogue: Post 82,
Roy, here’s his Web Site if you want to get to know Him!!!
http://www.ldeo.columbia.edu/user/peterk
He’s an Alarmist’s Scientist…He depends on Government monies for a living…You don’t cut your own “throat” do you by NOT supporting the Governments efforts???
10
Neil Fisher: Post 86,
Neil, yes, it is alarming and when you stated this; a remark made by Professional Statistician William M.Briggs came to mind:
“Just because a Theory explains past data well it does not mean that it will explain Future data well. This is because it is “always” possible to create a Theory that explains past data perfectly or as close to perfect as We want to be!”
Interesting, and may I suggest that you read this quote a few times to let it sink into your Mind….
10
Rumble,
Will you at least admit that the science isn’t settled? If you can’t accept that the climategate leak shows how and why AGW science is on shaky ground, you can’t possibly deny that the claims of the science being settled are greatly overstated. The relevant theme portrayed by the emails, is the proactive exclusion of any idea, theory or data that’s in conflict with the cause.
George
10
There is only one thing to be done: put ’em out of business.
Every weather station in Australia probably has a climate realist near it. Go to your nearest weather recording station and put a tea candle in it, or a chunk of dry ice or drape a wet cloth over it or whatever it takes to unarguably screw up their temperature records. Meanwhile, we can all buy a thermometer and a note book. Then they will have to rely on the TRUTH: our note books.
10
Did I say the science is settled?
I hate that phrase. It’s a politician’s phrase. It’s an activist’s phrase. It’s got nothing to do with scientific discourse. It’s just politics – the science is never settled. To say otherwise is a misrepresentation of science. Even the speed of light, the universal constants are up for grabs! That’s the beauty of science.
The ClimateBeatUp emails tell me nothing about science. They may or may not tell me something about individual scientists – I don’t know: I’ll wait to see what investigations reveal. What’s the darned hurry in declaring the verdict when you haven’t heard only a fraction of the evidence? Why so quick to judge? Do YOU know better?
You know what bothers me most? The apparent lack of care or concern about the collateral damage that can be done and is being done to science by this freewheeling, no-consequences, spray-an-accusation-around attitude so may people seem to have. You’re getting into bed with forces you don’t even know or comprehend. Your fellow travellers are often odious to me and don’t give a fig for public interest or common good. Thieves, Intelligent Designers, oil companies . . . I don’t know who else.
Even though I am currently taking my medication, my heart sinks into an abyss when even dear Denny, who is so kind, says (87) above:
He’s an Alarmist’s Scientist…He depends on Government monies for a living
Well, okay, what’s the acceptable alternative? Corporate scientists who don’t publish their results, are paid to study only one thing and not subject to FoI laws? Vatican scientists? Greenpeace scientists? Creation Science Foundation scientists? National Front scientists. Give me a break!!!
The Western tradition of publicly funded science gives academics the right and freedom to express themselves freely, not subject to political and commercial whims. That’s why and how Lindzen and co can keep saying and doing what they do, regardless of whether they are right or wrong, justified or not.
Science – good science, public science – is a bastion of what is good and right and solid about our human world. It’s far from perfect but you should all stop acting shocked that it is performed by humans. They are not robots; get over it. Call them on their mistakes, sure! Pick them up on their biases, sure! Hold them to account, sure! Remind them that taxpayers foot the bill, sure!
But I hate, absolutely hate, the casual couldn’t-care-less slagging off of scientists and science that passes for debate in so many sceptic and political circles regarding climate change. It’s one of the remaining institutions that one can have much trust in, that is answerable to voters, that publishes its results, that holds them up to be tested, that is built on fact, observation, measurement, reasoning etc etc. Flawed yes but, well, der!
I will accept that at least a few people who post on this site have good intentions, have the longer-term interests of good science at heart. They don’t want to see it corrupted by politics. Great. I also accept that some scientists have good intentions out of public interest but have crossed the line into political advocacy on this issue and, mostly, I don’t blame them – it’s a dooozey.
But all this “gravy train” crap is so shallow, playing to prejudice and small-mindedness: here in Australia, annual science funding barely amounts to a blip on the Budget radar compared with the $90-plus billion we take in each year from resources exports, of which coal and iron ore are mighty chunks. Global trade is worth trillions.
You want Copenhagen delegates to sleep in tents and eat stale sandwiches, fine. Seems reasonable to me. But don’t give me hyprocritical garbage about ad hominem attacks unless you’re prepared to quit it yourselves.
Is the science settled? No!!! Is the science discredited? No!!! If you know the line to take down the middle of that, then please let the rest of us know.
In the meantime, people like Lindzen tell me that, yes, the planet is warming and yes, CO2 is a greenhouse gas that contributes to warming and, yes, human activity has resulted in C02 levels very suddenly rising to their highest levels in 350,000 years.
You think this is a good time to gamble? You think this is a good time to tie up or distract our scientists with FOI requests, conspiracy fantasies, break-ins, protests and nitpicking point-scoring? Fine, you go for it. Yap at their heels all you want. It’s a democracy and nothing I say will change your minds anyway.
Me, I want to see VERRRRY VERRRRY solid evidence, and I want to see it tested fair and square, that there is systemic corruption, collusion or falsehood in science before I take another step in your direction. It’s time sceptics playing the victim card. If we’re going to call crap for what it is, then let that be so regardless of who deals it out.
10
Sorry, typo above: I should have said:
It’s time sceptics STOPPED playing the victim card.
10
Matt
An interesting article. Most people fully accept that there is a great deal of science incorporated into the models but there are also a lot of assumptions made. What is indisputable is that forward predictions have been poor.
Remember back in 2001 the IPCC asserted that all natural variables were accounted for and we were looking at a .2C rise for this decade. It has happened because of natural variables that obviously were not accounted for – dear oh dear. Papers from Keelyside, Tsonis suggest that it could be 2015 or 2020 before warming recommences.
Of course we are told when warming resumes it will be with a vengeance because of the many “its worse than we thought” factors that have been discovered in recent years.
One of these factors is aerosols and in particular the warming properties of ‘black carbon’.If aerosols do not cool to the degree that was previously thought how do we account for the amount of cooling during the 1940s to 1970s, bloody natural factors again I suppose.
I often wonder if these ‘its worse than’ scenarios are a result of the cumulative failure of the models. For example if a model predicted arctic ice to continue to diminish after 2007 by 2009 you have a problem with a 25% increase. You could either accept there was a problem with the model and try to account for it which might mean downgrading sensitivity or make increasingly alarming predictions and hope that you got back on track. What would a ‘team’ player do?
10
Given the responses to the CRU disclosures it’s time alarmists STOPPED! playing the martyrs card
10
From Matt, quoting a possible legitimate reason for the adjustment:
Seems nice, but it does not fit the black line at the top of page (unless I greatly misunderstood the background, which is possible given lack of sleep and time to think this week). The Darwin data is from 5 stations (that’s what I read above, or is it just the A/P?) so it only takes a day or two to replace a thermometer shelter, and once replaced the new shelter remains consistent. That would impose a maximum of 5 step functions (and presumably in a tight bunch, I simply cannot believe that a schedule of maintenance replacements are spread over 40 years — totally implausible).
The black line above shows steady incremental adjustments over half a century. That just does not fit any theory regarding replacement of housings. The black line also shows single-year spike adjustments spread here and there, going in both warming and cooling directions. What did they do? Try the new housing one year, then decide they didn’t like the colour and send it back?
No, no, no… the adjustment data came from something else.
10
Actually, yes!
http://maps.google.com.au/maps?ll=-27.566,139.279&z=12
It’s been raining a lot through Central Australia and South Australia so you can expect it to look even freakier when the satellite image updates and it gets a bit of green and blue in it.
10
JoNova: ‘Halls Creek is inland, and there is a slight rising trend starting around 1920. About 1 degree C?’
Actually, there were two stations at Hall’s Creek The first, at Old Halls Creek [Latitude: 18.25° S; Longitude: 127.78° E; Elevation: 360 m], operated until the 20th May 1999. Yet the BOM only graphs the data up until 1951 – thereby jettisoning nearly half a century of data. Nevertheless, the data they use shows a mean maximum temperature flatlining at approx 33.4 degrees C. This may be seen at: http://www.bom.gov.au/jsp/ncc/cdio/weatherData/av?p_display_type=dataGraph&p_stn_num=002011&p_nccObsCode=36&p_month=13
The second station, at (New) Halls Creek Airport [Latitude: 18.23° S; Longitude: 127.66° E; Elevation: 422 m] opened in 1944 and is presumably running today. The data produced shows a mean maximum temperature flatlining at approc 33.7 degrees C. This may be seen at: http://www.bom.gov.au/jsp/ncc/cdio/weatherData/av?p_display_type=dataGraph&p_stn_num=002012&p_nccObsCode=36&p_month=13
Now, here we have the data from two stations separated by about 15 kilometres and 62 metres height above sea level. That the higher of the two in height shows the higher temperature may have something to do with its site (airports tend to have lots of lovely heat-absorbing tarmac/asphalt). Nevertheless, they both show flatlining annual maximum mean temperatures. One would therefore expect a homogenised graph of the data from the two to reflect this – ie: to flatline at about 33.5-33.6 degrees C.
However, this is precisely what we do not find. Instead, the data from the two have been crudely combined to produce an apparent century long annual mean maximum temperature rise from about 32.2 degrees C in 1900 to about 33.8 degrees C in 2009. This may be seen at: http://reg.bom.gov.au/cgi-bin/climate/hqsites/site_data.cgi?variable=maxT&area=aus&station=002012&dtype=raw&period=annual&ave_yr=T
As the late Bernard Levin might have said: ‘Not only is this nonsense, it is nonsense on stilts.’
10
Rumble,
Re post 91 and 92: I am a skeptic as you must certainly realize. I intend no offense to others; their debate is interesting, informative to me personally and certainly useful. But the only thing of real significance in all of this is the one claim made by global warming alarmists since they first appeared that CO2 will cause catastrophic warming of the planet. So we have asked for evidence that CO2 is causing warming, evidence that CO2 is even capable of causing warming. We have been given no evidence.
Numerous scientists have pointed out that CO2 is not even capable of the degree of warming claimed by the alarmists. I’m not qualified to pass judgment on the science involved. But others are and it appears to be sound science.
Now we have the CRU revelation that they didn’t have data showing the warming they wanted, so they fudged it up to show what they wanted. You cannot spin this any other way. I’ve read many of those emails and read some of the computer code. It’s a dead giveaway. They lied. They conspired to hide what they had done (delete your emails). They admitted to altering data before releasing it so as to fool the intended recipient. When someone says in exactly so many words that he’s dishonest, I think I’m entitled to believe him.
So far, they don’t even have warming in any convincing way. Much less have they evidence that CO2 is responsible for it.
Alarmists have made a very specific claim. We have asked for evidence to support it. No evidence is forthcoming. We, the skeptics don’t have to prove anything. We’re not making any claim. The alarmists have to prove their claim. So far they haven’t made an effort to do so.
CO2 is the one thing this whole insane mess is all about.
10
Rumble,
Since I was your strongest critic it behooves me to say thank you for your change in demeanor. You now argue your position rather than your original — if you’ll forgive my use of the term — caustic approach and show yourself to be well versed in your side of the debate. The change is commendable. Please keep it up.
10
Re my previous post (97): Why homogenise anything at all? Do the unused 48 year records from Old Halls Creek from 1952 to 1999 continue to flatline at 33.4 degrees C? If so, whence comes the justification for a rise of 1.6 degrees C over the past century?
Can anybody explain this?
10
FoxNews.com is reporting this morning from the Times of London that the MET office has been collecting signatures (now some 1700) in support of CRU in an attempt to counter the climategate scandal. At least one scientist is outspoken about feeling pressured to sign.
http://www.foxnews.com/scitech/2009/12/09/pressure-defend-climate-gate-scientists/
10
I am going out on a limb and a long way off topic here but this to me is an example of the two-facedness of believers in climate change.
Our major national daily the New Zealand Herald is unskeptical. Journalists and editors just seem to parrot what they are told. And we are being fed the usual calamitous predictions.
And then they report this kind of (to me anyway) contradictory nonsense. They are celebrating a “celebrity” bringing a tv show to NZ to be filmed. There is no analysis of the carbon footprint of the show, and just how wasteful such endeavours are.
Grrrrr. Can’t these people see how inconsistent they are?
10
Rumble,
Few AGW skeptics do not accept that CO2 is a greenhouse gas, that man has been adding CO2 to the atmosphere or that the climate changes. All AGW skeptics dispute the claim that man’s CO2 emissions are the cause of this change, or for that matter, even a significant contributer.
You have to ask yourself why someone like Lindzen (a climatology professor at MIT) agrees to all the factors that so many blindly accept means that AGW drives the climate, yet steadfastly refuses to agree that the AGW effect is significant. The reason of course is that he knows things about the climate that you don’t. Specifically, it’s all about the physics.
I want to see very solid data as well. But you must understand that good science requires that the burden of proof is on those who claim AGW is significant. not the other way around. That being said, there’s far more data that shows us that the effect of incremental CO2 is small, moreover; the actual physics points exclusively to this conclusion. Finally, the methodology used to develop half of the data used to justify the IPCC conclusions has been shown to be highly suspect. The other half of this data comes from GISS, which is also suspected of fudging data, as many at GISS, including it’s director, are part of the long suspected and recently uncovered cabal that’s actively infusing politics into climate science.
George
10
Rumble: “It’s time sceptics STOPPED playing the victim card.”
You’re joking, right?
Climategate emails – which, I might remind you, no-one has suggested have been faked – indicate that people who call themselves scientists have been fiddling with the data to support their own pet theory (instead of adjusting the theory to suit the data), hiding data that indicates much higher uncertainty than that implied by what they published (instead of saying “Sorry, best we can do”), supressing opposing opinion and theories (instead of arguing them on their merits), and hiding their data and methods to prevent replication and audit. No, it’s not “proof” of anything, let alone that AGW is a scam, but it’s a very bad look. Part of the reason why so many scientists not directly involved have previously supported these people is that they believed that none of these things could or would happen – that every scientist acted in a scientific way and did not and would not do these things, and further more that any scientist who learned of such behaviour in other scientists would “out” such behaviour. Yet it’s clear from the emails that we have reason to believe that all of those things DID happen, and further that people not directly involved knew about it and did nothing about it.
Then look at the reaction – first reaction was “it’s a storm in a teacup” and “it doesn’t matter”. When that failed, the next reaction was to try and deflect the whole thing and turn themselves into the victims – emails “stolen” by “hackers” who should be prosecuted for this “outrageous” action. Look at New Scientist’s so-called “investigation” – they asked the people involved, who said, somewhat predictably, “I didn’t do it!”, and NS says “Nothing to see here – move along”.
What’s truely amazing to me is the revelation that these people were getting significant funding from Big Oil. The same people, you will remember, who suggest that anyone who opposes them is funded by Big Oil and that that makes them “shills” and “puppets” that simply want to delay action and distort the scientific record. Oh yeah, they’re victims alright – victims of their own greed, victims of their own arrogance! They stole the gun and bullets, shot themselves in the foot, and are now complaining that the people they stole the gun from didn’t keep it secure enough so it’s all THEIR fault! Woe and alas to us – you didn’t stop us screwing ourselves, what a pack of mongrels you are!
Finally, compare the behaviour with the Piltdown Man episode or with cold fusion. The difference with AGW is that this time, they’ve very nearly made changes to the way the world operates – they’re very close to getting us spending trillions of dollars of public money based on their work. If anyone thinks this can be brushed under the carpet, they are dreaming. If anyone thinks that the political support they’ve gotten for their cause won’t evaporate as soon as it’s politically expediant, they’re dreaming. Politics IS perception – that’s the reality. The perception is not good, this won’t go away and they did it to themselves.
10
Let’s see now.
* EXHIBIT A – The overwhelming majority of the world’s scientists (including prominent contrarians, such as Lindzen and Spencer) are in pretty solid agreement that the world has become significantly warmer over the past century.
This agreement is not based on theory alone but on a vast array of observations from the real world – stuff you can see and measure. The last IPCC report (2007) listed them (yeah, yeah, you know all this, you’ve heard it all before. But it doesn’t hurt to be reminded of some of them) –
– Eleven of the last twelve years rank among the twelve warmest years in the instrumental record of global surface temperature (since 1850).
– The temperature increase is widespread over the globe and is greater at higher northern latitudes. Land regions have warmed faster than the oceans. Average Northern Hemisphere temperatures during the second half of the 20th century were very likely higher than during any other 50-year period in the last 500 years and likely the highest in at least the past 1,300 years.
– It is very likely that over the past 50 years: cold days, cold nights and frosts have become less frequent over most land areas, and hot days and hot nights have become more frequent.
It is likely that: heat waves have become more frequent over most land areas, the frequency of heavy precipitation events has increased over most areas, and since 1975 the incidence of extreme high sea level has increased worldwide.
– Of the more than 29,000 observational data series, from 75 studies, that show significant change in many physical and biological systems, more than 89% are consistent with the direction of change expected as a response to warming.
– Rising sea level is consistent with warming. Global average sea level has risen since 1961 at an average rate of 1.8 mm/yr and since 1993 at 3.1 mm/yr, with contributions from thermal expansion, melting glaciers and ice caps, and the polar ice sheets.
– Observed decreases in snow and ice extent are also consistent with warming. Satellite data since 1978 show that annual average Arctic sea ice extent has shrunk by 2.7 [2.1 to 3.3]% per decade, with larger decreases in summer of 7.4 [5.0 to 9.8]% per decade. Mountain glaciers and snow cover on average have declined in both hemispheres. Changes in snow, ice and frozen ground have with high confidence increased the number and size of glacial lakes, increased ground instability in mountain and other permafrost regions and led to changes in some Arctic and Antarctic ecosystems.
– There is high confidence that some hydrological systems have also been affected through increased runoff and earlier spring peak discharge in many glacier- and snow-fed rivers and through effects on thermal structure and water quality of warming rivers and lakes.
– In terrestrial ecosystems, earlier timing of spring events and poleward and upward shifts in plant and animal ranges are with very high confidence linked to recent warming.
– In some marine and freshwater systems, shifts in ranges and changes in algal, plankton and fish abundance are with high confidence associated with rising water temperatures, as well as related changes in ice cover, salinity, oxygen levels and circulation.
* EXHIBIT B – The overwhelming majority if the world’s scientists are in pretty solid agreement that CO2 levels have in a very short space of time absolutely skyrocketed since 1750 to levels not seen in hundreds of millenia, and that CO2 is a greenhouse gas. They’re also in solid agreement, because it can be observed and measured, that this extra CO2 has come largely from burning fossils fuels and other human activity. Likewise for other known greenhouse gases – methane and nitrous oxide.
* EXHIBIT C – A very substantial majority of the world’s scientists have looked at the observed evidence, tested it against all known theory and ploughed it through computer models. They conclude, in plain English, that there’s a very high probability that there is a strong correlation between all these events. They concede openly that they can’t be so sure about how the Earth system will respond to all the extra water vapour released by warming into the atmosphere, but experimental evidence and theory both suggest that in all likelihood it will make things warmer still. While we’re at it, we also can’t be sure how good our understanding is of other components of the Earth system that may or may not play a significant role: we think we’re strong on the long-lived greenhouse gases; we’re okay on ozone; we’re not so strong on surface albedo and total aerosols; and we’re weak on stratospheric water vapour from methan, linear contrails and solar irradiance.
All this certainly doesn’t PROVE that human activity is the CAUSE of the warming but, hey, after looking at it every which way, we’re as a conifdent as we can be and there is no alternative explanation known to science. Policy makers are asking us how to respond and we can’t make recommendations based on the unknown. This is the best we’ve got: you need a big ratchet down on the grrenhouse gases and you need to move as fast as you can to stop this thing from getting a real head of steam.
EXHIBIT D – A small minority of scientists say this uncertainty over water vapour/clouds is so great that if that’s the best you’ve got – shove it! It’ll cost trillions to change the global economy and if you’re wrong – and we’re dead sure that you are – it’ll all be for nothing.
EXHIBIT E – A small minority of well-meaning but exciteable lobbyists starts screaming helpfully: “The sky is falling! The science is settled! This caused Hurricane Katrina! We’ll all be ruined! Kiss your kids goodbye!” A small minority of well-meaning but exciteable lobbyists starts counter-screaming helpfully: “The sky isn’t falling! Look at the theoretical physics! It’s snowing in Texas! It’s natural. If we do what you say we’ll all be ruined! The kids will be just fine.”
CONCLUSION – Big business and big government sit back and do the sums, weigh up the options. Hmmm, this is a risk-management issue and our shareholders and electors would kick our backsides to the other side of Christmas if we didn’t take the most prudent course. On balance, doing nothing sucks and doing something is going to hurt but it will present a whole new bunch of opportuntities. Let’s make the best of it we can.
Bit like the global financial crisis, really.
10
Rumble Mourdre: Post 91,
Rumble, you ask what I’ve highlited in the above quote, “What’s the acceptable alternative?” Rumble, the accepted alternative is to let ALL Scientists and Professions to work “TOGETHER” to do “TRUE Science”. Science that is reviewed all those who can either “support” the findings OR “disprove” them..And provide proper research to back it up…Rumble, this is not being done!!! Because Climate Change is a Complex, Robust System, it takes years to get a handle on what is really going on…In Micro climate, Man can’t even get their predictions right for weather 5 days ahead..They have to change. Why? Because they use Computer Models that DO NOT have all of the parameters programmed into them..So something in Climate is ALWAYS missing…Plus what I call the “Weasel Words” used by Alarmists in their articles…They want to hurry and get the latest jump on what is going on.. and not waiting for more info to come in or be researched further…Rumble, it is sad…This should not have ever gone this far…I feel the Scientific Community is taking a “Big” hit on this whole AGW fiasco…it’s a sad time for “True Science”…Real Science…
10
Rumble,
OK. You spent a lot of words rehashing evidence of warming, spouted some precautionary principle justifications and jumped to several conclusions, but said nothing that establishes the kind of *UNUSUAL*, monotonic, climate changes that the warmists insist is destroying the planet, said nothing to establish that what little warming we are seeing is not a natural occurance or said anything that establishes a causal link between mans CO2 emissions and any real, perceived or imagined climate variability.
You also seem to be confused about what ‘most scientists’ really means, at least in the context of climate science. If you were to say physicists, engineers, chemists and those with the kind of hard science backgrounds that provides them with the ability to understand the science, an overwhelming majority of them have not bought in to the AGW science, although some adhere to the cause for political reasons. Most of the so called ‘scientific’ consensus is comprised of ‘eco-scientists’ who are predisposed to believe in AGW because it aligns with their personal agendas. Most of the rest are scientists who don’t have the time to look at it themselves and trust that those supplying science to the IPCC are correct and that their science is robust. This illusion has been shattered.
George
10
Rumble, I think that your last post boils down to this:
Science has observed that a correlation may exist between increased levels of CO2 and what appear to be increased temperatures.
Now, I think what the skeptics say is simply that this correlation if it exists doesn’t prove causation, and in any case, the temperature measurements themselves may be suspect.
That sounds reasonable to me, especially when backed by what sound like well reasoned arguments. And when my own observations don’t uncover any noticeable changes in my environment. So, rather than accept at face value the list of evidence you’ve rattled off, I’d like to hear the opposing view, and see that view seriously evaluated. And I personally feel MY heart sinking when I see the degree of effort put into preventing exactly that.
Mind you, I certainly don’t think there is any broad conspiracy. I think what we are seeing is simply human behaviour, possibly subverted by other interests.
People like to see patterns. In many cases, people will invent a pattern that suits their interpretation of events. And that interpretation is always a mirror of the person’s own internal belief system. Now it seems to me that many scientists, especially those in the environmental sciences, are very likely to be of a particular world view.
As well, people generally have a bit of a catastrophist disposition. Put simply, we all like a bit of excitement. You’ll recall the dire warnings about the impact of Y2K. The people MOST likely to talk up the likely impact were the people most passionate about Information Technology. Not because they were trying to manipulate the world at large, simply because they knew what the problems were, they could see a pattern in the problem, and they exercised their catastrophist natures.
So it is with AGW. If there is a generally accepted position that temps are rising due to rising CO2 and that man’s activities are causing the increase in CO2, I suspect scientists are likely to find themselves working with a certain view in mind. In this sense, I’d be very interested to see how many of the scientists who believe in AGW or who work directly in that field have a ‘green’ personal world view.
If this attitude or inherent belief exists, it is possible that natural events are then evaluated with this in mind. Or in other words, they begin to see a pattern and that pattern is informed by both world view and the general external intellectual and ethical framework that they work within.
It is quite possible that at any given point in time, a whole bunch of things are happening that taken together could be seen to fit a pattern. If we look hard enough, the natural variability in the various systems will always throw up examples of any particular trend. If we lump them all together and attribute causality as suits our preconceived pattern, then we are reinforcing that pattern. the more we look for it, the more it’s there.
So, my own gut feel is that what we are witnessing is not fraud or collusion or concensus. It is rather the realisation of a set of ideals and beliefs in the form of interpreted natural phenomena, based upon an erroneous correlation.
If I am wrong though, then it should be relatively easy to see the evidence for that, in the form of good hard data. I remain suspicious that we are not seeing that.
10
Rumble:
“- Eleven of the last twelve years rank among the twelve warmest years in the instrumental record of global surface temperature (since 1850).”
This is consistent with being at the “top” of a cycle. Maybe the “top” of several. You know the ones – at 30 years, 180 years, 1500 years, 100k years….
“Average Northern Hemisphere temperatures during the second half of the 20th century were very likely higher than during any other 50-year period in the last 500 years and likely the highest in at least the past 1,300 years.”
This likelyhood is based on data that has a “hidden decline” (ie proxies). Most temperature proxies have a correlation (R) to the instrumental series of 0.2 – 0.4, with a correspondingly small R^2. How you get from there to even “likely” is never explained.
“- Of the more than 29,000 observational data series, from 75 studies, that show significant change in many physical and biological systems, more than 89% are consistent with the direction of change expected as a response to warming.”
Once again, also consistent with being at the “top” of a cycle.
“Global average sea level has risen since 1961 at an average rate of 1.8 mm/yr and since 1993 at 3.1 mm/yr”
This is simply false – it is the result of comparing tide gauge data (1.8mm p.a.) with satellite data (3.1mm p.a.). If you check the tide gauge data you will find that recent decades are no different to previous ones, and are, if anything, showing a recent slowdown (although within normal variation)
“* EXHIBIT B ”
Since there is also undoubetly a relationship between ocean temperature and atmospheric CO2 levels (warmer water holds less disolved gas), which is cause and which is effect remains in doubt.
Since we know that “sinks” have sequestered roughly half our emissions even when those emissions varied by roughly an order of magnitude, what we don’t know is of more concern than what we think we know.
“They conclude, in plain English, that there’s a very high probability that there is a strong correlation between all these events. They concede openly that they can’t be so sure about how the Earth system will respond to all the extra water vapour released by warming into the atmosphere, but experimental evidence and theory both suggest that in all likelihood it will make things warmer still.”
Indeed there is correlation and indeed there is a plausable causal mechanism, but there is much debate about which is cause and which is effect – only data can resolve the issue, and it’s data we lack. Majority opinion is not fact.
“EXHIBIT D”
And indeed they have a point – as Spencer points out, if cloud changes are a forcing rather than a feedback, then a change of the order of 1% would be sufficient to account for the observed warming. Such a figure is beyond the resolution of the available data.
“CONCLUSION”
Big business cares only for the bottom line – if they can make money from it like they will from cap-and-trade, the’ll support it.
Politicians care only that they are in power and that it looks like they care about the rest of us.
I’m so glad you mentioned the GFC – cap-and-trade will succeed only in creating another bubble to be exploited by those with existing capital to the detriment of those without, while achieving nothing in terms of reducing CO2. If you truely believe we need to reduce CO2, you should oppose this legislation and instead propose the tax-and-refund system.
Climate change is slow, technology changes fast. In order to meet the target of a 50% reduction in CO2 by 2050 in Australia, we’d need to decarbonise at a rate at least 3 times higher then we’ve been able to achieve in the past. This seems highly unlikely and unless you have knowledge of specific proposals to meet this target, it’s simply going to reduce our standard of living and our freedoms to no good purpose – only 7% of our emissions are from domestic usage, the rest is due to industry (mostly mining and other high emissions industries). That means our REAL per capita emissions are 10 times lower than the often quoted figure. Unless we can “export” our emissions to those who buy our “product”, we will simply be looking for places to “export” our jobs and economy to.
In short we CAN afford to wait – we do not need to force change, only encourage it. Example: we have recently seen whales entering Sydney harbour, which is ample evidence that it cleaner than it has been in a long time. This was not achieved overnight, and was not set as a target, but it happened none-the-less. We WANT a cleaner environment and we are getting it. The ONLY reason people want this is because they have the wealth to support it. Taxing people back to poverty for trying to live will make things worse, not better, as is amply evident for those who care to investigate the matter.
10
Dear Neil:
Humpback and southern right whales disappeared from Sydney Harbour because whalers came very close to hunting them to extinction. It’s hard to credit now, but our forebears lit their homes with whale oil. One day they’ll look back and wonder why we did it with coal.
Whaling finally ceased back in the 1960s (except for subsequent years of cheating by the Russians) as the result of a far-sighted international agreement. While nobody could actually prove at the time that whaling was threatening whales with extinction, yet all the available observational evidence and inadequate ecological theory supported that notion (we can only wonder today how the poor darlings reached any statistically valid conclusions without the benefit of satellite data). In time, left to their own devices, the whales came back. I know this is only correlation.
Sydney Harbour is cleaner today as the result of similarly far-sighted decisions made in the 1980s to dump the city’s sewage far out to sea, instead of sufferig the embarrassment of watching little brown blobs wash back onto its golden beaches in a gorgeous swirl of E. coli. Some folks way back in those distant dark days fought against the proposal, saying the cost would cripple the city and that the hike in water and sewrage rates would mean that pensioners would die of dehydration because they’d be too scared to turn on a tap. But the community decided in favour because, well, they had the wealth to support it. Believe it or not, they actually did set targets for water cleanliness and had to publish the data.
“Taxing people back to poverty” is, I’m sorry, pure alarmist pollywaffle.
The modest initial target of 5% reduction in the Rudd Government’s proposed ETS amounted to less the half the impact on GDP of the introduction of the Goods and Services Tax (which, if you recall, added 10% to the price of almost everything overnight). Let’s say we shot straight for an ETS target of 50% and GDP took a massive backwards hit of, say, 15%(for argument’s sake only – I don’t know the actual figures).
Wow! That sounds really bad. But our actual cumulative GDP growth over the past five years has been, you guessed it, about 15%. So you’re saying this mad crazy reckless scheme is going to plunge us back to the Stone Ages of 2005 living standards? Oh Lord, how will we ever cope?
10
Tel in 95 I’d answer but first up I’m comparing the graph at the top of this blog with the equivalent graph at WUWT “GHCR Raw and Adjusted Temps Darwin Airport” and they are quite different, in that the black line for the “adjustment” is much much higher on this site. Jo could you check that and explain the difference cheers?
Your graph claims an adjustment of 2.4 degrees to get from -0.7 to 1.2 trend.
10
Woops, poor old Willis made a bad blunder. Another conspiracy down in flames.
I notice Deltoid is now accusing Willis Eschenbach of “lying” about this. They’re all at it now.
Jo, perhaps you could post this graph of the Bureau of Meteorology’s high quality climate site data for Darwin Airport?
The adjustments are explained here by NOAA
As Deltoid notes, the authors explain that:
A great deal of effort went into the homogeneity adjustments. Yet the effects of the homogeneity adjustments on global average temperature trends are minor (Easterling and Peterson 1995b). However, on scales of half a continent or smaller, the homogeneity adjustments can have an impact. On an individual time series, the effects of the adjustments can be enormous. These adjustments are the best we could do given the paucity of historical station history metadata on a global scale. But using an approach based on a reference series created from surrounding stations means that the adjusted station’s data is more indicative of regional climate change and less representative of local microclimatic change than an individual station not needing adjustments.
10
The fraud is unravelling. Soon everyone will know. End of MSN. Long live the internet, we would have been doomed without it.
10
This could all be answered very quickly by presenting WHY the adjustments are made. If the nice black line has a good factual basis – just tell us what it is.
SIMPLE.
If the reason for the adjustments is not presented, the NATURAL response is to wonder why. Saying we are not smart enough to understand is not a suitable response.
Oh… and the university in the town where I live offers courses in environmental management. Run by the arts faculty. No science required to enrol, and none taught as part of the course. You HAVE TO WONDER at the wisdom of such action.
10
Re: the temperature mean for Wyndham port,
It looks to me as though something happened to the instrumentation or recording methodology between 1940 and 1950 – historical records need to be checked and nearby stations (if there are any) need to be cross-referenced.
Taking the two parts of the data separately, 1900 – 1940 and 1944-1970, each of these regions shows a warming trend. If there was a historical instrumentational offset introduced at 1940-41 then the whole graph shows a warming trend of ~2 degrees. If not then the average rise (or fall) is as you say, zero. Without this information, no conclusion can be drawn from the raw data.
It is a rigorous stance to be sceptical of the raw data too!
10
Further to (112):
First paragraph on Deltoid:
Willis Eschenbach caught lying about temperature trends
Category: Global Warming
Remember how the New Zealand Climate Science Coalition made the warming trend in New Zealand go away by treating measurements from different sites as if they came from the same site? Well, Willis Eschenbach has followed in their foot steps by using the same scam on Australian data. He claims that for Darwin “the trend has been artificially increased to give a false warming where the raw data shows cooling”.Etc.
Jo if you are so sure of this case why don’t you cross swords with the folk there?
10
WUWT also claims an adjustment of 2.4 degrees with a few peaks hitting 2.5 but they have a different scale on the RHS of the graph so the appearance is a bit different. The numbers are as close to identical as I can make out.
10
Rumble: “The modest initial target of 5% reduction in the Rudd Government’s proposed ETS amounted to less the half the impact on GDP of the introduction of the Goods and Services Tax (which, if you recall, added 10% to the price of almost everything overnight). Let’s say we shot straight for an ETS target of 50% and GDP took a massive backwards hit of, say, 15%(for argument’s sake only – I don’t know the actual figures).
Wow! That sounds really bad. But our actual cumulative GDP growth over the past five years has been, you guessed it, about 15%. So you’re saying this mad crazy reckless scheme is going to plunge us back to the Stone Ages of 2005 living standards? Oh Lord, how will we ever cope? ”
Hah! Our targets are based on emissions levels from 1990, and our cumulative GDP growth since 1990 has been about 60%. Let’s call it 50%. So to get to a 50% reduction on those levels, we’d need to reduce our emissions by 66%! Even more if we still want GDP growth over the next 40 years. If we assume that our levels under BAU would have increased by 66% over the next 40 years – which is likely a gross under-estimate – our “50%” reduction target is actually more like 80%, and an 80% reduction is more like 95%. To meet the KRudd targets, Pielke Jnr estimates we’d need to de-carbonise our economy at the rate of around 5% p.a. Doesn’t sound too hard, does it? Except that the best we have done over the last few decades is around 1.3%, so we would need to at least triple the best we’ve done to date. World’s best practice in decarbonisation has never, ever exceeded 2% – not once, anywhere! Yet we think we can more than double this without any plan except to suggest that “the market” will take care of it. It’s a grand target and a very nice gesture, but it will never be met unless we “purchase” carbon offsets from poor people – in other words, we’ll be preventing the poorest people in the world from having electricity at all so that we can have a 42 inch plasma and a watch it in air-conditioned comfort. Oddly enough, this is being touted as the “right and moral” thing to do. Note that I’m not suggesting we shouldn’t help these people – just the opposite, in fact. We should be helping them lift themselves out of poverty in exactly the same way we helped Japan and other asian nations out of it – free trade, not a handout designed to salve our own consciences while helping only to keep them dependant on our generosity.
10
The problem with individual station data is that temperatures all over the globe appear slightly chaotic. The NASA satellite data presented pictorially shows areas on the globe warming and cooling. Somehow that computes to a single number.
NASA 1997 on accuracy of satellite data:
http://science.nasa.gov/newhome/headlines/essd06oct97_1.htm
Global temperature data:
http://data.giss.nasa.gov/gistemp/
Reporting of “temperature anomaly” rather than “temperature” appears to allow an increased perception of warming in recent times, when compared to the Earth’s complete historical record. A more sensible scientific approach would compare current temperature to the lifetime Earth global mean temperature, but that would not raise alarm bells.
10
I just noticed the global temperature data reported is based on land-based measurements. There is a link from the page on satellite data to satellite temperatures over “your house” but the link is now broken and I can’t find any satellite data available now …still looking. The one small graph on the 1997 page appears to show a fairly stable temperature record.
10
(from http://science.nasa.gov/newhome/headlines/essd06oct97_1.htm)
“Unlike the surface-based temperatures, global temperature measurements of the Earth’s lower atmosphere obtained from satellites reveal no definitive warming trend over the past two decades. The slight trend that is in the data actually appears to be downward. The largest fluctuations in the satellite temperature data are not from any man-made activity, but from natural phenomena such as large volcanic eruptions from Mt. Pinatubo, and from El Niño. So the programs which model global warming in a computer say the temperature of the Earth’s lower atmosphere should be going up markedly, but actual measurements of the temperature of the lower atmosphere reveal no such pronounced activity.”
10
Neil Fisher
Spot on!
10
The internet archive has some of the missing pages. It appears NASA satellite data is suffering from political censorship.
“http://web.archive.org/web/20070214041401/http://wwwghcc.msfc.nasa.gov/MSU/msusci.html”
10
This site has some great information:
http://www.john-daly.com/
lots of non-urban temperature stations:
http://www.john-daly.com/stations/stations.htm
This one demonstrates urban heat island warming in australia not present in rural areas:
http://canadafreepress.com/index.php/article/17766
10
Jo,
I can attest to the vast changes at Cairns airport – I was transferred there in 1984, just as they were extending the airport and worked right next to the tower, where the weather station was housed. I was Manager for Ansett Air Freight and when I arrived the new airport hadn’t opened. After working at Tullamarine I thought I had landed in Heaven – 4 domestic flights a day and one international flight a week was all we had to handle.
After the new airport opened, the growth, was explosive – at one stage my freight shed was handling 12 domestic flights a day and 60 (yep that’s 60) international flights a week – the terminal was built to handle both domestic and international flight for a projected 25 years, in fact the growth outstripped the facilities in less than 5 and a new separate international terminal was built alongside – adding even more acres of concrete to the previously extended runway. Our engineering base was situated next to the weather station and jet engines were run up for testing there constantly blowing heated air right over the instrumentation – do I believe that any increase recorded was due to Global Warming? Do I hell Cairn grew at a faster rate than any other area in Queensland during that time and the airport was the instigator of it all.
Talk about an urban heat sink – it was more like and industrial furnace, until the pilot’s strike in 1989 put a brake on growth – up until that point it had grown to the 4th busiest airport in Australia – there is no way that couldn’t have an affect on readings.
10
I became a “sceptic” a number of years ago when NASA published an article on how the ice caps on Mars were melting. Unfortunately I did not keep a copy of the page and have not been able to find it on webarchive.
My simple thinking said “OK, icecaps on Earth are melting. We are being told that our fossil fuel use is causing this and up to this time I was concerned. But there is no way our pollution would cause Mars icecaps to melt so maybe we are not the cause here”
Since NASA has been shown to delete inconvenient data recently, my guess is that they also did that to this page.
What I now hope, is that someone else will remember seeing this in print and will publish this article somewhere.
10
Everyone has their favorite way of using the internet. Many of us search to find what we want, click in to a specific website, read what’s available and click out. That’s not necessarily a bad thing because it’s efficient. We learn to tune out things we don’t need and go straight for what’s essential.
http://www.onlineuniversalwork
10
http://winteryknight.wordpress.com/2009/12/05/what-do-the-leaked-cru-e-mails-really-prove-about-global-warming/
You remember the “Very Artificial Fudge Factor”? The array called “valadj”? Knight puts it onto a table of years, which I’ll borrow:
Not too far different from the black line above, including the little negative dip in the 20’s and 30’s…
Any stat-nerds want to knock together a probability estimate that some random piece of computer code somewhere in the UK (code that the RealClimate crowd claim was only used for testing) would be a close fit to the historical error of a thermometer in Darwin?
Ye Ha! Boys, we’ve struck consensus.
10
I’ve been through a few of the explanations of the adjustment process:
http://www.ncdc.noaa.gov/oa/climate/ghcn-monthly/images/ghcn_temp_overview.pdf
and also
http://reg.bom.gov.au/amm/docs/2004/dellamarta.pdf
Their procedures should always result in either a step function or the sum of a small number of step functions. There is no part in the procedure that inserts ramp functions or anything similar to that. What’s more, the step functions cannot be closer than 10 years to each other for a given site.
Thus there is absolutely no explanation available for the ramp-like period between 1940 and 1980.
This is an admission that the process is not repeatable and that each researcher applies his/her own judgement. The adjustments made by Torok and Nicholls (1996) did not include archived documentation of their justification, not even so they could be understood again in 2004 (a mere 8 years later).
One more example of lack of reproducibility, lack of documentation and no way to trace back where an answer came from.
10
Cash Making Opportunities – The Beginning The working life is already tough enough, but the worries of being out of work was even tougher. The unsecured working environment have prompted me to search the internet for an alternative source of extra income so that I could learn how to Make Money Work for me and be Financially Independent. I listed down a number of Free Internet Business Opportunity Ideas while researching ways how people earn money online while working-from-home…….
onlineuniversalwork
10
Hi,
Took a look at Birmingham UK weather station data recently released by the UK Met Office. This shows a 1Celsius rise in temperature between 1950 and 2000 if you look at the annual means. But I looked at the monthly means and found that December showed no warming but July and August showed warming greater than 3Celsius over the same period.
What?
But then I realised that the weather station is Birmingham ELMDON. That’s the home of Birmingham International airport. So I thought “Could high passenger numbers in the summer months be the cause of the warming?”. Well here are the approximate figures, passenger numbers vs. temp gradient over the period 1950 to 2000:-
Jan “560,000” 2
Feb “600,000” 2.6
March “730,000” 3.4
April “700,000” 0.8
May “877,000” 0.4
June “900,000” 0.4
July “1,000,000” 2.8
August “1,000,000” 3
Sept “960,000” 1
October “844,000” 0.4
Nov “600,000” 0.5
Dec “500,000” 0
You’ll notice that the months with the highest warming trend correspond to the highest passenger numbers – obviously relevant in 2000 but not so relevant in 1950 I imagine. December has the lowest passenger figures and shows no warming trend over the 50 year period.
Conclusion I came to was that the only clear warming trend over the period 1950 to 2000 was due to increasing passenger numbers at nearby Birmingham airport during the summer months over that period.
Perhaps you could take a closer look at your Australian airport sites showing warming and see if they correlate to increasing passenger numbers over the period of interest, both by year and by month. Naturally your busiest months won’t be the same as for us in the Northern Hemisphere of course.
10
Check the correlation of global temps with US aviation fuel use since the beginning of air travel 1926.
http://i629.photobucket.com/albums/uu20/blouis79/globaltemp_aviationfuel.png
Correlation is way better than forcings from greehouse gases and feedbacks from clouds (eg Linden Choi paper 2009)
I’d like to know how much calibrated equipment one would need to compare airport weather station temperatures with temperatures in the suburbs.
10
I just want to leave you a quick post to thank for your website!
I really liked your webpage!!! Would you mind whether I placed up a backlink from my site to your website?
Keep up the super work! thanks!
Zachary
20
[…] ever records” broken lately: If you ignore all the inexplicable adjustments (like these in Darwin) and forget that temperatures have been rising for 150 years before carbon started to be pumped […]
10
[…] Darwin records artificially adjusted by over 2 degrees celcius up! (see pic above from WUWT). More here […]
10