If there was enough money, fame and power on the table (think seismic proportions, money that moves the economic landscape), would it be possible to take a small unproven scientific theory as an excuse and, with the best PR teams in the world, promote it, support it, and make it appear unquestionable?
If it were cloaked in the most “innocent” of motives, and shrouded in terminology that veils the truth, would it not run unchecked for years, unless some big vested interest opposed it? And if there was no particular big vested interest to oppose it, isn’t it possible that if the only harm it causes is to the giant disorganized mass known as humankind, there would be no committee of humankind to check its momentum.
On Watts Up tonight, we get some insight into just one specific example of how corrupt science can be. It’s yet another day in the history of the climate-scam where people may say years from now… remember that night we got the news about Darwin? Thanks to Willis Eschenbach’s dedicated analysis.
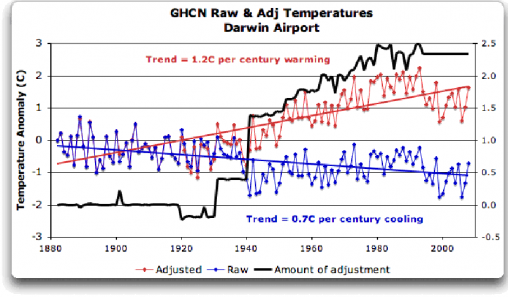
The blue line is the raw unadjusted data from Darwin. There are five stations there and their records are a very tight fit. It’s unusual for all five stations to agree with each other. Yet one of the three top climate centres in the world has “adjusted the data” using corrections that are graphed in black. (More artificial adjustments?) The raw data shows a trend down of 0.7 degrees C per century. After adjustment, the data “shows” a trend up of 1.2 degrees warming per century. It’s the scale of this shift that is so brazen. We’re supposed to be looking for a rise of one fifth of a degree per decade, and that statistical adjustment gave us half that rise.
Could Darwin be a local anomaly?
If Darwin had some freak local conditions, then we would expect to see the raw data in graphs from other top-end towns as trending much higher. Here are the graphs for Wyndham, Derby, Halls Creek and Broome. The graphs are from WA Climate Net, an excellent data set. Direct, Broome is 1100 km from Darwin, or 690 miles. (By road, it’s 1876 km from Darwin). (Thanks to MapCrow for the distances). I thought I would post these graphs to give people a rough idea of the historical warming across the far tropical north of Australia.
Western Australia
none there
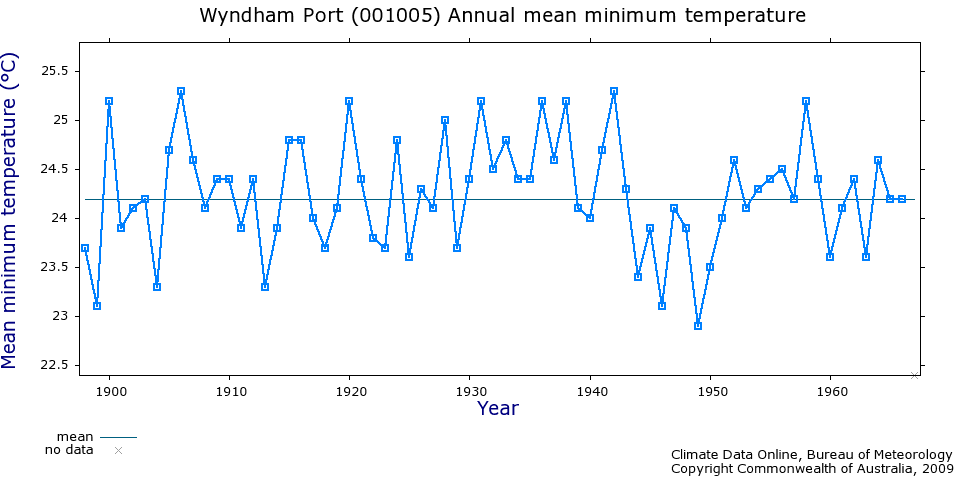
Global Warming missed Wyndham too.
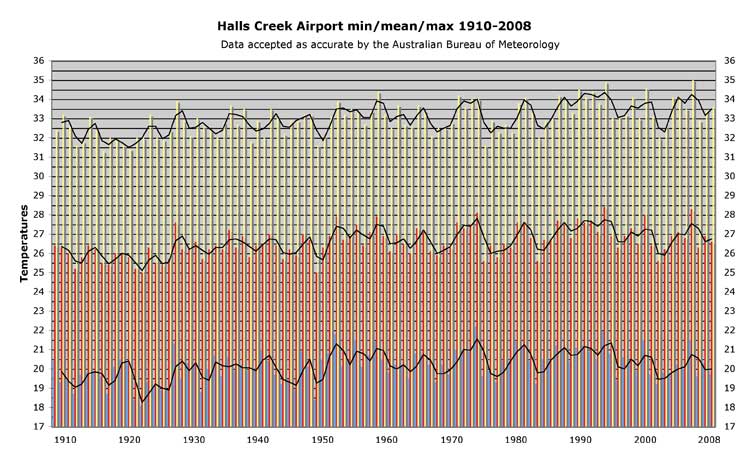
Halls Creek is inland, and there is a slight rising trend starting around 1920. About 1 degree C?
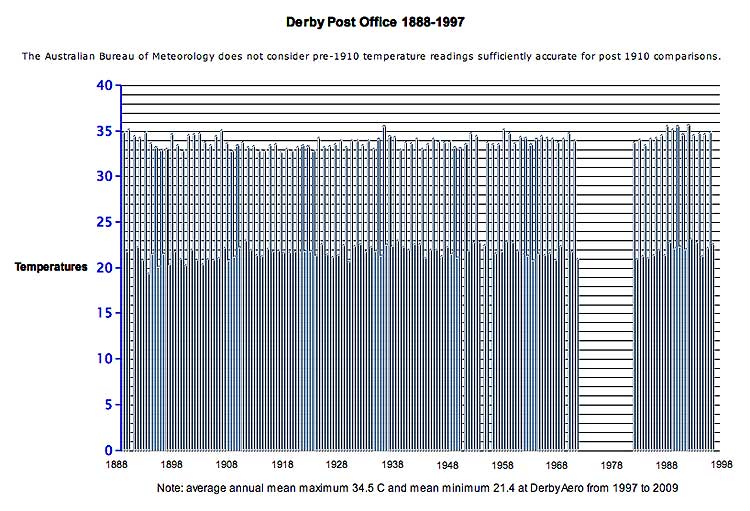
Derby is coastal, and again, no global warming…
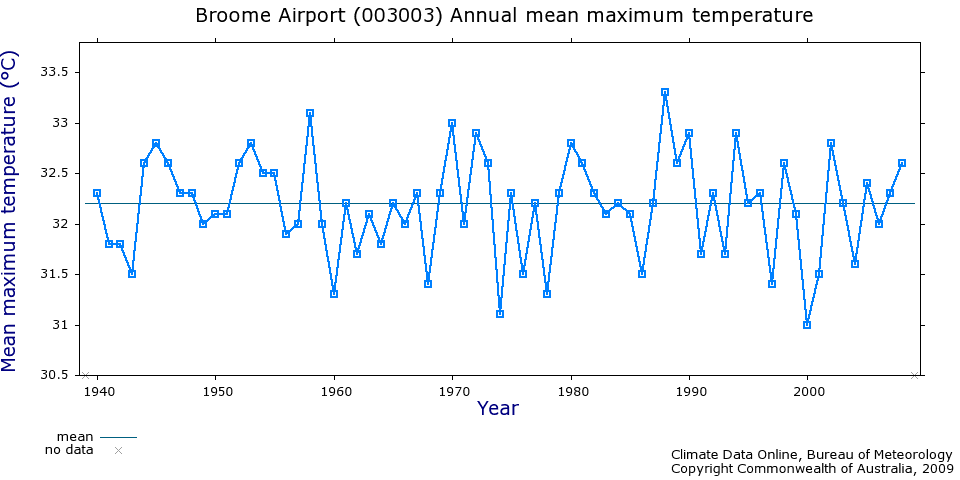
Broome is… running smack on average too.
These towns span thousands of square miles, and yet there is nothing to suggest major warming in any of the coastal ones and only a slight climb in the inland town. Nothing large enough to drag the average for the region up.
David Evans and I posted a joint paper about six weeks ago “The Future of Climate Alarmism is Bogus Statistics.” It all seems so tame now, but this was before ClimateGate, and before today’s revelations. The bogus statistics were there all the time.
Just for a looksee, I alsoo went searching for the warmer tropics in the Northern Territory and Queensland. What I found was a mixed bag, but long records at outstations (without major airports) showed that global warming appears to have more effect on computers at NOAA, than on the northern part of our landmass. There is some evidence that it affects airports too.
Tropical north Australia
…
Northern Territory
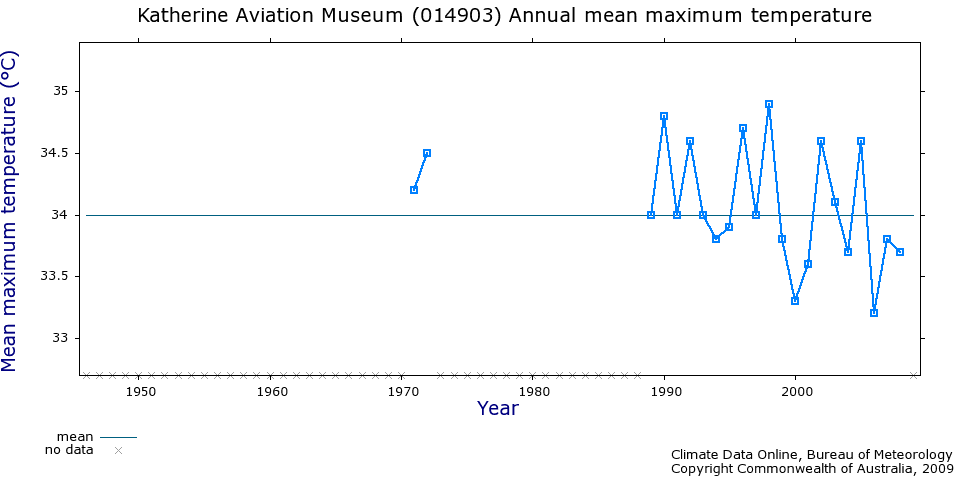
Katherine aviation museum (that’s right, there is hardly any data from the Northern Territory over long periods).
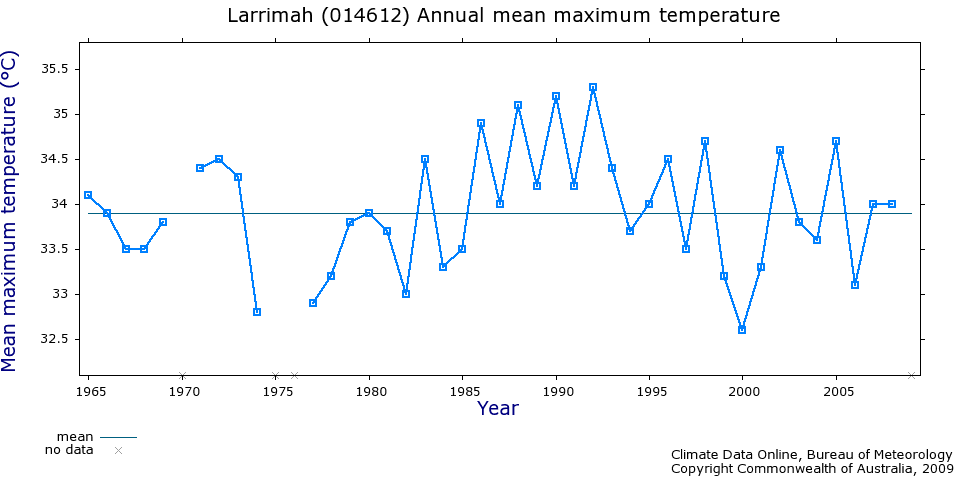
Larrimar NT (1965 – 2007)
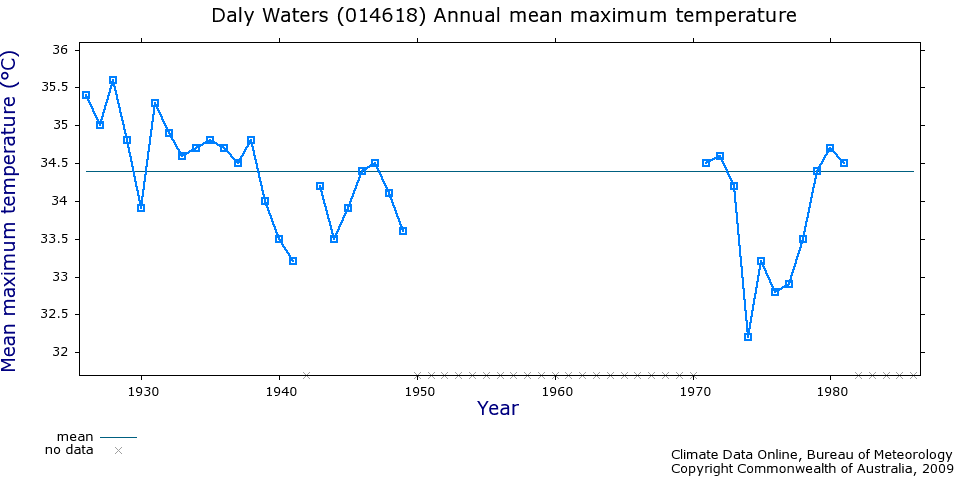
Daly waters (1930 – 1980) Cooling trend?
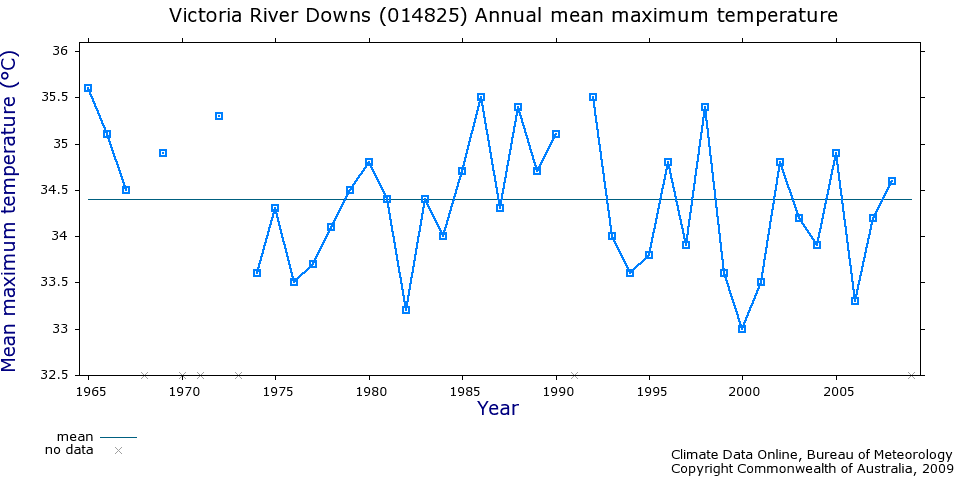
Victoria River Downs, NT, no warming since 1965 – 2009.
Queensland (West)
…
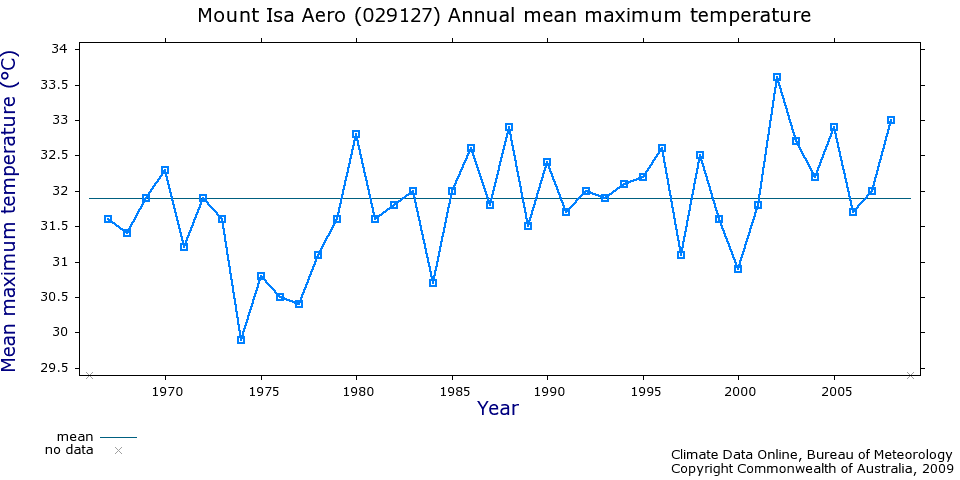
Mt Isa, Queensland. Another airport with a rising temperature, but it matches the towns far to the west and south. Perhaps it’s a real effect? (See Camooweal and Urandangi) But it’s also near Julia Creek (unfortunately missing data) and in the same quarter as Boulia, which has a long term record which is more complete than most of the others, and yet shows no warming.
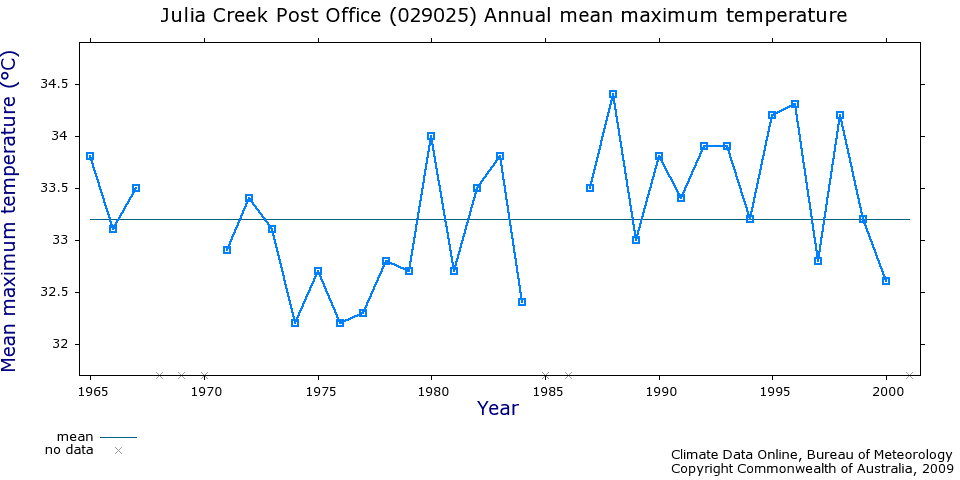
Julia Creek (1965 – 2000)
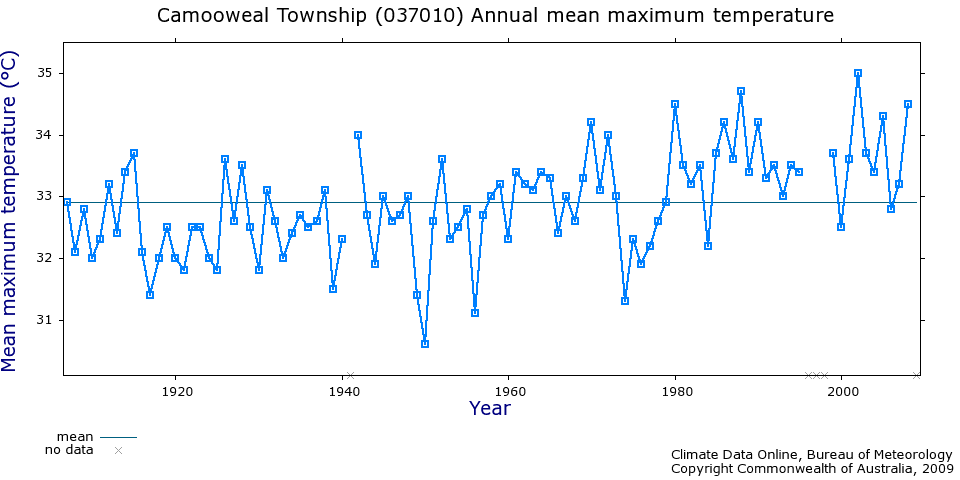
Camooweal does appear to be warming. It’s a small town on the border of the Northern Territory and Queensland
…
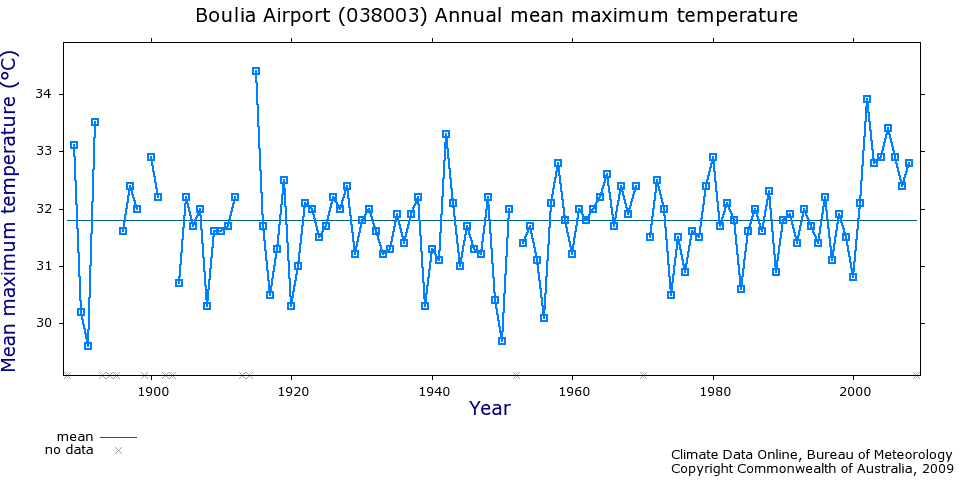
Boulia, Qld (More info here, that map tells you a lot…) An airport with no warming and long continuous records – 1886 – 2009!
Latitude: 22.91° S Longitude: 139.90° E (Just in the tropics).
…
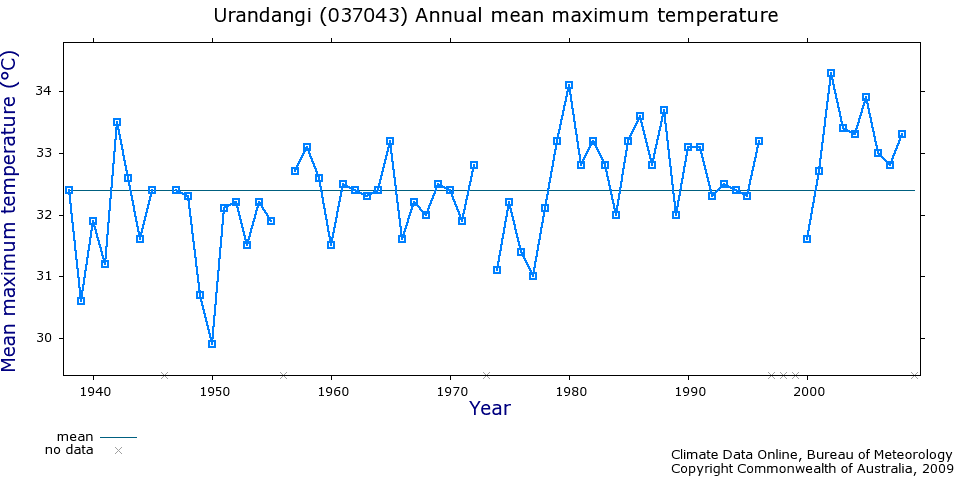
Two cases of warming! Urandangi Qld, 150km from Mt Isa on the border of Queensland and the NT ( yes, inland, south of Camooweal).
Queensland (East)
…
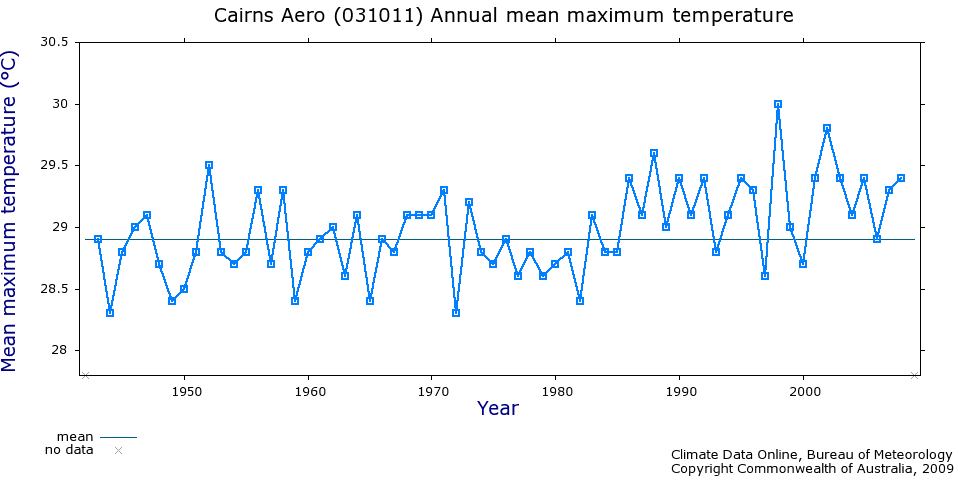
Cairns Airport – – another airport with more traffic and larger areas under concrete?
…
…
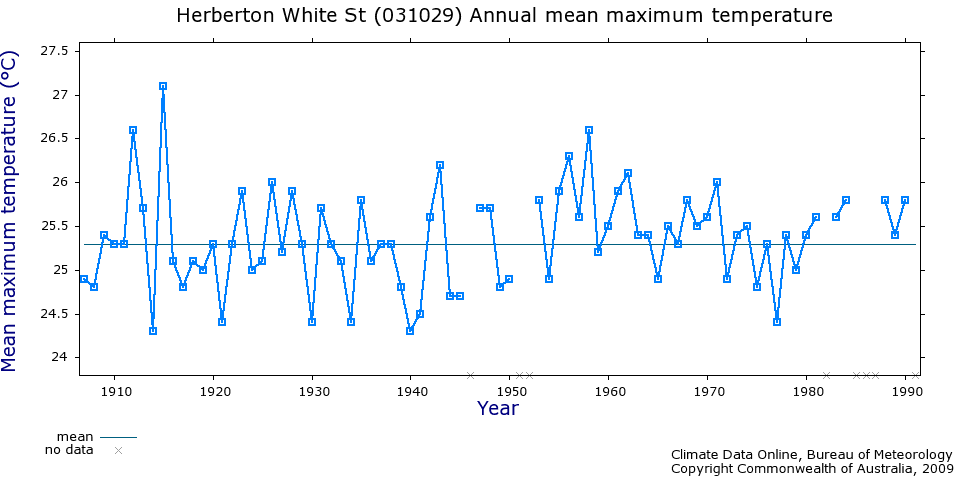
Herberton Qld (1910 – 1992) No warming in Herberton, and it’s about 100km from Cairns.
………
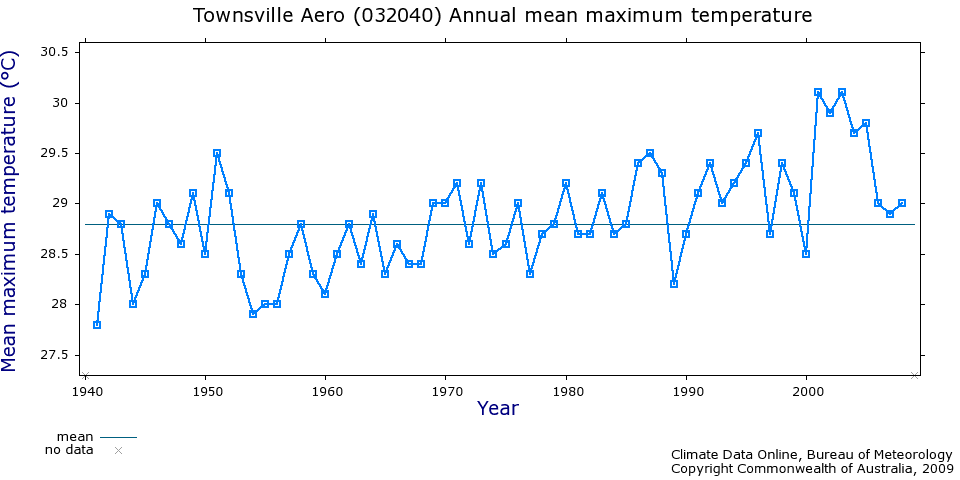
Townsville Aerodrome shows a clear rising trend since 1940
…
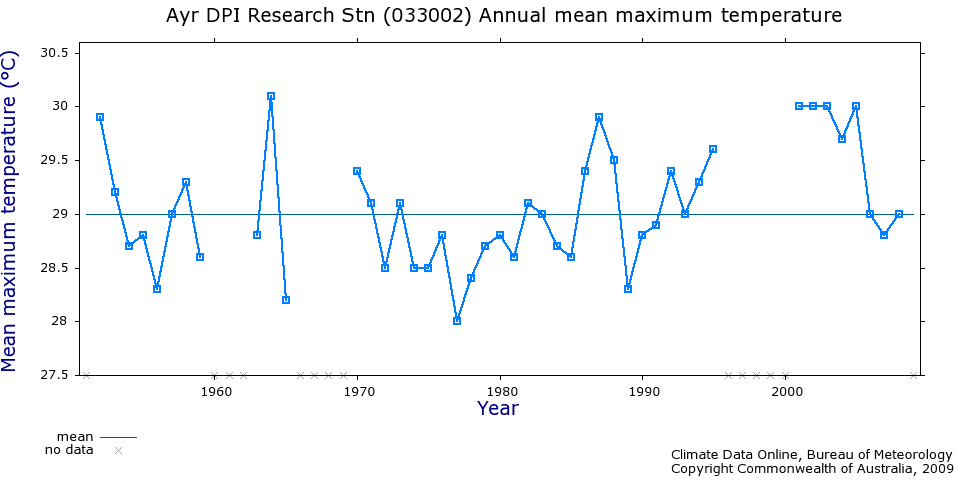
But Ayr Research Station 70 km away shows no warming during the same time period (1950 – 2009).
Does …..
I generated these graphs using the Bureau of Meteorology website, and there are more sites there to look at.Perhaps you can find the missing warming locations across the vast north that would bring the average up? Is there any way the official calculated averages for northern Australia could reflect the data we have on the ground?
UPDATE: This is the graph from the IPCC (As from Watts Up). You can see this on the big page within AR4. The IPCC uses the GHCN to show Northern Australia is “warming”.

UPDATE 2: (Dec 21). Watts Up have revisited this in more depth.