Frank Lansner’s first graph surprised me. It’s well known and often quoted that sea levels have been rising by 2-3mm a year every year for the last 20 years. But it’s not well known that the original raw satellite data doesn’t show that at all. What astonished me was the sea levels first recorded by the Topex Poseidon satellite array showed virtually no rise at all from 1993-2001. Surely not, I thought. I asked sea-level expert Nils Axel-Morner, and he confirmed: “Yes, it is as bad as that.” Now, given that Envisat (the European satellite) showed no rise from 2003-2011 (until it was adjusted) that means we have almost 20 years of raw satellite data showing very little rise. We thought satellites would finally give us a definitive answer on sea levels. Instead, like the tide gauges, and every other tool available to mankind, apparently satellites systematically underestimate the rising trends. And despite the speed of light being quite quick and all, it can take years for the data to finally arrive. Sometimes 4 or 5 (or 10 years) after the measurement was made scientists “discover” that it was wrong. Now of course, any one of these adjustments could be for very legitimate reasons and give us results closer to the truth. But the adjustments always bring data closer to the modeled trend. It’s decidedly non-random. Either there is a God who thinks teasing climate scientists is spiffy, or else there is something fishy going on, and some investigative journalists need to ask some investigative questions. Is that sea-level rise due to global warming or is it due to global adjustments? — Jo
————————————————————————————————————-
Guest Post by Frank Lansner
Edited by Jo Nova
Sea levels – the raw data is always adjusted upwards
[caption id="" align="aligncenter" width="506" caption="The raw data on sea levels is repeatedly adjusted "up""]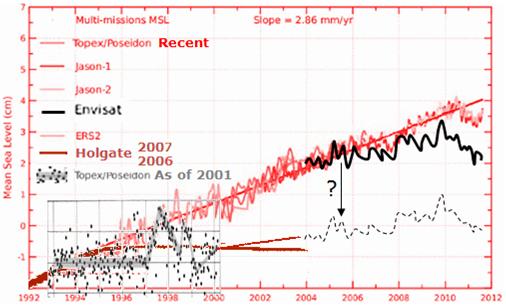 [/caption] […]


Recent Comments