Recent Posts
-
If UK had never tried renewables, each person would be £3,000 richer
-
Thursday
-
New AI data centers will use the same electricity as 2 million homes
-
Wednesday
-
No one knows what caused the Blackout but Spain is using more gas and nukes and less solar…
-
Tuesday
-
Monday
-
Sunday
-
Half of Australia doesn’t want to pay a single cent on Net Zero targets
-
Saturday
-
Secret comms devices, radios, hidden in solar inverters from China. Would you like a Blackout with that?
-
Friday
-
LSE junk study says if men didn’t eat so much red meat we’d have nicer weather
-
Thursday
-
Now they tell us? Labor says new aggressive Net Zero policy they hid from voters “is popular”
-
Wednesday
-
British politics in turmoil after Reform’s wins — Greens Deputy even attacks Net Zero from the left
-
Tuesday
-
Monday
-
Sunday
-
Children of 2020 face unprecedented exposure to Extreme Climate Nonsense…
-
Saturday
-
60% are skeptics: Only 13% of UK voters say Net Zero is more important than cost of living
-
Friday
-
Climate change is causing South Africa to rise and sink at the same time
-
Thursday
-
Why is the renewables industry allowed to sponsor political advertising in schools and call it “education”?
-
Wednesday
-
In trying to be a small target, the Liberals accidentally disappeared
-
Tuesday
-
Monday
-
The best thing about the Australian election was that Nigel Farage’s party won 30% in the UK
-
Sunday
-
Saturday — Election Day Australia
-
Vote for freedom…
-
Friday
-
Bombshell: Sir Tony Blair says climate policies are unworkable, irrational, and everyone is afraid of being called a denier
-
Thursday
-
Blackout in Spain to cost 2-4 billion Euro, likely due to solar plants — blind and biased ABC says “cause is a mystery”
-
Wednesday
-
Days after Spain reaches 100% renewable, mass blackouts hit, due to mysterious “rare atmospheric phenomenon”
-
Tuesday
-
Help needed: Site under DDoS attack from hundreds of thousands of unique IPs this week — especially China and the USA
-
Monday: Election Day Canada
-
When the Labor Party talk about “The Science” the Opposition can easily outflank and outgun them with bigger, better science
-
Saturday
-
UK Gov spends £50 m to dim sun to create slightly less beach weather
-
Friday
-
The cocoa price crisis is a Big Government price fixing disaster, not a climate change one
-
Thursday
-
Blame the Vikings! Moss found in East Antarctica lived in warmer summers a thousand years ago.
-
Wednesday
|
There is only one good reason to buy The Age: cartoonist John Spooner
 … For foreign readers, there are two big headlines in Australia this week that Spooner is teasing us with.
One is about Shorten’s fantasy that Australia can go 50% renewable by 2030. This is an “aspirational ambition”, which, according to opposition leader Shorten, doesn’t need any kind of feasibility or budgeting before being announced as a policy. He plans to wave his magic wand and make aspirations happen, regardless of stuff like “money”, “Watts” and thousands of dead bats.
Keep reading →
9 out of 10 based on 83 ratings
Big Oil knows no bounds. Not only can it derail governments, and thwart the UN, World Bank, and IMF but now it may be sending out climate death squads to assassinate Arctic Ice Experts. These expert hit squads apparently push people down stairs, run them off the road, and strike them down with lightning. Lightning! (That is one mother of aTesla Coil.) James Bond could learn something. Q, where are you?
Prof Wadhams at Cambridge has been the go-to man for Arctic scare stories across the UK (h/t Delingpole). In 2012, Wadhams predicted Arctic Sea Ice was set to collapse in just four years. Last year, after years of a relentlessly surviving Arctic, even some alarmists threw Wadham under the bus, (so to speak) as being too “extremist”. But now he’s topped that.
You see, in January 2013 there were four leading Arctic experts in the UK, now there is one, and he is very very worried.
No, seriously, you can’t make this up. Let’s try to imagine how much more profitable Big Oil would be if every single Arctic climate expert in the World was dead. (Count the zeros…)
The utter futility of it all escapes Wadhams. After a high-risk pogrom against arctic scientists, it would be exactly five minutes before the BBC and Guardian would be reporting their 22-year-old underlings apocalyptic predictions instead. Wadhams has no idea how irrelevant he is, or how little Big-oil cares. If I were advising Big Oil — I’d tell Royal Dutch Shell to hold off with the hit-squad — and just get their PR department to stop the press releases where they beg for more Carbon Trading in the EU. Next on the list: has Shell stopped sponsoring WWF? If Shell want to stop the climate scare campaign, that has to go.
The truth is that Big-Oil want the climate scare — it’s good for business. In the end, everyone wants oil, no one goes to work in a solar car. And Big-oil get bonus government subsidies for biomass and carbon sequestration too. Money for jam. Plus Big Oil also get an excuse to fight their real enemy, Big-Coal.
With such a hot-to-trot conspiracy on the cards, where is Stephan Lewandowsky, John Cook and Mike Marriott? I bet they can’t wait to study conspiracy ideation among actual climate experts, it would be so much more exciting than analysing 10 anonymous internet responses, or getting no responses from “78,000 skeptics” (who didn’t see the survey that was never hosted at John Cook’s site). Imagine a real study subject, an actual person, instead of internet readers who say they are 32,000 years old. The thrill!
The Telegraph
Three scientists investigating melting Arctic ice may have been assassinated, professor claims
Cambridge Professor Peter Wadhams suspects the deaths of the three scientists were more than just an ‘extraordinary’ coincidence
A Cambridge Professor has made the astonishing claim that three scientists investigating the melting of Arctic ice may have been assassinated within the space of a few months.
Professor Peter Wadhams said he feared being labelled a “looney” over his suspicion that the deaths of the scientists were more than just an ‘extraordinary’ coincidence.
But he insisted the trio could have been murdered and hinted that the oil industry or else sinister government forces might be implicated.
The three scientists he identified – Seymour Laxon and Katherine Giles, both climate change scientists at University College London, and Tim Boyd of the Scottish Association for marine Science – all died within the space of a few months in early 2013.
Professor Laxon fell down a flight of stairs at a New year’s Eve party at a house in Essex while Dr Giles died when she was in collision with a lorry when cycling to work in London. Dr Boyd is thought to have been struck by lightning while walking in Scotland.
His suspicions drew outrage on Saturday from Prof Laxon’s partner, who was also a close friend of Dr Giles. When told what Prof Wadhams had said, Fiona Strawbridge, head of e-Learning at UCL, replied: “Good god. All of this is completely outrageous and very distressing.”
Alarmist propaganda has been ranting relentlessly for twenty years about the power of Big Oil. But brainwashing bites, and this is one of those moments. Poor Prof Wadhams is reaping what that bizarre culture has sowed.
Keep reading →
9.5 out of 10 based on 73 ratings
…
7.6 out of 10 based on 11 ratings
 … What’s scarier than an Endless Global Drought? The fear that the public might… hear from a skeptic. Skeptical arguments are so dangerous that even the whiff of one will kill a $4million dollar project stone dead at conception. Be Gone Freak! Guess who has no answer to the questions skeptics ask? How they do advertise the dire state of their intellectual ammo? You might think I’m exaggerating. Bjorn Lomborg believes the IPCC science 100%, and uses the “denier” term to distance himself from the scientific skeptics. It’s like cloaking himself in garlic, except it doesn’t work — true believers still hate him and seek to shut him down. Lomborg wants to stop fossil fuel subsidies, the arch-enemy in the believers world, and that’s not enough. Furthermore he wasn’t going to work at the Australian Consensus Centre and it wasn’t going to discuss the climate, but two steps of purification is not enough. Lomborg commits the unforgivable sin of wanting to spend enviro-gravy in ways that actually help the poor and protect the environment. He wants measurements and accountability. And that makes him “repulsive” — just ask the students of Flinders University. The modern University needs no logical reason, hate-mail is enough:
FLINDERS University students are “repulsed” by the prospect of a new policy centre associated with controversial Danish academic Bjorn Lomborg, who has long been accused of downplaying the dangers posed by global warming.
The university has been in talks with the Federal Government about establishing the Australian Consensus Centre, which would come with $4 million funding and base its work on Lomborg’s methodologies.
The University of Western Australia was to host the think tank, to be aligned with Lomborg’s Copenhagen Consensus Centre and work in areas ranging from food security to social justice, but reversed its decision amid howls of protest from students and staff.
Flinders University Student Association general secretary Grace Hill said students would launch a campaign immediately against having “a climate change denial centre on campus”.
“I’m pretty repulsed by it,” she said.
“At this stage there seems to be no student or staff consultation. It’s right-wing junk. It was excellent to see him booted out of WA so hopefully the same will happen here.
— Flinders Uni Students Vow to Rebel against Bjorn Lomborg policy centre: Daily Telegraph
Only purity of thought will do behind the fortress walls of Australian Universities. The panic caused by the possibility of a skeptical argument is so strong that Global Repulsion is called for, even against believers who dare suggest the IPCC are not Godlike in all their aims and decrees. I think all universities in Australia should be offered the Lomborg Test. Let’s send an offer to host the Consensus Centre at their University, and cancel future government support for all who refuse to allow diversity of opinion and debate on campus. What’s the scariest thing that could happen — the Lomborg Consensus Centre might issue a press release? But the howling at UWA was so successful in cancelling the Lomborg Consensus Centre, that it’s happening again. What chance would a skeptical scientist have of working at an Australian University? Right now the best thing that can happen to Australian Universities is for them to be privatized and a few new institutions set up. Without some serious academic competition here to show them up, the backward behaviour will go on. We need one sensible university to show the others what “Sensible” looks like.
9.4 out of 10 based on 118 ratings
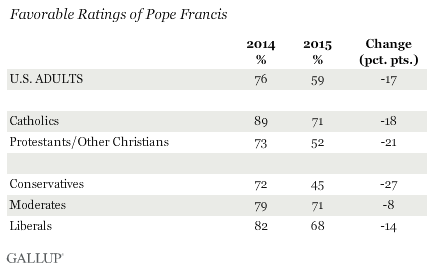
Pope Francis put out his pro-climate encyclical eight weeks ago, getting mass media attention, but the latest Gallop poll shows the people were not so enthused:
WASHINGTON, D.C. — Pope Francis’ favorability rating in the U.S. has returned to where it was when he was elected pope. It is now at 59%, down from 76% in early 2014. The pontiff’s rating is similar to the 58% he received from Americans in April 2013, soon after he was elected pope.
Is this about “climate change” — the encyclical has 245 paragraphs, 16 mentions of “climate”, 7 mentions of “carbon”, and more than 100 mentions of the “environment”. Moreso it reported around the globe as a “coup” on the climate issue by groups who normally think the Pope is wrong, silly and anachronistic. Furthermore, the biggest change has come among Catholics, Protestants, and especially conservatives. But he’s less popular among liberals too.
The drop in the pope’s favorable rating is driven by a decline among Catholics and political conservatives, two groups that have been ardent supporters of the modern papacy. Seventy-one percent of Catholics say they have a favorable image of Francis, down from 89% last year.
h/t to Heartland who deserve some credit here, having sent a team to the Vatican to draw attention to this issue.
The poll was a random survey of 1,009 people in the US. The margin of sampling error is ±4 percentage points at the 95% confidence level. The question: “Please say if you have a favorable or unfavorable opinion of Pope Francis — or if you have never heard of him”.
Did everyone miss the papal decree against Carbon trading?
During the orgy of papal-enthusiasm I noted that few people mentioned that the Pope was against carbon trading. Not the preferred prophesy?
190. Here too, it should always be kept in mind that “environmental protection cannot be assured solely on the basis of financial calculations of costs and benefits. The environment is one of those goods that cannot be adequately safeguarded or promoted by market forces”.[134] Once more, we need to reject a magical conception of the market, which would suggest that problems can be solved simply by an increase in the profits of companies or individuals. Is it realistic to hope that those who are obsessed with maximizing profits will stop to reflect on the environmental damage which they will leave behind for future generations? Where profits alone count, there can be no thinking about the rhythms of nature, its phases of decay and regeneration, or the complexity of ecosystems which may be gravely upset by human intervention. Moreover, biodiversity is considered at most a deposit of economic resources available for exploitation, with no serious thought for the real value of things, their significance for persons and cultures, or the concerns and needs of the poor.
The Pope was not able to explain why “market forces” were not the answer. He didn’t mention that sometimes free market forces work just fine with environmental problems, but they don’t when it’s a ubiquitous molecule central to life on Earth. In this case a free market is an impossible fantasy because most players can’t play — they are dogs, cats, yeast or the Pacific Ocean. Also it isn’t a real free market, because no one is “free” not to buy and governments control both supply and demand.
Anyhow…
9.3 out of 10 based on 72 ratings
The Coalition in Australia must be thrilled that Bill Shorten wants to make the next election about “climate change”. What a gift from Labor.
Just before the last election Labor had a plan to spend $60,000 dollars per person to try to change the weather by 2050. Labor lost nearly a quarter of their seats. Bill Shorten’s new election vision is to repeat the same mistakes. Like the G7 leaders, he wants symbolic and unachievable promises — only, unlike them, he’s making pie-in-the-sky, uncosted plans for 2030, not 2100. Five of the seven G7 nations are increasing their coal use. Get with the game Bill, other countries are winding schemes back and putting off the promises til long after most people alive today will be gone.
Shorten is pushing a dead dog. The sweet end of the wind and solar power deals have already been done and the numbers get uglier from here. As more and more of the grid is taken over by a massive erratic and unreliable supply, the marginal returns shrink, prices go up. The carbon “savings” falls. Full baseload back up must be maintained regardless, whirring away inefficiently on standby. The Labor Party are making a big miscalculation electorally, fooled by inept surveys that show everyone “likes” the environment and “worries” about climate change. Better studies show almost no votes hinge on this topic, nobody wants to spend much, and pandering to the green religion will hurt things people do care about — electricity prices, manufacturing and employment. US voters rank “climate change” last in environmental polls, and they rank the environment below nearly every thing else. In the UK, polls show 62% don’t believe in a man-made climate disaster. There’s a long list of environmental climate polls showing skeptics are everywhere, and many believers are bored and unmotivated. In the US Tom Steyer threw $74 m at the election on climate change and lost nearly every seat he tried to influence. Fully 92% of Swiss Voters said “No” to a carbon tax.
Just what the country needs?
Green “renewables” schemes push up the price of electricity, make the world 0.0C degrees cooler, and increase unemployment. Every green job created means a loss of 2 – 5 other jobs.
Bill Shorten to unveil 50% renewable energy target at Labor conference –– Sydney Morning Herald
Opposition Leader Bill Shorten is set to unveil a bold climate policy goal requiring half of Australia’s large-scale energy production to be generated using renewable sources within 15 years.
Fairfax Media has learnt that despite Labor’s humiliating 2013 election defeat caused in part by voter contempt for its carbon tax, Mr Shorten will use this weekend’s ALP national conference in Melbourne to announce the even more ambitious goal, dramatically beefing up Labor’s renewable energy target.
The policy shift is designed to recover green support, sharpen the contrast with Prime Minister Tony Abbott over climate change and make global warming the defining battleground of the next federal election
As Andrew Bolt points out, it’s “not costed, not modelled, and not effective”.
Only in Labor economics can we add more expensive suppliers and pretend the prices won’t rise dramatically. It’s “free energy from the sun” after all. It’s like the Labor Party believe the bumper stickers.
 Comparison of costs of electricity generation. | Energy Supply Association of Australia How much global cooling does $100 billion buy?
Australians emit 1.16% of human emissions, which total just 4% of natural ones. Co2 doesn’t appear to have warmed the world in the last 18 years despite rapid rises in human emissions — one third of all human emissions ever since 1998, and no warming. The Australian impact is 0.00064 of nothing.
We need another 10,000 wind turbines?
Adam Creighton, The Australian, on energy prices, and the cost of the Labor 50% renewables plan:
ACIL chief executive Paul Hyslop said: “If this were met by wind power it would require 10,000 to 11,000 additional turbines … with capital costs for the turbines alone of $65 billion.”
He suggested such a move would undermine productivity.
ACIL said the total capital cost would be in the order of $100bn — about three times the cost of the National Broadband Network.
“Basically, we’d be spending another $65bn on turbines to effectively get no more output,” Mr Hyslop said.
Australia will need about 300,000 GWh total in 2030 according to ACIL — We’d need another 92,000 GWh of “renewables”:
The Coalition and Labor agreed in May to trim the RET from 41,000 GWh a year by 2020 to 33,000 GWh, to allow for the fall in electricity demand that was projected to lift the share generated from renewables to 26 per cent by 2020, rather than the 20 per cent envisaged. The new RET is forecast to provide 23.5 per cent.
ACIL estimates a total power demand of 300,000 GWh in 2030, of which half would come from renewable sources under the Labor plan. The firm believes 25,000 GWh would come from rooftop solar systems, with another 16,000 GWh from existing hydro-electric plants, leaving 110,000 GWh to be provided by large-scale renewable projects — or 92,000GWh more than existing capacity.
In terms of carbon emissions, wind turbines are almost the last choice on Earth. They cost $50 – $100 per ton of carbon, seven times more than the Coalition’s Direct Action plan. No one who cares about the environment would want to waste money doing something so inefficient when they could spend the same money and achieve a lot more.
Australian electricity prices are rising much faster than inflation.
The big leap in electricity prices in the graph in 2012/13 below is due to the carbon tax, but some of the rise before that is due in part to other policies to “green” our electricity.
 Electricity prices in Australia. The Carbon Tax was introduced July 2012. Source: Parliamentary Library
The electricity price is rising much faster than inflation. The Rudd Labor government was elected in November 2007.
 …
8.8 out of 10 based on 73 ratings
I’ve discussed the big ComRes/ITV survey before, which showed that 62% of UK citizens are skeptics and are not convinced that humans are changing the weather. This is the same interesting survey which also showed that the highest proportion of skeptics were in the educated upper middle class, and the lowest was in the unskilled workers and pensioners. I didn’t explain then that this survey also split the groups according to age. So here (finally) are those graphs. Fittingly the young are undecided and the wise are more skeptical. But surprisingly there is a peak believer age, and that’s around 35 – 44. Either this generation has been assailed with more propaganda than any other, or something else is going on.
Is this the beginnings of the youthful revolution? Only 20% 34% of 18 – 24 year olds would be called believers?
They quizzed 2047 people from across the UK early last year and I’ve graphed the results according to age, and the “peak believer” band is clearly visible. In all three questions I colored believers red, and skeptics blue. The undecided are grey.
People generally switch from the “don’t know” category when they are young into the skeptic camp as they get older. Some may go via the “believer” group in their 20s and 30s.
The first graph shows results from an unusually specific and accurate question.
 An unusually specific and accurate question.
Keep reading →
9 out of 10 based on 58 ratings
 Fig 3 (Part VI only) Sunspot drawing of by G.D. Cassini in 1671 (Oldenburg, 1671c). What is surprising is just how much data we have on the Sun from 400 years ago.
For some aspects of solar activity we barely have a half a solar cycle. For example, on solar spectral changes: UV and Infrared light swing up and down through the solar cycle, but we only got a good grip on these important changes in the last ten years with the SORCE mission.
But on other aspects of solar activity there is much more long term data than I expected: 400 years ago quite a few people were carefully recording detailed drawings of sun spots (like Cassini in 1671, right). Others were reporting aurorae — up to 150 a year in parish records, newspaper reports, and scientific observations, which tells us something about the strength of the solar wind. There were also observations of the solar corona during eclipses at the time, which suggest the sun was less active as well.
Lately some (Zolotova et al) have said solar activity was not low during the cold Maunder Minimum period from 1645 – 1715. Usoskin and others have responded by amassing a compedium of historic data demonstrating that something very unusual was going on with the sun during that time. They not only look at sun spots, but aurorae, solar corona observations, Beryllium in ice cores, Carbon 14 in tree trunks, and titanium in meteorites.
We know aurorae were rarer or smaller during the Maunder minimum because for 80 years there were virtually no reports of auroras in Great Britain, though keen observers were looking for them, and recording “clear skies” day after day.
There were reports of aurorae from the late 1500’s in the UK, Denmark, and Prague, but then early in the 1600’s activity fell away. The silence was loud. At the end of the Maunder period, across northern Europe on “Tuesday 17th March 1716” people all over Northern Europe reported aurorae, including Edmund Halley in Great Britain, who had never seen one before, yet had read about them, and looked for them. He’d begun to despair he might never see one. One Petter Dass in Norway did miss out, he diligently recorded the night sky from 1645 to 1707 when he died, and though he had read many historic reports of aurorae, he never recorded seeing one himself. His bad luck, to be an astronomer and his whole adult life spent during the quietest period for centuries.
The Usoskin paper is an interesting read for people interested in the history of early science as well as for the history of solar activity.
Total sunlight levels suggest the Sun was very quiet 300 years ago
The world has warmed since 1680, as best as we can tell, and solar activity has increased since then too. This graph of TSI (total solar irradiance) shows that rise — though the absolute change is tiny. TSI changes are small but appear to be another indicator of solar activity.
 Fig. 17. Selected TSI reconstructions since 1600, labeled in the plot are: Sea09 –Steinhilber et al. (2009); DB11 – Delaygue & Bard (2011); Wea05 – Wang et al. (2005); Kea10 – Krivova et al. (2010); Dea14 – Dasi-Espuig et al. (2014); Vea11 – Vieira et al. (2011). The green, blue and red colour tones are used for the reconstructions based on the 10Be, sunspot and 14C data, respectively. The black dotted line marks the TSI value at modern solar activity minimum conditions according to SORCE/TIM measurements. As we keep suggesting, some other factor on the Sun, like the solar-magnetic, spectral changes or solar wind may be responsible for changing the climate on Earth. Correlation is not causation, but neither is it nothing. Yet, the mainstream Climate Models assume all the other solar factors are irrelevant.
That’s record low activity
The Zolotova and Ponyavin paper suggested that solar activity was much higher (red dashes) compared to other reports.
 Fig. 1. Annual group sunspot numbers during and around the Maunder minimum, according to Hoyt & Schatten (1998) – GSN, Zolotova & Ponyavin (2015) – ZP15, and loose and strictly conservative models from Vaquero et al. (2015a) (see Sect. 2.1), as denoted in the legend.
ABSTRACT
Aims. Although the time of the Maunder minimum (1645–1715) is widely known as a period of extremely low solar activity, claims are still debated that solar activity during that period might still have been moderate, even higher than the current solar cycle # 24. We have revisited all the existing pieces of evidence and datasets, both direct and indirect, to assess the level of solar activity during the Maunder minimum. Methods. We discuss the East Asian naked-eye sunspot observations, the telescopic solar observations, the fraction of sunspot active days, the latitudinal extent of sunspot positions, auroral sightings at high latitudes, cosmogenic radionuclide data as well as solar eclipse observations for that period. We also consider peculiar features of the Sun (very strong hemispheric asymmetry of sunspot location, unusual differential rotation and the lack of the K-corona) that imply a special mode of solar activity during the Maunder minimum. Results. The level of solar activity during the Maunder minimum is reassessed on the basis of all available data sets. Conclusions. We conclude that solar activity was indeed at an exceptionally low level during the Maunder minimum. Although the exact level is still unclear, it was definitely below that during the Dalton minimum around 1800 and significantly below that of the current solar cycle # 24. Claims of a moderate-to-high level of solar activity during the Maunder minimum are rejected at a high confidence level.
Look at the detail of this drawing by Cassini, 1671
 Fig. 2. Drawing of a sunspot group observed in August 1671, as published in number 75 of the Philosophical Transactions, corresponding to August 14, 1671. The amount of aurorae data is remarkable
 Fig. 11. Occurrence of auroral reports, 1700-1900. The green line is the number of auroral nights at geomagnetic latitudes below 56◦ from a combination of several catalogues (Nevanlinna, 1995; Fritz, 1873, 1881; Legrand & Simon, 1987). The points show the geomagnetic latitude and time of auroral sightings from the catalogue of V´azquez et al. (2014) (their Figure 9). Black diamonds, red squares and red triangles are, respectively,
for observing sites in Europe and North Africa, North America, and Asia. Blue dashed lines mark the minimum latitude of auroral reports in the last solar cycle of the Maunder minimum (MM) and in the two cycles of the Dalton Minimum (DM). There is a stark dearth of aurorae recorded during the Maunder Minimum:
 Fig. 12. Same as Figure 10 (see caption below graph box), but compiled from 41 different catalogues of auroral observations at magnetic latitudes below 55◦ in Europe, Asia, North Africa, New England and Great Britain. The time series covers both the Maunder and the Dalton minima. [Fig. 10. (a) The grey histogram shows the number of auroral nights, NA, in calendar years for observations in Great Britain collated by E.J. Lowe (1870) with the addition of the observations by Thomas Hughes (Harrison, 2005) and John Dalton (Dalton, 1834). The black line shows the annual group sunspot number of Hoyt & Schatten (1998), with the adoption of recent corrections by Vaquero et al. (2011) and Vaquero & Trigo (2014). Lowes personal copy of his catalogue of natural phenomena (including auroras) was only recently discovered and was compiled completely independently of other catalogues. Yet it shows, like the others, the dearth of sightings during the Maunder minimum, some events in 1707 and 1708 and the return of regular sightings in 1716. (b) Annual variation of NA in the same dataset and of RG.]
Usoskin et al describe the extraordinary sighting of the first aurorae for decades
What is significant about this event is that very few people in the country had seen an aurora before (Fara, 1996). Indeed, Halley’s paper was commissioned by the Royal Society for this very reason. This event was so rare it provoked a similar review under the auspices of l’Acad´emie des Sciences of Paris (by Giacomo Filippo Maraldi, also known as Jacques Philippe Maraldi) and generated interest at the Royal Prussian Academy of Sciences in Berlin (by GottfriedWilhelmLeibnitz).All these reviews found evidence of prior aurorae, but none in the previous half century. Halley himself had observed the 1716 event (and correctly noted that the auroral forms were aligned by themagnetic field) but had never before witnessed the phenomenon. It is worth examining his actual words: “…[of] all the several sorts of meteors of, this [aurora] was the only one I had not as yet seen, and of which I began to despair, since it is certain it hath not happen’d to any remarkable degree in this part of England since I was born [1656]; nor is the like recorded in the English Annals since the Year of our Lord 1574.” This is significant because Halley was an observer of astronomical and atmospheric phenomena who even had an observatory constructed in the roof of his house in New College Lane, Oxford where he lived from 1703 onwards. In his paper to the Royal Society, Halley lists reports
of the phenomenon, both from the UK and abroad, in the years 1560, 1564, 1575, 1580, 1581 (many of which were reported by Brahe in Denmark), 1607 (reported in detail by Kepler in Prague) and 1621 (reported by Galileo in Venice and Gassendi in Aix, France). Strikingly, thereafter Halley found no credible reports until 1707 (Rømer in Copenhagen and Maria and Gottfried Kirch in Berlin) and 1708 (Neve in Ireland).He states “And since then [1621] for above 80 years, we have no account of any such sight either from home or abroad”. This analysis did omit some isolated sightings in 1661 from London (reported in the Leipzig University theses by Starck and Fr¨uauff). In addition to being the major finding of the reviews by Halley, Miraldi and others (in England, France and Germany), a similar re-appearance of aurorae was reported in 1716-1720 in Italy and in New England (Siscoe, 1980).
The absence of auroral sightings in Great Britain during the MM is even more extraordinary when one considers the effects of the secular change in the geomagnetic field. For example, using a spline of the IGRF (InternationalGeomagnetic Reference Field, http://www.ngdc.noaa.gov/IAGA/ vmod/igrf.html) model after 1900 with the gufm1 model (Jackson et al., 2000) before 1900 we find the geomagnetic latitude of Halley’s observatory in Oxford was 60.7◦ in 1703 and Edinburgh was at 63.4◦. Auroral occurrence statistics were taken in Great Britain between 1952 and 1975, and of these years the lowest annual mean sunspot number was 4.4 in 1954. Even during this low solar activity year there were 169 auroral nights observed at the magnetic latitude that Edinburgh had during the MM and 139 at the magnetic latitude that Oxford had during the MM (Paton, 1959). In other words, The British Isles were at the ideal latitudes for observing aurora during the MM and yet the number reported was zero. This is despite some careful and methodical observations revealed by the notebooks of several scientists: for example, Halley’s notebooks regularly and repeatedly use the term “clear skies” which make it inconceivable that he would not have noted an aurora had it been present. Halley’s failure to find auroral sightings in the decades before 1716 is far from unique.
..
REFERENCE
Usoskin et al (2015) The Maunder minimum (1645–1715) was indeed a Grand minimum: A reassessment of multiple datasets, arXiv:1507.05191 [astro-ph.SR]
h/t Willie.
9.5 out of 10 based on 83 ratings
Humans can adapt to live in locations where the monthly average is over 40°C, and as low as -50°C. That’s a 90°C range. The world has warmed by 0.9°C in 100 years (or less, depending on adjustments). This warming was so dangerous that global population only expanded from 1.7 to 7 billion.
Now, if the IPCC are right, we might heat up by another half a degree by 2100 — shifting those extremes from -49°C up to 41°C.
Prof. Andy Pitman, one of Australia’s leading climate scientists, responds to this risk with all the usual careful analysis we’ve come to expect from mainstream climate experts. Here’s another “children won’t know what snow is” type of Global Panic quote:
“I expect by 2050 … people just don’t go outside,”
— Professor Andy Pitman, director of the ARC Centre of Excellence for Climate System Science at UNSW.
So that’s the end of golf, surfing, and picnics then. Somewhat confusingly, he also said (in the same interview) that we won’t necessarily notice that extra warmth: “… because humans acclimatise to heat quite quickly”. This is what 95% certainty looks like in 2015, ladies and gentlemen — abject panic and nothing to see here, both at the same time… journalist Lucy Cormack swallows it all, trained by the Sydney Morning Herald to ignore wild claims and bizarre contradictions.
The hottest inhabited places on Earth
There is a lot of competition for the “hottest” town on Earth.
 Marble Bar, Western Australia Dallol, Ethiopia has an average July monthly high of 45.6°C (114F), so it is usually top of the “hottest inhabited location lists”. But is practically a ghost town so it doesn’t quite count, though miners lived there from 1960-1966 and the 45°C record heat was recorded during these years. The annual average year-long maximum temperature is 41 °C (105 °F). Summer nights in Dallol get down to 32°C (90F).
Marble Bar, West Australia, has an average of 41°C in January for the last 100 years. It holds a world record for having 160 days above 100F from 31 October 1923 to 7 April 1924. About 200 people live there. (See more Marble Bar photos.)
In Kebili, Tunisia, the average July max is 41.7°C and sixty thousand people still live there, so I think it gets the medal for “hottest inhabited town”. Curiously in this warming world, Wikimedia notes that the hottest temperatures (all 50°+C) were recorded from 1888 – 1930, and not since. Presumably those old thermometers needed adjustment.
Humans, apparently, have lived in area’s around Kebili for at least 2,000 years, and maybe, possibly, 200,000 years. (I expect they are probably used to it by now.)
The coldest inhabited places
 Oymykon, Russia Five hundred people live in Oymyakon, Siberia, Russia, almost in the Arctic circle at 63N. The average temperature for January is -50°C. The village is called the coldest permanently inhabited settlement in the world, and there doesn’t seem to be anyone arguing about it. (Though technically, the research station at Vostok, Antarctica has a monthly average of – 68°C, and about a dozen people manage to live there.) In winter in Oymakon, there are only three hours of sun a day, and people have to heat their garages, or run their cars 24/7 to keep them usable.
The coldest ever temperature recorded in Oymyakon was -71.2°C. Read more at Dailymail, and Wired.
The photo (and more glorious ones) was by Amos Chapple.
8.9 out of 10 based on 99 ratings
[Tick tick, only 150 comments to go to 300,000…]
8.1 out of 10 based on 33 ratings
The last time an IPCC chair position was up for grabs was in 2001, when things were not so politicized and aggressive, and there was not so much money and power on the table. Lobbying for this role is running hot and Tony Thomas compares the five men who are standing for this role. The position will be decided by October 8, and the new chairman will presumably be influential, or at least very visible, in Paris at the UNFCCC in early December. In the elections, there is one vote per country, so it is not so much about scientific credibility (and never was, think of Pachauri) but more about the powerful voting blocks that may form with small developing nations. Given that the new chairman will be in the media frequently and soon, this post is about being prepared. No matter who wins, I think the IPCC is unsaveable and needs to be shut down or deprived of funding as soon as possible. — Jo
Guest Post by Tony Thomas
Five candidates have put up their hand to become chair of the Intergovernmental Panel on Climate Change from October 8.
They are Jean-Pascal van Ypersele (Belgium), Hoesung Lee (Korea), Thomas Stocker (Switzerland), Chris Field (USA) and Nebojsa Nakicenovic (Austria).
The elections will be at the meeting of the IPCC in Dubrovnic, Croatia, from October 5-8. Further nominations are unlikely but it is possible that ‘wild card’ candidates could be nominated at the meeting itself, with a vote 24 hours later.
Each of the 195 nation-state members of the IPCC have an equal vote by secret ballot. The vote of Vanuatu (pop 250,000) carries the same clout as the USA’s. This means candidates, and their national backers, will be courting the myriad small states for votes, using hard and soft diplomacy as occurred in 2001.
A win requires a simple majority. If no majority occurs on the first voting round, the top two candidates are put to a run-off vote.
The chair has been vacant since February when Dr Rajenda Pachauri, 75, resigned abruptly after a 29-year-old female analyst at his TERI thinktank in Delhi filed a sexual harassment complaint against him. Pachauri has since been on bail after Delhi police charged him with molestation, stalking, sexual harassment and criminal intimidation. The IPCC then appointed Vice-Chair Ismail Elgizouli (Sudan) as acting chair until October 8.
The IPCC chair position and other top roles carry no salary but give global prominence and status. Leaders’ home governments or institutions pick up the tab.
Van Ypersele and Hoesung Lee are two of the three current vice-chairs (Elgizouli is the third). Stocker is co-chair of Working Group 1 (the science); and Field is co-chair of Working Group 2 (Impacts and Adaptation). If the IPCC operated logically, the showdown would be a contest between the Swiss-backed and US-backed candidates, whose science credentials are overwhelming.
The Candidates
Nebojsa Nakicenovic, Austria, Prof of Energy Economics
Keep reading →
9.1 out of 10 based on 41 ratings
by Jo Nova
If the “leech” doctors circa 1000AD were able to treat superbugs that modern doctors struggle with, I wonder what other knowledge has come and gone and had to be rediscovered?
How many lives have been lost because information was not there when they needed it?
 Image: © The British Library Board (Royal 12 D xvii) Judith Curry posted a link this week to a story about a medieval recipe for an “eyesalve” that rather surprised researchers when it worked against the ghastly MRSA superbug, which is resistant to almost all modern antibiotics.
The book is one of the earliest known medical texts, called Bald’s Leechbook. The recipe called for garlic, onion, wine, and bile from a cow. It was very specific — the mix had to be brewed in brass and then left for nine days. The researchers at the University of Nottingham followed it closely, then it was tested in the lab. Will it work on people, and what are the side-effects?
Keep reading →
9 out of 10 based on 92 ratings
Tony Thomas visited the UK and found old fading National Trust signs using scary photos of flood damage and warning people to “eat local” and change their light globes to stop more floods. He followed that thought to a 2005 web plea from the National Trust, to find them claiming floods are accelerating but using 20 year old photos to scare people with.
Years from now people will study climate propaganda and marvel at how stupid it was. — Jo
Guest Post by Tony Thomas
My wife Marg and I, two Antipodean yokels, wound up at the National Trust’s Bodiam Castle in Kent last month, awed at its 650-year history. After all, our colony’s iconic historical moment was in 1854, when someone broke a hotel lamp in Ballarat, Victoria and precipitated a scuffle between goldminers and police. The ringleader, instead of being quartered like Mel Gibson — sorry, William Wallace — acquired a seat in Parliament next year and eventually died in bed. That’s all you need to know about Australian history, unless you’re into sheep.
Marg and I had lunch and wandered out the back of the Bodiam cafe towards the Rother River. “Hey, come and look at these signs!” she called. I ambled over to the bank that descends steeply to the river.
The first sign said, “The Rother – Where you are standing now will almost certainly be under water in 50 years’ time as a result of climate change. A foretaste of this was given in November 2000 when the river burst its banks and flooded the area.” Below this, the sign had a photo of, sure enough, the water level raised two or three metres to where I was standing. And photos don’t lie.
 …. The next sign read:
“We all have a part to play in tackling climate change and by acting together we can make a big difference. The National Trust is helping by looking at its use of energy, water and waste. You can help too by:
- Buying and eating local food
- Insulating your home
- Changing your light bulbs to low energy
- Using public transport, or cycling.
For more information, look at the National Trust website.”
Keep reading →
8.8 out of 10 based on 91 ratings
 Wind Farm, Wind Park, Wind Sheep, Wind Cows, & Wind-Flowers? This week’s note on mangling English: Since when was an industrial plant a farm? Electricity does not grow, breathe, or look cute in photos. There is nothing biological to sell.
Some will say the term “farm” has broader definitions now. I say we might as well call a coal-fired-plant a “coal farm”, or Fukishima a “nuclear-farm” (that had a “farming accident”)?
The word “farm” has been stolen for its good PR value. Let’s take it back.
Industrial wind turbines are a massive subsidy swamp that produces almost nothing that can’t be provided in cheaper and more efficient ways elsewhere.
Can someone let Wikipedia know that Industrial Wind Turbines are not “Wind Parks” either?
Photo: “Windpark-Wind-Farm” by Philip May – Own work. Licensed under CC BY-SA 3.0 via Wikimedia Commons
9.3 out of 10 based on 106 ratings
Graham Readfearn, at Ecowatch, thought the USA would top the list. He was wrong:
Published in the journal Global Environmental Change, the study found that 17 percent of Australians were “climate skeptics.”
Norwegians come in second at 15 percent, followed by New Zealanders at 13 percent and then Americans at 12 percent. The UK tied for fifth with Sweden and Finland, where 10 percent of people were skeptics. The lowest ranked country for climate skepticism was Spain, where only two percent of people were classified as climate skeptics.
The real number of skeptics is much higher. A better, more accurate survey in Australia showed that about 53% of the Australian population are skeptical; I note they stopped that annual survey after getting these clear results.
This survey of surveys were more ambiguous than usual — “rising temperatures” from any cause is now man-made. The surveyors merely asked if you thought “rising temperatures” (magnitude unspecified) were “dangerous” , and so you know what to say, they added “for the environment”. All spin and attitude, otherwise meaningless. This is all so horribly confounded:
While the survey did not directly ask people if they accepted the science linking climate change to human activities, the respondents were asked how dangerous rising temperatures would be for the environment.
People who thought rising temperatures were “not very dangerous” or “not dangerous at all” and who also thought claims about environmental issues were exaggerated were classed as “climate skeptics.” While the authors accept in the paper that their approach was limited, they argue that the method enables them to do a valuable comparison of skepticism across countries.
Well that redefines “skeptic” somewhat. Anyway… people were more skeptical if their governments were untrustworthy, and if that is the “driver” we can thank Rudd and Gillard for Australia’s shining role in this inconsequential meta-survey:
Generally, the study found that climate skepticism tended to be associated with a lack of trust in governments and “positive attitudes” towards private enterprise.
Those who can compete and win will want to; those who can’t, prefer government-managed redistribution. I’m not putting a judgement on this, it is simply the way it is.
The group the “progressives” now love to hate:
Skeptics also tended to be male and tended to vote conservative.
What about the free will option — where people hear a theory and are unconvinced by irrational, contradictory arguments that break the scientific method. The globe stopped warming and paused when emissions were rising, the drought stopped and the dams filled, and the hotspot was never glimpsed. Children still know what snow is.
Across all countries, the authors wrote that only three factors—“political orientations (conservative), gender (male) and being unconcerned about environmental issues”—were “relatively consistent predictors” of climate change skepticism.
Their cause and effect assumptions are back to front. I used to vote Green back in the days when I was unskeptical. Now I don’t. My skepticism could be considered a “relatively constant predictor” of my intention to vote for parties that are unskeptical. With more voters being swinging and less loyal than ever, the old assumptions about people being voters first and thinkers second needs to be reassessed.
9.2 out of 10 based on 98 ratings
Is the Sun driven by two dynamos, each running on slightly different 11 year cycles?
Many people are talking about a new forecast of a mini-ice age (which seems to be an increasingly popular thing to predict.) This one comes from a paper published last year but presented at the Royal Astronomical Society last week. Shepard, Zharkov and Zharkova may have gotten us a step closer to understanding why the solar cycle varies in length from 8 to 14 years. Since the level of solar activity correlates with both the the length of the current solar cycle and the surface temperatures on Earth one solar cycle later (the notch-delay theory, and see the work of David Archibald), it may make it possible to predict the climate decades in advance. (With the caveat that this new study is still a model, correlation is not causation, etc.)
One of the better descriptions comes from Astronomy Now.
The Sun, like all stars, is a large nuclear fusion reactor that generates powerful magnetic fields, similar to a dynamo. The model developed by Zharkova’s team suggests there are two dynamos at work in the Sun; one close to the surface and one deep within the convection zone. They found this dual dynamo system could explain aspects of the solar cycle with much greater accuracy than before — possibly leading to enhanced predictions of future solar behaviour. “We found magnetic wave components appearing in pairs; originating in two different layers in the Sun’s interior. They both have a frequency of approximately 11 years, although this frequency is slightly different [for both] and they are offset in time,” says Zharkova. The two magnetic waves either reinforce one another to produce high activity or cancel out to create lull periods.
With the Sun, we struggle for good data. Shepard et al only have three sunspot cycles of magnetic field data to go on but used the longer sunspot records as well.
 Figure 4. Modulus summary principal component (solid curve) calculated from Equations (6) and (7) for cycles 21–23 and predicted for cycles 24–26, the modulus summary PC derived from SBMF in cycles 21–23 (dotted curve) and in cycle 24 (dashed curve). | Click to expand. The debate on this one is certainly not over. The new paper suggest there are two solar dynamos but in 2011 Nicola Scafetta argued that solar dynamics is best modeled with three interference circulation modes. His model reproduces past solar activity for millennia and also predicted a grand minimum by 2030.
Guest post by Dr David Evans
Dr David Evans, 14 July 2015, David Evans’ Notch-Delay Solar Theory and Model Home
The topic is a prediction publicized over the weekend that “Solar activity predicted to fall 60% in 2030s, to ‘mini ice age’ levels“. This is quite plausible, because it fits with several other predictions made in 2013 by a number of authors (Special Issue of Pattern Recognition in Physics, Mörner, Tattersall & Solheim, 2013).
Be aware that “solar activity” refers to the number of sunspots, not the total energy output of the Sun — which is very near constant and has varied less than 0.15% over the last 400 years. It’s not as if the Sun is going to be producing 60% less heat: it will produce almost exactly the same heat as it always does, just with far fewer sunspots.
 A comparison of three images over four years apart illustrates how the level of solar activity has risen from near minimum to near maximum in the Sun’s 11-years solar cycle. These images are captured using He II 304 emissions showing the solar corona at a temperature of about 60,000 degrees K. Many more sunspots, solar flares, and coronal mass ejections occur during the solar maximum. The increase in activity can be seen in the number of white areas, i.e., indicators of strong magnetic intensity .Source: NASA However, even this is very significant. Last year we blogged that the number of sunspots accurately predicts the small changes in temperature here on Earth, such as those associated with global warming, but with a delay of one sunspot cycle (which averages 11 years, but is only half the Sun’s full cycle, which averages about 22 years).
There was a largish fall in solar activity in 2004 (in 11 year smoothed TSI), so there will be a significant and sustained fall in global temperature on Earth starting in about 2017 (the current sunspot cycle is a long one, about 13 years, 2004 + 13 = 2017). This will outweigh the warming effect of extra carbon dioxide.
The Earth has been in a warming trend for the past 350 years, since the depth of the Little Ice Age during the Maunder Minimum, in the second half of the 1600’s. This warming trend appears to be driven by solar activity—carbon dioxide didn’t start increasing until 1800 or so, and didn’t really get going until after WWII with post-war industrialization.
So the Shepard paper’s prediction that the Sun is going inactive, and will lead to a cooler Earth such as last seen in the Maunder Minimum of the 1600s (when ice fairs on the Thames River in London were common), is plausible and likely.
Note that the influence of sunspots on terrestrial temperatures is not because the heat of the Sun varies (that variation is pretty insignificant in terms of global warming or cooling). It is because something about the Sun, perhaps its UV output or a magnetic influence on the Earth’s upper atmosphere, affects the cloud cover on Earth, and thus how much sunlight the Earth reflects back out to space. More clouds mean more sunlight is reflected without warming the Earth, so the Earth is cooler. If the Sun is affecting the cloud cover on Earth, it is affecting the Earth’s temperature even though the heat from the Sun stays about constant.
Keep reading →
9.2 out of 10 based on 117 ratings
Color me alarmed. We might be called names! Let’s make National Policy to avoid embarrassment.
 Tim Flannery and the “Climate Council” think we should spend billions in an attempt to pander to foreign opinions — but it’s not even the average global citizen we are talking about, just the international inner-city cafe-latte crowd. Everyone worries about the environment in surveys, but they don’t care enough to spend much money on it. And last time I looked, being a Global Climate Pariah was good for our tourism — visitors were still flocking to Australia after we got rid of the carbon tax, and the Chardonnay set were still drinking our wine (all 700 million liters). Tim Flannery and the “Climate Council” think we should spend billions in an attempt to pander to foreign opinions — but it’s not even the average global citizen we are talking about, just the international inner-city cafe-latte crowd. Everyone worries about the environment in surveys, but they don’t care enough to spend much money on it. And last time I looked, being a Global Climate Pariah was good for our tourism — visitors were still flocking to Australia after we got rid of the carbon tax, and the Chardonnay set were still drinking our wine (all 700 million liters).
It’s not about global temperatures
No one can pretend Australia can cool the planet: we emit a mere 1.16% of human emissions. Total human output of CO2 is a mere 4% of nature. Even if the IPCC was completely right, and we shut down Australia and everybody left — we would cool world temperatures by 0.0154 °C. Welcome to Futility Island — Australian emissions of CO2 are irrelevant to global temperatures.
So why cut CO2 at all — Because we are scared of being called names?
Everyone is a pariah these days
Last week the UK cut green subsidies (it was so harsh, the industry called an emergency summit). Germany are chopping back the green schemes, burning more coal, and gave up on their 2020 emissions target. In Japan, emissions hit new record highs. The former ambitious emissions targets nearly all failed (Australia being one of the only Annex 1 countries to make its Kyoto agreement) and new emissions targets keep moving into the far unaccountable future. A few weeks ago, the G7 leaders met and resolved to bravely free us 100% from fossil fuels — but only after most people alive today are dead.
If the fuss was about actual CO2 emissions, Australia would be a hero — per capita Australian emissions have fallen by 28% since 1990. The “pariah” status is about pandering to the green industry, self-serving bureaucrats, and the eco-religion. Grovel to the Green gods!
In any case, actual atmospheric CO2 levels seem to be rising faster over developing nations. Watch carbon dioxide rise and fall in a global seasonal pattern that depends mostly on warmth and sunlight.
The Australian
Aust will be a pariah if no climate action
AUSTRALIA risks becoming a “global pariah” if the federal government doesn’t step up efforts to tackle climate change, experts warn.
THE Climate Council says with all G7 countries except Japan outlining their new emissions reduction targets ahead of the Paris summit, it’s clear that most countries see it’s in their national interest to take accelerating action.
“This is likely the first time in recent history that Australia has come under such sustained criticism from other countries over its domestic policies,” chief councillor Tim Flannery said in a statement.
It’s a symbolic thing. We hope China, 1.4 billion, is hankering to follow our lead towards eco-martyrdom.
9.1 out of 10 based on 112 ratings
…
8 out of 10 based on 27 ratings
 😉 Joy. It’s another profoundly unscientific “consensus” study. At least one person thought that the 97% PR figure was not enough, and that magic 99.9% would sway the crowds. As if there was even one fence-sitter sitting, waiting, saying, “97% was too low…”
For the herding type of human, “consensus” is magnetically convincing. Not so for the independent minds who have seen prediction after prediction fail. If a 97% consensus on a highly complex, immature science is difficult to believe, a 99.99% one is comic. More of the same unconvincing stuff will do nothing except set off the BS meter. This new study will sway no one. The supernatural purity of it will work against “The Cause”.
A consensus is the one and only argument of the unskeptical, and they are doing it to death.
One fan, James Powell, was so enthused he spent nine months reading titles and abstracts of 24,000 papers, and found only four scientists (4!) who didn’t agree with the consensus. Some 69,402 other scientists apparently endorse “the consensus” (whatever it is) because they used the terms “climate change”, or “global warming” and they didn’t also make a clear statement that it was false, or claim that something else explains the rise in temperatures better than CO2. I’m pretty sure the perfect 99.99% consensus includes Roy Spencer, William Braswell, Richard Lindzen, and pretty much any other publishing skeptic you can name bar The Special Four Skeptics: F. Gervais, S. Avakyan, Will Happer, and Heinz Hug.
Here’s the news:
The 97 Percent Scientific Consensus on Climate Change Is Wrong—It’s Even Higher
[The consensus is 99.99%] …”according to James L. Powell, director of the National Physical Sciences Consortium, who reviewed more than 24,000 peer-reviewed scientific articles on climate change published between 2013 and 2014. Powell identified 69,406 authors named in the articles, four of which rejected climate change as being caused by human emissions. That’s one in every 17,352 scientists. “
Avoiding thousands of skeptical scientists is a minor achievement. Surveys of meteorologists, geologists and engineers, show half or more are skeptics. Likewise lists of thousands of named skeptics who endorsed a very skeptical statement far outnumber his “list” of unsurveyed believers-by-default.
But his study may give us insight into the size and purity of the government-funded climate science industry, which apparently numbers around 70,000 scientists. Though it could be that he’s inadvertently measuring the odds of getting a paper published in the peer review press with both “climate change” and an actual definitive statement that something other than CO2 causes it — the odds are about 0.0058%. No wonder most professional scientists know to avoid those magic keyword combinations. Though in Powell’s study, if you discussed how the sun explained global warming in the conclusion or the press release (but not the abstract or title) you’d be listed as endorsing the “consensus”. Smile!
 … Given the $7 billion in funding from the US government for the 2015 financial year, marked for climate science and clean energy, it is hardly surprising that there are a lot of papers about “climate change” and “global warming”. There are a lot of people studying how big the crisis might be, how to solve the crisis we might be having, and what the effects of this crisis might be (if we are having one). What there is not, are institutions of people specifically tasked to investigate how minor CO2 is, how beneficial it is, or to assess if the Sun controls most of our climate. Around the Western world there is no government funding specifically to audit or find problems with the man-made global warming theory. There are no programs with the sole purpose of finding natural causes to provide the counter arguments ($0). The purity is near complete. Skeptics mostly have to fund themselves. That’s a very high barrier to publication.
How to ignore thousands of scientists:
- Pretend that science is not about cause and effect, arguments, or evidence. It’s a voting game. Do we vote for gravity?
- Assume that “peer review” is part of the Scientific Method. Too bad for Edison, Einstein, Darwin, and those other non-reviewed guys and gals. Their work doesn’t count.
- Cut the study years back to 2013 – 2014. Who knew that these were the magic years of “scientific truth”?
- Include thousands of irrelevant studies. It’s hard to believe there are 12,000 papers a year studying the cause of global warming. Does his study include every possible variation of the effects of global warming instead, like lemur movements, and butterfly ranges? Hard to say without access to “Web Of Science”, but Powell guesses we’ll say these papers are not about global warming, and provides an example of a paper, which not so reassuringly … is not about global warming. Read the title: “Investigation on critical breakdown electric field of hot sulfur hexafluoride/carbon tetrafluoride mixtures for high voltage circuit breaker applications.” He argues that the authors say it is about global warming, because they mention the keywords “global warming” in the abstract. (I don’t suppose they they might be trying to justify their work or funding?) These authors may well be believers who are searching for a substitute for the greenhouse gas called SF6, but they aren’t studying the cause of warming. Have they even read a single paper discussing the critical water feedback assumption in climate models? Why would they? It’s not their job.
- Set the bar absurdly high. The abstract has to say “AGW is false” or specifically say that some other cause better explains global warming. This filters out, or counts as “believers”, scores of studies which imply that natural warming is more important, or that the models are exaggerating warming, or find observations that contradict some aspect of anthropogenic global warming, or are just plain cautious. The authors can discuss that in their conclusions, or leave the obvious implications unsaid — it’s easier to get published that way, and besides, abstracts are strictly limited, usually to 150 or 250 words, so no author is going to waste this precious space. These authors get included as “believers”.
A serious study of consensus would look only at papers aiming to assess the cause of global warming. Even papers on Arctic ice and Mt Kilimanjaro wouldn’t count. It would study the conclusions, not just the abstracts. It would still be profoundly unscientific — as any “consensus” study is — but it might at least raise it above the level of propaganda, having some sociological value. The Powell study is a parody. Ahem. But he is selling a book.
A better study of a consensus would survey scientists themselves instead of guessing what they think, and it wouldn’t just survey “climate scientists” but all scientists. The Scientific Method is the same no matter what field of science it is applied to. Any study that claims there is a consensus among scientists is being dishonest if it limits its attention to a tiny subgrouping of science. (As if only a secret guild of approved members have received the magic training.) If climate scientists have overwhelming evidence, they’d have no trouble convincing nuclear physicists, materials engineers, industrial chemists, and geologists — yet they are failing dismally.
A thousand holes in the theory is a 99.9% consensus?
From James Powell’s methodology:
2. I looked for clear statements that AGW is false or that some other process better explains the rise in global temperature. I did not count articles that report some discrepancy, such as the growth in Antarctic sea ice for example, but do not use that discrepancy as the basis for claiming that AGW is false. Any theory has discrepancies, observations that the theory cannot yet explain. They provide the next set of research problems. One discrepancy does not falsify a theory.
So one discrepancy does not falsify a theory? Einstein would disagree with that, but what would he know?
“No amount of experimentation can ever prove me right; a single experiment can prove me wrong.”
Albert Einstein
9.5 out of 10 based on 107 ratings
That didn’t take long. The recent UK election means the conservative government has the power to get rid of some subsidies for “low carbon”, “green” electricity, and make it easier for oil and gas. Renewable energy companies are feeling the pain, and complaining bitterly. Of course, if they were competitive, they wouldn’t need the subsidies and the stock market would throw money at them. Such is the fear, that there is an emergency summit happening within the green energy sector. “Scottish Renewables has warned the move could put up to £3bn of investment in Scotland at risk.” So $3 billion dollars was placed on a bet that the subsidies would continue, that the voters would not get sick of paying too much, and their bets have failed. I have no sympathy. Anyone playing the subsidy market should have done their homework. With the science shot with holes, the subsidies were always built on vapor. GWPF has all the stories.
The green tax target is going
Tim Ross, The Telegraph: Green energy subsidies spiral out of control
George Osborne to abolish coalition’s green tax target as customers face paying £1.5billion more through their bills to subsidise wind farms, solar panels and biomass plants.
The cost of subsidising new wind farms is spiralling out of control, government sources have privately warned. Officials admitted that so-called “green” energy schemes will require a staggering £9 billion a year in subsidies – paid for by customers – by 2020. This is £1.5 billion more than the maximum limit the coalition had originally planned. The mounting costs will mean every household in the country is forced to pay an estimated £170 a year by the end of the decade to support the renewable electricity schemes that were promoted by the coalition. Tory ministers are said to be “angry” at the scale of the over-running costs. They are blaming the Liberal Democrats who ran the Department for Energy and Climate Change for the past five years for the spectacular failure to control renewable energy programmes. –
How different is UK electricity to the Soviet system?
The UK government apparently indirectly decides the price of electricity, and they decided that companies “could” charge consumers for their costs of developing green electricity. If electricity were a free market, companies could choose to sell and develop cheap electricity and consumers could choose to buy cheap electricity and not subsidize research they thought was pointless. I’d like to buy the 4c/ kWh coal type of electricity (that’s wholesale, but where is the retail version?). The Lib Dems put in contracts that can’t be changed — pay the patrons and the big-government cheer squad, but don’t let the public choose.
How many UK would families would be happy if a man turned up at their door once a year demanding a cheque for £68 (soon to be £141), to develop expensive electricity generators in the hope of making the weather nicer for their great grandchildren? (And that’s only a part of the green bill.) Taxpayers would revolt.
Under the coalition, ministers decided that investment in new renewable energy developments, such as wind turbines, solar panels and biomass schemes, would be paid for by energy companies, rather than through taxation. Energy firms were allowed to recover the cost of these subsidies from their customers by adding it to household bills.
In order to limit the impact of the green schemes on customers, ministers set a strict cap on the total amount that could be spent in these consumer-funded subsidies for renewable energy. By 2020, the maximum amount to be spent through these subsidies was set at £7.6 billion a year. But new projections from DECC show this cap will be exceeded by a massive 20 per cent, or another £1.5 billion. Official figures showed that environmental levies added £68 to the average household bill last year. By 2020 this had been expected to rise to £141. But the latest DECC figures suggest the true figure will be closer to £170 as costs continue to mount.
Government sources say there is little that Mr Osborne can do because the subsidies have already been agreed under long-term contracts signed by DECC while Liberal Democrat ministers were in charge. — The Telegraph (see link above)
The British Government is also set to scrap the climate change levy exemption and stop money flowing from UK taxpayers to foreign renewable electricity generators. The levy was started in 2001 to try to improve energy efficiency, and the amount was estimated to be GBP 3.90 billion. I think making renewables pay on a level playing field is good, but why have a levy to change the climate at all?
Thanks to the GWPF. See also Renewable Energy Trust Funds Tumble On Osborne Cuts.
Green investment funds in the US are falling as well and asking for more subsidies
Keep reading →
9.3 out of 10 based on 74 ratings
|
JoNova A science presenter, writer, speaker & former TV host; author of The Skeptic's Handbook (over 200,000 copies distributed & available in 15 languages).

Jo appreciates your support to help her keep doing what she does. This blog is funded by donations. Thanks!


 Follow Jo's Tweets
 To report "lost" comments or defamatory and offensive remarks, email the moderators at: support.jonova AT proton.me
Statistics
The nerds have the numbers on precious metals investments on the ASX
|


Recent Comments