Recent Posts
-
60% are skeptics: Only 13% of UK voters say Net Zero is more important than cost of living
-
Friday
-
Climate change is causing South Africa to rise and sink at the same time
-
Thursday
-
Why is the renewables industry allowed to sponsor political advertising in schools and call it “education”?
-
Wednesday
-
In trying to be a small target, the Liberals accidentally disappeared
-
Tuesday
-
Monday
-
The best thing about the Australian election was that Nigel Farage’s party won 30% in the UK
-
Sunday
-
Saturday — Election Day Australia
-
Vote for freedom…
-
Friday
-
Bombshell: Sir Tony Blair says climate policies are unworkable, irrational, and everyone is afraid of being called a denier
-
Thursday
-
Blackout in Spain to cost 2-4 billion Euro, likely due to solar plants — blind and biased ABC says “cause is a mystery”
-
Wednesday
-
Days after Spain reaches 100% renewable, mass blackouts hit, due to mysterious “rare atmospheric phenomenon”
-
Tuesday
-
Help needed: Site under DDoS attack from hundreds of thousands of unique IPs this week — especially China and the USA
-
Monday: Election Day Canada
-
When the Labor Party talk about “The Science” the Opposition can easily outflank and outgun them with bigger, better science
-
Saturday
-
UK Gov spends £50 m to dim sun to create slightly less beach weather
-
Friday
-
The cocoa price crisis is a Big Government price fixing disaster, not a climate change one
-
Thursday
-
Blame the Vikings! Moss found in East Antarctica lived in warmer summers a thousand years ago.
-
Wednesday
-
Tuesday
-
Monday
-
Easter Sunday
-
Saturday
-
Good Friday
-
In crash-test dummy land, we solve teenage girl climate anxiety with $500b in fantasy weather experiments…
-
Thursday
-
Nothing says “Safe and Effective” like destroying all the data from Australia’s giant abandoned vaccine study
-
Wednesday
-
Who owns the oceans? The UN wants to tax ships to reduce carbon emissions — a $40b windfall for unaccountable global bureaucrats
-
Tuesday
-
Monday
-
Sunday
-
Saturday
-
Conservatives promise to axe the car tax that would have added $10k to petrol and diesel cars
-
Friday
-
The monster Green Tariffs we put on ourselves are worse than a foreign trade war
-
Thursday
-
Trump goes gangbusters on coal power and coal mining to supply AI energy demand
-
Wednesday
-
Instead of $8b in rebates, Labor could have built gas and coal plants and actually made cheap electricity
-
Tuesday
|
Back when CO2 levels were ideal, and there were 1 billion less cars than today, monsoons always happened in the same place, the rain was the same year after year, and there were no local extinctions of animals.
If we could only return to renewable slave power:
[ScienceDaily] The researchers identified five episodes over the past 6,000 years when dramatic changes occurred in Egypt’s mammalian community, three of which coincided with extreme environmental changes as the climate shifted to more arid conditions. These drying periods also coincided with upheaval in human societies, such as the collapse of the Old Kingdom around 4,000 years ago and the fall of the New Kingdom about 3,000 years ago.
“There were three large pulses of aridification as Egypt went from a wetter to a drier climate, starting with the end of the African Humid Period 5,500 years ago when the monsoons shifted to the south,” Yeakel said. “At the same time, human population densities were increasing, and competition for space along the Nile Valley would have had a large impact on animal populations.”
No climate models were harmed in the production of this paper.
Keep reading →
8.8 out of 10 based on 66 ratings
The ABC Drum Pater Burdon asks: Is democracy hurting our climate change response?
Indeed! Burdon is impressed with Naomi Orsekes’ speculation that China will “weather” the climate change storm because it is an undemocratic (and glorious communist) state. This same country builds the equivalent of a new coal powered plant every 10 days, and suffers from smogifying pollution so crippling that up to 250,000 people may be dying of it. Let’s try that “centralized” government where peaceful activists and people who complain about corruption get jailed or risk torture. And who could forget the “success” of big-government in China last century — no other style of government has successfully killed as many people, ever.
Burdon
Is it democracy that is blocking progress on climate change or the current limited version of it that pervades Western society? Peter D Burdon writes.
The third possibility is that democracy is working just fine, and the masses of “dumb” voters have it right. What if believers can’t convince the voters that their alarming-tax-plan can stop the storms because the case for a carbon-crisis is pathetically weak? Could it be that people don’t need a degree in the history of feminist art to see that climate scientists got it wrong, there is still snow, and the world is not like the simulations?
This is something Burton and the ABC fans simply can’t imagine:
“The strongest argument against democracy is a five minute discussion with the average voter.”
This glib remark supposedly from Winston Churchill encapsulates a scepticism that many people have about democracies and their ability to respond to a crisis. Democracy, according to this view, is an endless meeting that provides everyone (regardless of their expertise or ignorance) an equal say.
The real failure of democracy
The current failure of democracy is that Western nations are spending so much to solve a problem that most of their citizens don’t want their money spent on.
Badly designed polls with vague motherhood type questions can make it look like half the population wants to “do something”. But better polls show that most people don’t want to spend anything. In the UK 62% of people are skeptics. Globally, 63% don’t want their dollars spent on the environment…. The environment is low on the list of concerns, and only 3% of Americans name “environment” as the top issue. Worse for alarmists, climate change is low on the list of environmental issues — in Australia “climate change” ranked 7th out 8 of environmental concerns.
When big-government fails, the answer is more and bigger government
The inefficiency of democratic governance in responding to crisis is acknowledged in the wartime practice of increasing executive power and suspending debate and ordinary decision-making mechanisms.
Following this example, a number of climate advocates have begun considering the benefits of greater centralisation in decision-making to mitigate the devastating scenarios offered by climate scientists.
For example, in an interview about her new book The Collapse of Western Civilization, Naomi Oreskes argued: “If anyone will weather this storm it seems likely that it will be the Chinese.”
And so collective self reinforcing blindness makes it possible for Peter Burdon to suggest that the nation which produces more greenhouse emissions than any other nation, where democracy doesn’t exist, and where human rights are a real issue, might somehow be a nation we can look up to? A great leap forward indeed.
The largest moneyed interest stays invisible
Burton talks about the effect of “vested interests” on democracy, but completely misses the largest single vested interest by far.
Oh, the conspiracy of it all…
Keep reading →
9.3 out of 10 based on 99 ratings
 Order today 🙂 Buy a T-Shirt to help get Patrick Moore to Australia.
Wear it to BBQ’s to spark some fun.
 … LAST CHANCE TO ORDER – $30.00 (includes postage)
Details here: http://ow.ly/AVgun
They need 30 more orders to reach the amount for cheaper printing
…
……..
———–
UPDATE: Responding to comments. Messages on t-shirts do not have to be logical, grammatically correct, nor literally accurate. The more people who wear this the better.
Keep reading →
8 out of 10 based on 58 ratings
Ninemsn (major network news in Australia) held a small poll on it’s home page on Friday, asking Do you believe global warming is man-made?
 The ratio stayed roughly the same from start to finish. (Here, early on, it was 44% skeptical). Matty in Perth kept track of the tally, and while the poll seems to have disappeared off the home page (can anyone find an archive?) at last count it was 39,899 yes and 33,960 no which was 46% skeptic of a total of 73,859 votes.
Of course, these are unrepresentative, self selecting polls. It underestimates the number of skeptics. The latest CSIRO survey shows 53% of the Australian population don’t agree that “humans are causing climate change”. Nonetheless, we trust Nine news notices the large response of its own audience. There will be some major ratings wins out there for whichever commercial news service notices that almost everything they broadcast on climate change is a bore and a turn-off for half their audience.
And as far as the ABC goes, as I’ve said before, when it gives 50% of its climate budget and time to skeptical arguments we will know it is fulfilling its charter.
Image thanks to the Galileo Movement on Facebook. (Hop over and buy a T-Shirt)
8.8 out of 10 based on 80 ratings
For otherwise homeless thoughts…
8.3 out of 10 based on 23 ratings
He’s the new President of the British Science Association (I bet they are loving this media coverage) and has decided to move on from the old technique of debating scientific points on their merits. It’s too slow (especially if you don’t have… evidence). Instead he’s going with retro-science — Do you believe, sinner? It’s so retro, it’s retro-the-renaissance.
The Daily Mail UK
Politicians who do not believe in climate change should be ‘crushed and buried’, according to the new president of the British Science Association.
How much belief is enough, I wonder, to avoid the crushing? If a politician believed in the greenhouse theory but not the catastrophe, is that half crushed, or do we skip the squishing and go straight for the burying?
Sir Paul Nurse, who starts his presidency next week, pledged to ‘take on’ the ‘serial offenders’ who he accused of cherry picking scientific facts to suit their arguments.
In an extraordinary outburst, Sir Paul accused those who refuse to accept scientific orthodoxy on global warming of ‘distorting’ the facts.
Sir Paul singled out GWPF — as “pretending to talk about science” — and he whipped them mercilessly with ad hominem fallacies, generic infringements, petty insults, and argument by association.
He chanted the liturgical sacrament:
“‘Today we have those who mix science up with ideology and politics, where opinion, rhetoric and tradition hold more sway than adherence to evidence and logical argument.”
Lo, behold, it’s a form of confessional projection. If Sir Paul “swayed some evidence” he wouldn’t need to preach adherence to his ideology with violent threats, baseless opinions, and logical errors.
Time to write letters to the British Science Association.
9.4 out of 10 based on 113 ratings
Amazing what they can discover with data from just the last 130 years. Hey but it must be right. It’s bootstrapped!
Finally, the study you’ve been waiting for. Now we can be absolutely certain — it’s practically proven beyond all doubt — your SUV changes the climate.
We just need to assume the climate models understand the climate and that there are no longer natural cycles at work AND that there are no effects from the sun from the solar wind, solar magnetic fields, or spectral changes. Easy. (Don’t look at the evidence, the pause or all the model failures.)
The new headline:
99.999% certainty humans are driving global warming: new study
It’s at The Conversation – -the government funded site where government funded scientists discuss their bestest ideas.
 WARNING – Modern global temperatures (red) were homogenized with imaginary Vostok data for entertainment purposes only. See footnote* Obviously being 95% certain is not enough. Desperate believers are upping the ante. I guess all those people who were not convinced by 95% certainty will now switch over, blown away by the last 4.999% certainty that was missing before. It’s the third decimal place that does it.
PS: There’s a vote going on at NineMSM. See the poll in the middle of the page — Do you believe?
————————
*The graph contains satirical-risk. The blue line is Vostok. The red line is Vodka, “the globe” with polar-exaggeration. Don’t compare them under any circumstances.
9.1 out of 10 based on 94 ratings
The list goes on, and there is more to come.
In Deniliquin NSW, the homogenisation has lifted both the maxima and minima trends — again converting cooling to warming.
Graham Lloyd continues to increase the pressure on the Australian Bureau of Meteorology. In answers to Lloyd the BOM could only defend their work with the extraordinary statement that while some trends at individual stations look anomalous, overall the results “showed a similar warming trend to that of other international climate organisations. ”
So they inadvertently admit that they expect Australian trends to look like trends in other parts of the world. Despite the fact that Australia is drier, flatter and surrounded on every edge by oceans, the Bureau would consider it a fail if our trends were different to others? We’re in the opposite hemisphere to many international climate organizations, which may or may not matter, but we’ll never find out if we are trying to fit our data to theirs. And El Nino’s and La Nina’s mean very different things to countries on opposite sides of the Pacific. We’re blurring the resolution from thousands of data-points. The raw data is blended not just on regional scales but thanks to mindsets, on international scales too. It’s Groupthink, or should we call that Climate Freud at work?
The Australian Sept 5th, 2014
Bureau of Meteorology ‘adding mistakes’ with data modelling
 Both Maxima and Minima trends have changed after BOM homogenization.
SOME of Australia’s long-term temperature records may contain faults introduced by the Bureau of Meteorology’s computer modelling, according to a widely published expert.
David Stockwell said a full audit of the BoM national data set was needed after the bureau confirmed that statistical tests, rather than direct evidence, were the “primary” justification for making changes.
Keep reading →
8.4 out of 10 based on 89 ratings
People who have no cheap electricity burn wood or coal inside their homes to make dinner and stay warm. The smoke produces real pollution (as opposed to the fake kind which feeds plants). In India, some homes have pollution levels “three times higher than a typical London street”. Not surprisingly, living in smoke does not work out well for lungs and hearts. “Estimates suggest that household air pollution killed 3·5 to 4 million people in 2010. “
We can argue about the numbers and whether they are exaggerated, but there’s no doubt that millions of people would lead better lives if they had access to cheap electricity, which in practical terms means coal-fired power. In Niger, Africa, 17 million people use less electricity than Dubbo, NSW, a town of 40,000.
Where are the Greens? Children in poverty are suffering from lung damage now. The Greens priority is to spend billions to stop them dying in 2100 from seas rising at 1mm a year. How many people does expensive electricity kill? — Jo
———————————-
Household air pollution puts more than one in three people worldwide at risk of ill health, early death
Keep reading →
8.9 out of 10 based on 61 ratings
Was January 3rd 1909 in Bourke one of Australia’s hottest days ever?
The historic records say “125F” — or 51.7C.
The BOM say it was an observer error.
 Bourke and neighboring stations in NSW and QLD Australia Blair Trewin wrote a paper looking at the extreme highs in 1997. The Bourke record was made on a Sunday and in that particular year there are no records on other Sundays. On the other hand, I wonder what station observer would not notice a day that was 125F and head in to work to see exactly how high it was. The number 125F was handwritten in and underlined. You’d think observers would know it was a special figure, and pay attention.
The town of Bourke got a Stephenson Screen only a few months beforehand in August 1908, so it had good modern equipment. But Trewin thinks the record is an observer error, and points out that it was a lot warmer in Bourke than in other surrounding towns like Thargomindah, Walgett, and Coonable, and by about 6.9C degrees, which is an unusual gap. During the rest of the month Bourke was “not exceptionally hot compared to other stations”. Fair point. But Jen Marohasy responds that “newspaper reports show the nearest station, Brewarrina, had recorded 123F (50.6C) on the same day (January 3, 1909).” Official Brewarrina records don’t start until 1911.
 For scale. Bourke and neighbors. I can understand why there is some debate about this record, but I don’t understand how it’s scientifically accurate to issue press releases declaring that we know Australian temperature trends, or understand how our extremes have changed. The statement “hotter than any time since 1910” might be technically accurate in a way, but is very misleading when it relies on guesses about which high numbers were accidents, and avoids any mention at all of the hot weather before 1910.
It is great to see Graham Lloyd is fearless in following the data and arguments.
The Australian “Heat off Bourke after Bureau of Meteorology revision”
THE removal of a longstanding temperature record at Bourke of 125 degrees Fahrenheit (51.7C) set in 1909 was the result of a critical 1997 paper that revised a string of records and brought Australia’s hottest recorded temperature into the second half of the 20th century.
Until the paper by Blair Trewin, who is now a leading climate scientist at the Bureau of Meteorology, Australia’s hottest recorded temperature was 53.1C at Cloncurry on January 16, 1889.
Keep reading →
8.9 out of 10 based on 97 ratings
We’ve seen the remarkable change of the Rutherglen record as it got homogenized. This long running rural record that looks ideal apparently had “unrecorded” station moves found by thermometers miles away. Already we have found Bill Johnston who did some work at Rutherglen who confirmed that the station did not move. The mystery grows?
Since early 2012 Ken Stewart has been asking the BOM which neighbouring stations were used. Finally, after pressure from The Australian, the BOM has provided the 17 names, and Ken has graphed them.
Follow the chart below. Rutherglen temperatures start off in blue. The yellow line is the average of the 17 “neighbours” which are used to homogenize that blue line and transform it into the red one which somehow ends up being colder than its neighbours in 1952 and warmer than its neighbours in all the last 30 years.
See if you can figure it out?
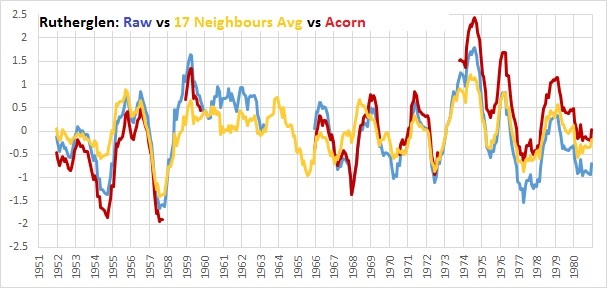 Rutherglen starts off blue. Then the yellow line is used to homogenize that blue line into the red one. Presumably the BOM technique would be a lot more complicated that what Ken has done, but clearly replicating that ACORN final trend is not going to be easy.
The 17 neighbouring places stretch from Beechworth in the foothills of the Victorian Alps, to Hillston on the flat plains of hot New South Wales. Hillston is about 370km by road from the wine growing district of Rutherglen. It’s 300km direct according to this estimate. Hey but maybe their climate trends are more similar than they appear…
Hillston is the top left red dot on the map below.
Keep reading →
9.3 out of 10 based on 112 ratings
 Blades being chopped for transport. | Global Cement Magazine It’s the new alternative fuel — decommissioned turbines. There are 21,000 wind turbines in Germany alone at the moment. With 15,000 tons a year of old blades expected to be dumped by 2019, it’s a real problem to get rid of them. The EU says they can’t be dumped in landfill. Here’s the perfect solution. Chop them, shred them, then deliver the fibreglass reinforced plastic to the local cement plant. The resins hold 15MJ per kilo. “One tonne of resin saves 600 kg of coal at the cement plant!”
It’s a win-win all round. Residents get rid of the bird chopping towers, the cement plant gets energy, and the windmills may, possibly for the first time, save some CO2 for the Greens. What’s not to like?
Indeed this is recycling you can like. The raw materials in old blades can even be used in the cement too.
Wind Turbines make good alternative fuels for cement production.
Global Cement Magazine Sept 2014 page 10
Keep reading →
9.4 out of 10 based on 90 ratings
What is striking about Andy Pitman and Lisa Alexander’s response to the articles in The Australian, on The Conversation, is how intellectually weak it is, and how little content they have after we remove the logical fallacies. It’s argument from authority, circular reasoning, and strawmen. Hail the Gods (and don’t look over there)! They don’t question Jennifer Marohasy’s remarkable figures, they don’t even mention them at all, nor use the names “Rutherglen”, “Amberley” or “Bourke” –how revealing.
And these are the points at issue. Long cooling trends at supposedly excellent sites had been homogenized and transformed into warming trends. Rutherglen is the kind of station other stations dream to be: it has stayed in the same place according to the official documents, isn’t affected by the heat from urban growth either and is similar to its neighbors. Other stations might be adjusted to be more like it. Instead the BOM has a method that detected “unrecorded” site moves at Rutherglen by studying unnamed stations somewhere in the region. Awkwardly, someone who used to work there says the thermometer didn’t move. Hmm. Would a thinking person ask for more details and an explanation? Not if you are director of an ARC Centre of Excellence for Climate System Science or a Chief Investigator of the same institution. This is apparently how Excellent Climate Centres work. The thermometers and trends for Rutherglen were wrong all along, off by nearly 2 degrees for 70 years. Luckily the experts finally arrived to fix them, but using thermometers that might have been hundreds of kilometers away?
It seems a bit magical. But Pitman and Alexander offer no scientific or physical reason why it makes sense for long cooling trends in raw data to be dramatically changed in stations which are supposed to be our best. Nor do they even try to explain the BOM’s lack of curiosity of decades of older data at Bourke either. Perhaps there are reasons years of historic data can’t be analyzed and combined to look at long term trends, but if there is, Pitman and Alexander don’t know it and apparently don’t care too much either.
Instead we hear that homogenization is used all over the world, but in lots of different forms, and sometimes not at all.
Data homogenisation techniques are used to varying degrees by many national weather agencies and climate researchers around the world. Although the World Meteorological Organization has guidelines for data homogenisation, the methods used vary from country to country, and in some cases no data homogenisation is applied.
Is this supposed to make us feel confident that the Australian BOM uses the “right” version, and no one should even ask questions about the details? Skeptical scientists (as opposed to Directors of Excellence) have been asking for these details of individual site adjustments for years. The BOM could have provided the answers and silenced the critics long ago. Instead skeptics were delighted when Graham Lloyd at The Australian finally managed to elicit three paragraphs of details on three sites. Pop the Champagne, eh?
To answer the critics Pitman draws on the elite gods of ClimateScienceTM to help him. Unlike other fields of science where one expert can explain things to another scientist, in BOM-science they use, wait for it, “complex methods” that apparently can’t be discussed. Besides Blair Trewin has written a “comprehensive” article. It must be good. Likewise, annointed Climate Elves called Itsi’s are allowed to talk about which homogenisation method might be better than others, but scientists outside the fairy circle are not.
Perhaps it’s understandable that Pitman and Alexander didn’t bother explaining any of the details — they are writing for The Conversation, after all. It’s not like it’s an educated high level audience…
Who is cherry picking?
The handy thing about climate parameters is there are plenty of trend-cherries to pick: there are maxima, mean, minima, and extremes, and they are grouped by region or state, or national memes. Hot days can be defined lots of ways: over 40C, 37C, 35C, or the 10th percentile above the monthly mean.
Luckily for Pitman and Alexandra, there was at least one example from these permutations and combinations that showed cooler trends after homogenization. That little category is “Trends in the frequency of hot days over Australia – unadjusted data using all temperature stations that have at least 40 years of record available for Australia from the GHCN-Daily data set.”
Skeptical scientists like Ken Stewart instead just looked at big basic parameters like the average minima across the country of 100 plus stations and found the adjustments warmed the trends by 50%.
This climate has a circular trend?
Circular Reasoning Prize for the day goes to this line, bolded:
If the Bureau didn’t do it (homogenisation), then we and our fellow climatologists wouldn’t use its data because it would be misleading. What we need are data from which spurious warming or cooling trends have been removed, so that we can see the actual trends.
What “actual” trends? Since the Models of Excellence are not-so-excellent at predicting the climate, this translates to saying that broken models don’t work with unhomogenized data. (Could be a clue there, you think?)
Apparently the editors of The Conversation find argument from authority and circular reasoning appealing. (Forgive me, what well-trained academic wouldn’t?)*
The mismatch in the PR
There is another layer to this. Even if the adjustments can be physically justified with documents, the grand uncertainty in Australian datasets is never conveyed in BOM press releases which announce records that may rely on adjustments of up to 2 degrees to temperatures recorded 70 years ago. Even if the adjustments are justified, isn’t it important for the public to know how complicated it is and how fickle most of these records are when they may disappear with the next incarnation of “high quality” data?
Strawmen to mislead?
Andy Pitman is keen to suggest skeptical scientists make false accusations:
The Bureau has provided the details of how it is done, despite facing accusations that it has not been open enough.
But skeptics accuse the BOM of not documenting individual site specific explanations. In return, Andy Pitman keeps that trend going by responding to questions about Amberley, Rutherglen and Bourke without mentioning, er… Amberley, Rutherglen or Bourke.
Peer review makes scientific arguments “Valid”?
It doesn’t matter if skeptics are logical and have empirical evidence, what matters to Andy Pitman and Lisa Alexander is whether those ideas have been passed by two anonymous unpaid reviewers.
Valid critiques of data homogenisation techniques are most welcome. But as in all areas of science, from medicine to astronomy, there is only one place that criticisms can legitimately be made. Anyone who thinks they have found fault with the Bureau’s methods should document them thoroughly and reproducibly in the peer-reviewed scientific literature. This allows others to test, evaluate, find errors or produce new methods. This process has been the basis of all scientific advances in the past couple of centuries and has led to profoundly important advances in knowledge.
All scientific advances in the last two centuries? Tell that to Newton, Einstein, Watson and Crick. They were not peer reviewed. On the other hand these 120 scientific advances were peer reviewed, that is until someone realized they were computer generated gibberish, and un-published them.
Is that more the type of Excellence our ARC strives for?
————————————-
*Apologies to the exceptions who survive in academia.
9.6 out of 10 based on 125 ratings
Here’s the new desperate meme about to turn your weather report into an advertisement for carbon trading. The people are not scared enough. Say hello to scientismic marketing. It sure isn’t science.
The generators of Climate Fear start with broken models that we know don’t predict global temperatures, upper tropospheric humidity, Antarctic sea ice, and ocean heat (or much of anything else). They then use these to model the chances of individual storms, or floods — something they were not designed to do. Then they run these mistakes 5 million times with and without the magic CO2 forcing. They might as well stand back, look solemn, and pick a percentage or throw a dart. The great thing is, only God knows the right answer. The models can’t “miss”.
Was that flood 35% due to man-made emissions? Was that tornado 50% more deadly? (Did it rain on your wedding day? Sue someone!)
Of course, New Scientist swallows the theme whole, tea-leaves and all. No hard questions asked.
A new technique connecting individual weather events with the impact of greenhouse gas emissions could bring climate change into everyday weather reports
“Well, the record-breakingly hot summer is showing no sign of cooling down. No thanks to us: the heatwave was made 35 per cent more likely by human greenhouse gas emissions.”
The method — all based on the assumptions that models have “skill”:
To explore whether climate change was making such precipitation more likely, Schaller and her team ran a similar experiment to Stott and Allen’s. They used real-world data to simulate the season that had just passed, then stripped the data of the influence of greenhouse gas emissions and ran the simulation again. The scenario was simulated thousands of times in order to calculate the odds of getting a bout of extremely wet weather at that particular time of year.
We all know numbers and percentages make wild baseless guesses look real, so this is a good way to generate authoritative sounding press releases:
They concluded that what was a 1-in-100-year event without global warming had become a 1-in-80-year event. In other words, human emissions made the extreme levels of rainfall experienced in south-east England 25 per cent more likely.
The team’s results were published online on 30 April, just two months after the flooding abated.
If an extreme weather event occurs, researchers can look to see if the models predicted it. If it was predicted in the real-world seasonal forecast but not in the scenario which is stripped of emissions, then it was made more likely by climate change – a likelihood that can be calculated.
The big “news” here is that this new method is so much better because it’s faster. It’s not about accuracy (and never was). The real issue is the speed of propaganda:
… several studies have used similar methods (see “Blame warming?“), but they all have dealt with events long after they have left the public consciousness.
It’s a bummer when issues leave the public consciousness. The poor stupid public can’t remember floods and cyclones for more than a week. What we need is real-time climate-blame, apparently:
In the new set-up, a real-world seasonal forecast driven by data on current sea-surface temperatures will be run alongside a simulated “no global warming” seasonal forecast, in which greenhouse gas emissions have been stripped out.
Then like shooting fish in a barrel, “scientists” can look back-with-hindsight at scores of broken models to see which ones accidentally got that particular extreme event right. Monkeys and models, eh?
If an extreme weather event occurs, researchers can look to see if the models predicted it. If it was predicted in the real-world seasonal forecast but not in the scenario which is stripped of emissions, then it was made more likely by climate change – a likelihood that can be calculated.
It won’t matter to a scientismic marketer whether the “right” model is a different model each time. They won’t be issuing 39 press releases when 39 models get it wrong. They’ll just cherry pick the lucky one and we can all goo-and-ahh at how clever they are.
It is, naturally, about money and power. What UN bureaucrat could turn down the excuse to be the conduit for billions of dollars they never had to earn?
International climate talks could be affected too. At recent United Nations meetings, it has been broadly agreed that money needs to be channelled from rich nations, which are historically responsible for the bulk of emissions, to poorer nations, which tend to suffer most from the impacts of those emissions. One way to do that would be to assign compensation after a nation suffers losses due to climate change. But in order for that to work, there needs to be a way to show that an island hit by a typhoon, say, would probably have been spared if global warming hadn’t been a factor. Weather-attribution studies could provide that information.
The real issue “ultimately” is about the western paying public who simply don’t give climate fearmongers enough respect or money.
Ultimately, though, the key contribution of this work may be to get through to a general public for whom climate change has long been an abstract concept. By showing that what’s going on outside someone’s window is directly linked to climate change, researchers hope it will become obvious that what they are saying isn’t just a load of hot air.
How “abstract” is climate change? Lucky we have science magazines to make storms, floods and rain real for dumb voters who don’t understand these things going on outside the window.
The problem for Catherine Brahic is that the dumb voters do understand, they realize the climate always changes, they realize the modelers have failed, they know ice ages and hotter times have come and gone without any man-made CO2. They remember the prediction that children won’t know what snow is.
Non Scientist, long ago threw away scientific rules of logic and reason and the need for empirical evidence. Shame. It used to be an excellent magazine. Vale Nigel Calder.
I want the word scientist back. This faith in models is no better than rune stones.
9.3 out of 10 based on 105 ratings
Hello Soviet style weather service? On January 3, 1909, an extremely hot 51.7C (125F) was recorded at Bourke. It’s possibly the hottest ever temperature recorded in a Stevenson Screen in Australia, but the BOM has removed it as a clerical error. There are legitimate questions about the accuracy of records done so long ago — standards were different. But there are very legitimate questions about the BOMs treatment of this historic data. ‘The BOM has also removed the 40 years of weather recorded before 1910, which includes some very hot times. Now we find out the handwritten original notes from 62 years of the mid 20th Century were supposed to be dumped in 1996 as well. Luckily, these historic documents were saved from the dustbin and quietly kept in private hands instead.
Bourke has one of the longest datasets in Australia — but the BOM, supposedly so concerned about the long term climate trends, appears to have little curiosity in the hot weather of the 1880’s and 1890’s (I talked about the amazing heatwave of 1896 here where hundreds died and people in Bourke escaped on special trains). If it had been a cool spell then, would the BOM feel more inclined to put some effort into analyzing them? All of the 50+ temperatures recorded do have a story to tell, yet they lie invisible in news reports of the 21st Century.
Perhaps most seriously, the regular BOM press releases of hottest ever records now rarely give any indication that these earlier hot records existed at all.
Ian Cole lives in Bourke, and runs the local radio station. For years, his father Neville used to do the meticulous recordings every three hours. Ian Cole feels very frustrated that he can’t broadcast any of that information to listeners in weather reports — the BOM won’t supply any data before the year 2000 to the official Weatherzone service provider. He remarked that “We keep on being told about records that are not actually records and averages that are not quite right”.
Bourke got new automated weather recorders in 1994, with a two year overlap of manual and new equipment.
Bourke raw Maxima trend: was 1.7C cooling, now increased to a slight warming trend
Bourke raw Minima trend: was 0.53C warming, now increased to 1.64C warming trend
–These trends, calculated by Jennifer Marohasy have not been disputed by the BOM
Graham Lloyd at The Australian continues to ask the questions the BOM should have been asked for the last ten years.
 The modern “trends” do not convey the temperatures that were actually recorded at Bourke. Where is the respect for historic records?
Weatherman’s records detail heat that ’didn’t happen’
AS a child, Ian Cole would watch his father Neville take meticulous readings from the Bureau of Meteorology thermometer at the old post office in the western NSW town of Bourke and send the results through by teleprinter.
The temperature was recorded every three hours, including at night when the mercury sometimes plunged to freezing, and the data was logged in handwritten journals that included special notes to help explain the results.
For Mr Cole it is a simple matter of trusting the care and attention of his father. “Why should you change manually created records?” Mr Cole said. “At the moment they (BOM) are saying we have a warming climate but if the old figures are used we have a cooling climate.”
Thank goodness someone saved the original notes:
Keep reading →
9 out of 10 based on 120 ratings
 You, foolish plebian, thought that a hair dryer was for drying hair. Not so. The purpose of a hair dryer is to change the climate. Let’s stop the storms by slow-mowing the lawn. That sort of thing… You, foolish plebian, thought that a hair dryer was for drying hair. Not so. The purpose of a hair dryer is to change the climate. Let’s stop the storms by slow-mowing the lawn. That sort of thing…
Thus and verily has the EU announced that high-power appliances may now be banned.
[Telegraph]
EU to ban high-energy hair dryers, smartphones and kettles
European Union to ban dozens of high-wattage household electrical appliances in follow-up to controversial ban on powerful vacuum cleaners
A study ordered by the European Commission, currently in draft form, has identified up to 30 electrical appliances including lawn mowers, smart phones and kettles that could be covered by the EU’s Ecodesign directive outlawing high-wattage devices.
Serfs in the EU will probably spend longer drying their hair, and more time waiting for the kettle to boil in a quest to produce slightly less CO2. This is in the hope that less CO2 might cool a world that hasn’t really warmed for a decade and a half. It’s a case of not so much blow-drying, and more slow-drying. Likewise, stupid punters may wonder how a lower power kettle can reduce emissions. The laws of physics suggest water is heated by watts, P(W) = E(J) / t(s) and all. Hence lower watts equates to more time to reach boiling point. In the end, either you have cold tea or you use the same amount of energy and produce the same amount of emissions.
I suppose the obvious thing is for the EU to legislate that water will boil at 90C.
Methinks ultimately this will use more electricity and produce more emissions. It is possible that punters, tired of waiting, will simply boil more water at the start of the day, leaving the kettle fuller and hotter all day in between cups of tea. Likewise, 2500W fan heaters make good substitutes for hair dryers. China may start producing fan heaters that you can hold in one hand.
If there are any manufacturers left in Europe which still export hair-dryers or small electrical goods, I guess those factories in Guandong look all the more appealing now. Shame about the jobs.
Get in now and buy modern electrical goods while you can.
On Monday many of the best vacuum cleaners available for sale in the UK will be banned as a result of the EU energy efficiency rules that prohibit the manufacture or importing any vacuums with motors above 1,600 watts.
Tesco said sales of the most powerful vacuums had soared by as much as 94 per cent for some models after the Telegraph reported consumer group Which? urging shoppers to act quickly before they sold out forever.
The EU is out of control. Send letters to your politicians now. Don’t ask for this legislation to be amended, ask for the EU to be amended. Your nation should leave now.
9.5 out of 10 based on 116 ratings
 Bronwen O’Shea, ABC UPDATED: Correction. The interview was done by a fan of John Cook, not John Cook. Notes in the post and apologies. – Jo
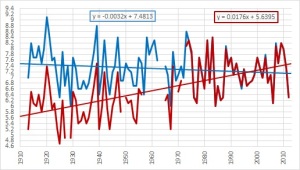
Hm, curious event on the ABC today. Credit to Bronwen O’Shea, host of the ABC morning radio program for the Goulburn Murray, for asking both Jennifer Marohasy and the BOM to discuss the Rutherglen temperature adjustments. Good-o, I say — public debate and answers! (Note that link is just to their website, I have not found a copy of the interview or transcript).
But everything worked against the ABC. First the BOM chose not to even try to answer. (Hm?) Then not long after the interview started, the line suddenly went dead and Marohasy was abruptly cut off. She waited for the call back, but it never came. What bad luck eh? Even more unlucky — when the ABC tried to call her back they got a fan of John Cook on the phone instead*. Then, things got even worse for poor ABC listeners — because the fan of Cook mistakenly thought Rutherglen was different to the surrounding stations, but the BOM raw records say otherwise (see the graph below). UPDATED: Apologies to John Cook from Jen and myself for the error. If he wants to explain his views on the BOM and homogenization, I’m happy to post them here. – Jo
I’m sure the ABC wouldn’t want to mislead its listeners and hide serious questions about the BOM’s record of our temperatures. They are concerned about climate change after all, so for the sake of the environment I expect they’ll ask Marohasy back on to finish her points and explain why the talkback caller was wrong. [We are trying to get a transcript or copy of the interview. The ABC said they are unable to supply one.]
Details follow…
Doesn’t the BOM want to defend these attacks on ACORN (their new temperature record)?
Keep reading →
8.9 out of 10 based on 134 ratings
David Karoly knew he had to defend the BOM with regard to the hot questions about adjustments to Amberley, Bourke, and Rutherglen data. What he didn’t have were photos of historic equipment, maps of thermometer sites, or quotes from people who took observations. Instead he wielded the magic wand of “peer review” — whereupon questions asked in English are rendered invalid if they are printed in a newspaper instead of a trade-magazine.
Prof David Karoly, Climate Professional called people who ask for explanations poorly informed amateurs. In response, we Poorly Informed Climate Amateurs wonder what it takes to get Climate Professionals to inform us? Instead of hiding behind ‘peer review’, vague complex methods, and the glow of their academic aura, the professionals could act professional and explain exactly what they did to the data?
We discussed the mysterious transformation of Amberley and Rutherglen — where cooling trends became warming trends due to unrecorded site movements that were detected by thermometers hundreds of kilometers away. I also discussed how skeptical scientists have been asking for details for years but the BOM would not provide them. What we still don’t know is why thermometers in 1941 were recording temperatures nearly 2 degrees celcius too high at both Rutherglen and Amberley and why records this inaccurate are included in our national database? Nor do we understand why the error was not discovered for 70 years or why the BOM apparently didn’t ask the people who worked there at the time. We are grateful though, that so many RAAF planes at Amberley operated safely despite the poor equipment.
The articles by Graham Lloyd on Jennifer Marohasy’s analysis are generating debate.
Letters to The Australian 28th August 2014
Bill Johnston, former NSW natural resources research scientist, Cook, ACT
DAVID Karoly’s response is a contradiction. He is a well-known climate activist and editor-in-chief of the Australian Meteorological and Oceanographic Journal. Independent peer-review or not, he is quoting his own stuff, which he published in the journal he edits.
His claim about amateurs is both silly and frustrating. We live in a marketing age and everybody should question everything. Joining dots is not science.
In the article he referred to, Karoly stitched together two sets of data. He chose to end one set, which was relatively continuous, in 1950. The second set, from 1910 to 2010, was the heavily homogenised Australian Climate Observations Reference Network — Surface Air Temperature data. Most ACORN-SAT series were derived by stitching together data from, for instance, now closed post offices and airports to form a single series. For some, gaps were filled using more distant stations. Karoly knows this.
He should also know that for his 1910 to 1950 comparison, most of the compared data sets were identical. They were long-term post office, pilot station and lighthouse data. Irrespective of homogenisation, close agreement could therefore be expected for those years.
Keep reading →
9.3 out of 10 based on 116 ratings
The hot questions for the Australian Bureau of Meteorology (BOM) mount up. Rutherglen was one of the temperature recording stations that was subject to large somewhat mysterious adjustments which turned a slight cooling trend into a strongly warming one. Yet the official notes showed that the site did not move and was a continuous record. On paper, Rutherglen appeared to be ideal — a rare long rural temperature record where measurements had come from the same place since 1913.
The original cooling trend of – 0.35C was transformed into a +1.73C warming after “homogenisation” by the BOM. To justify that the BOM claims that there may have been an unrecorded shift, and it was “consistent” with the old station starting further up the slope before it moved down to the hollow.
Today retired scientist Bill Johnston got in touch with Jennifer Marohasy, with me and with Graham Lloyd of The Australian to say that he worked at times at Rutherglen and the official thermometer had not moved. It was always placed where it is now at the bottom of the hollow. That information has already made it into print in The Australian.
 The original thermometer records suggest a slight cooling trend. The adjusted ones (red) are very different.
From The Australian: “Climate records contradict Bureau of Meteorology ”
Retired scientist Bill Johnston, who has worked at Rutherglen, said a temporary thermometer had been put on higher ground near the office of the farm but it never provided temperatures to the bureau.
“Some locals thought the official data was not particularly inviting for winter tourists,’’ Dr Johnston said.
“So they established a second Stevenson screen near the office on a watered lawn, near fruit trees, so it was pretty useless as a weather station.”
That BOM explanation of the adjustment (again):
Keep reading →
9.6 out of 10 based on 132 ratings
It’s the news you’ve been waiting years to hear! Finally we find out the exact details of why the BOM changed two of their best long term sites from cooling trends to warming trends. The massive inexplicable adjustments like these have been discussed on blogs for years. But it was only when Graham Lloyd advised the BOM he would be reporting on this that they finally found time to write three paragraphs on specific stations.
Who knew it would be so hard to get answers. We put in a Senate request for an audit of the BOM datasets in 2011. Ken Stewart, Geoff Sherrington, Des Moore, Bill Johnston, and Jennifer Marohasy have also separately been asking the BOM for details about adjustments on specific BOM sites. (I bet Warwick Hughes has too). The BOM has ignored or circumvented all these, refusing to explain why individual stations were adjusted in detail.
The two provocative articles Lloyd put together last week were Heat is on over weather bureau and Bureau of Meteorology ‘altering climate figures, which I covered here. This is the power of the press at its best. The absence of articles like these, is why I have said the media IS the problem — as long as the media ignore the BOM failure to supply their full methods and reasons the BOM mostly get away with it. It’s an excellent development The Australian is starting to hold the BOM to account. (No sign of curiosity or investigation at the ABC and Fairfax, who are happy to parrot BOM press releases unquestioned like sacred scripts.)
Graham Lloyd sent the BOM a draft of his feature article for The Australian last Tuesday or Wednesday. The BOM finally replied at 5.30pm on Friday night as the last draft was almost ready to print. I’ve copied the whole BOM response here. I explain below why this is a good response for skeptics.
The BOM rely on the usual vague wordy explanation with the unscientific reasoning that homogenization is necessary according to “international literature”. (I guess there is a consensus then, and we all know what that’s worth.) It is the scientific equivalent of saying “we’re experts — trust us”. No one would accept that from a company accountant, why from a scientist?
Here’s the Amberley graph again:
 This is the odd case of Amberley minima laid bare. The people living in Ipswich nearby had to wait 70 years to find out that their mornings in 1941 were really almost 2 degrees C colder than what they were told at the time. The marvel of modern science. It’s amazing the planes didn’t crash more often. Here’s the BOM explanation:
“Amberley: the major adjustment is to minimum temperatures in 1980. There is very little available documentation for Amberley before the 1990s (possibly, as an RAAF base, earlier documentation may be contained in classified material) and this adjustment was identified through neighbour comparisons. The level of confidence in this adjustment is very high because of the size of the inhomogeneity and the large number of other stations in the region (high network density), which can be used as a reference. The most likely cause is a site move within the RAAF base.”
Translated: So the Amberley thermometer might have secretly moved (and that might be classified) but we are sure it shifted one way or the other. Even though we don’t know where it was before, or how much difference that makes, we can figure out what the thermometers should have been recording in 1941 because of other stations which are hundreds of kilometers away.
Even more strange is that the nearest ACORN station is Brisbane Aero, 50km away, which also shows a long term cooling trend. (Paul Homewood has some good graphs on that.) It seems other stations further away are better at recording Amberley temperatures than thermometers at either Amberley or Brisbane.
But hey, perhaps the runways were extended at Amberley, perhaps the thermometer moved, and perhaps the RAAF forgot to record the change. It happens. But if so, doesn’t that tell us something very important about the quality of the best 100 temperatures stations that made the grade for the ACORN data set? If the Amberley site is so bad it needs this kind of adjustment due to a theoretical and unrecorded site move, does that mean the rest of the hundreds of thermometer sites around the country are even worse?
Alternately, could it be that the Amberley cooling trend is real? If that’s the case, the BOM is actively destroying climate information contained in the data by adjusting both Brisbane and Amberley up. If climate change caused systems, like say, high pressure cells, to shift north or south, then homogenizing data with every station for hundreds of kilometers will blur out this resolution entirely. (No wonder the poor climate models don’t work, they don’t stand a chance.)
More unrecorded station moves in Rutherglen in Victoria
A cooling trend of -0.35C became a warming trend of +1.73C.
Fig.5: Rutherglen minima Source: Ken Stewart updated the ACORN raw v Adjusted graphs
The BOM says:
Rutherglen: the major adjustments in minimum temperature data are in 1966 and 1974. Both were detected through comparisons with neighbours. The nature of the change is consistent with the site moving from a location near the main experimental farm buildings (which are on a small hill) to its current location on low-lying flat ground (minimum temperatures are normally higher on slopes than on flat ground or in valley bottoms).
Translated: Special thermometers (which we don’t name) show that this site probably moved, even though that wasn’t recorded. If theoretically it used to be on a small hill near the station (it might have been) then those minimums would suddenly drop and so we have accounted for that.
Jo says: Let’s check out those neighbors (Deniliquin, Wagga Wagga, Sale, Kerang, Cabramurra)
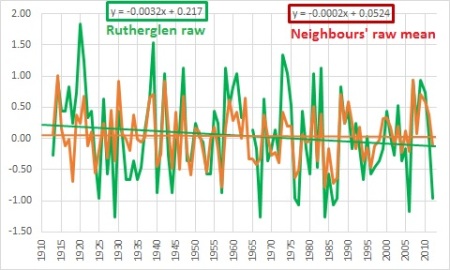 The raw minima of Rutherglen and it’s neighbors before “adjustments”. Thanks to Ken Stewart
Righto. Spot the warming trend. This is “consistent” with a site that does not need a major warming adjustment.
Perhaps the Rutherglen cooling trend is real? (Does climate change cause colder minima or more frosts in rural Victoria?)
Again, as with Amberley, the message about the ACORN set is the same.
If any readers out there happen to have worked at Amberley, or knows someone who did, or have photos of Amberley which may include the white Stephenson Screen Boxes we’d be very happy to hear from you. Likewise Rutherglen or Bourke. We have some good leads on this already. Keen to hear more.
Who needs thermometers to know the temperature?
The all new world-class ACORN data set is based on imagined site moves. Using this BOM technique — if someone wanted to find a national cooling trend they could spot suspicious step changes “consistent” with unrecorded site moves at other stations. These could be adjusted down with nameless stations anywhere within 500 km (which may or may not show cooling, that doesn’t really matter) . Et Voila. Why do we bother with thermometers? It would be cheaper to record the temperature across Australia from one computer model in Canberra.
Where are those long records at Bourke?
When it comes to Bourke, Jennifer Marohasy’s point was about the good quality historic data the BOM ignores from before 1910. In response, the BOM ignored the point about how they ignore the data.
Bourke: the major adjustments (none of them more than 0.5 degrees Celsius) relate to site moves in 1994 (the instrument was moved from the town to the airport), 1999 (moved within the airport grounds) and 1938 (moved within the town), as well as 1950s inhomogeneities that were detected by neighbour comparisons which, based on station photos before and after, may be related to changes in vegetation (and therefore exposure of the instrument) around the site.
Like the other sites above, an inhomogeneity was apparently detected through site comparisons, and “may” be related to vegetation changes. How do we know vegetation slowly changed some measurements? Other thermometers at other sites (which may be hundreds of kilometers away) got an average of a slightly different trend — luckily the BOM knows that it’s not because vegetation grew at some of those sites, or wind patterns shifted slightly bringing warmer or cooler air.
As Jennifer notes on her site:
Blair Trewin explains that up to 40 neighboring weather stations can be used for detecting inhomogeneities and up to 10 can be used for adjustments. What this means is that temperatures, ever so diligently recorded in the olden days at Bourke by the postmaster, can be change on the basis that it wasn’t so hot at a nearby station that may in fact be many hundreds of kilometres away, even in a different climate zone.
Consider the recorded versus adjusted values for January 1939, Table 1. The recorded values have been changed. And every time the postmaster recorded 40 degrees, Dr Trewin has seen fit to change this value to 39.1 degree Celsius. Why?
Let’s look at that missing 40 years of data. It was recorded with slightly different equipment — a non-standard Stephenson screen or a Glaisher Screen, but both are quality instruments. Hence it would need some adjustment, but it is reasonable and possible to create a long term record. Probably it wouldn’t need as much adjustment to match with modern Stephenson screens as the modern Stephenson screens need to be “adjusted” to match themselves.
 The pre treatment shows only the Post Office measures. In the post treatment the early Post Office recordings were dropped, and the airport measurements were added in recent times. The bottom line
In all three cases above the BOM tacitly admitted Jennifer Marohasy has the calculations of the trends right, and the massive changes from raw to adjusted really happened. In all three cases the weasel words “likely”, “consistent” and “may” are used with speculative undocumented reasons for changes. How are imagined and unrecorded site moves “consistent” with the definitive certainty of headlines like “hottest ever year”? Next time we’re told it’s another warmest September night in East Where-ever, will we hear that it’s a tenth of a degree warmer, but only according to a bunch of homogenized, adjusted thermometers which may have been 300 km away? Will anyone mention that warmer nights were reported in newspapers of the day, but they were discovered to be wrong 70 years later?
Crikey, what if thermometers today are reading too high? Do we need to wait til 2074 to figure out how hot Australia really was in 2014?
PS: Wish Jennifer Marohasy a Happy Birthday today, and if you are on the Sunshine Coast, why not do it in person from 5pm at the Sunshine Beach Surf Club tonight! (Head for the beer garden).
9.4 out of 10 based on 175 ratings
|
JoNova A science presenter, writer, speaker & former TV host; author of The Skeptic's Handbook (over 200,000 copies distributed & available in 15 languages).

Jo appreciates your support to help her keep doing what she does. This blog is funded by donations. Thanks!


 Follow Jo's Tweets
 To report "lost" comments or defamatory and offensive remarks, email the moderators at: support.jonova AT proton.me
Statistics
The nerds have the numbers on precious metals investments on the ASX
|


Recent Comments