|
|
||||
|
Life on Earth is about to collapse but the government may have to keep their 2035 emissions target a secret until after our next election. Shucks… The government was supposed to release the “2035 update” by February next year. It was part of the sacred Paris Agreement that they pump up the NetZero promises every five years, which means by February 2025. But when The Australian newspaper asked if the government would keep that deadline, the spokeswoman pointedly did not say “Yes”.
Australia will, of course, be caught in the wake of the US Election with our election due by May next year. It will be impossible to run on climate piety if Trump wins (beyond the margin of cheating). And the rise of skeptical parties in Europe is surely spooking campaign managers. Suddenly climate activists don’t want climate on the agendaIn tandem, ‘o-so-conveniently, the chief climate propaganda unit simultaneously announced they might have to delay giving their “frank and fearless advice” until after the election too, proving they are not frank or fearless at all. They’re scared the voters will drive a pike through their climate balloon. They all know the public won’t vote for the Labor Party if they reveal their extortionate plans. The only way for the blob to get what they want is to hide it. They are just copying “the Team-Kamala Plan”. (Don’t mention the Climate.) In the US, Kamala is saying nothing about the climate, and the Greens fully endorse her silence. The only way to solve that paradox is to assume Kamala plans to deceive the voters, and the Green approve of the deceit. For the same reasons, The Climate Change Authority (CCA) (the Australian propaganda unit) also realize that if they lay out the path to Net Zero by 2050 before the election, the Prime Minister will be put on the spot, and forced to deny or admit the points on the list, and they don’t want that. He might have to agree to let Australians buy the car they want, eat whatever they like, and even install gas stoves. That won’t stop him doing those things after the election, but it will make it more embarrassing. It’s harder to win the subsequent election if the opposition can play an annoying reel of him saying “there will be no carbon tax under the government I lead” and that sort of thing. It’s so much better to lay low, then spring those horrible plans later, after a storm or a flood. Look at the vapid excuses the Climate Change Authority make for delaying the “advice”:
In other words, it is absolutely being dictated by domestic political timetables.
Never in history did they wait for “all the facts” before telling everyone what to do. The only voters who want NetZero targets are the billionaires who invest in unreliable powerThere are no school-girls screaming for climate action any more, just investors:
When they say “businesses need stability” they really mean “businesses need subsidies”. Climate plans will not be released, –Ruairi
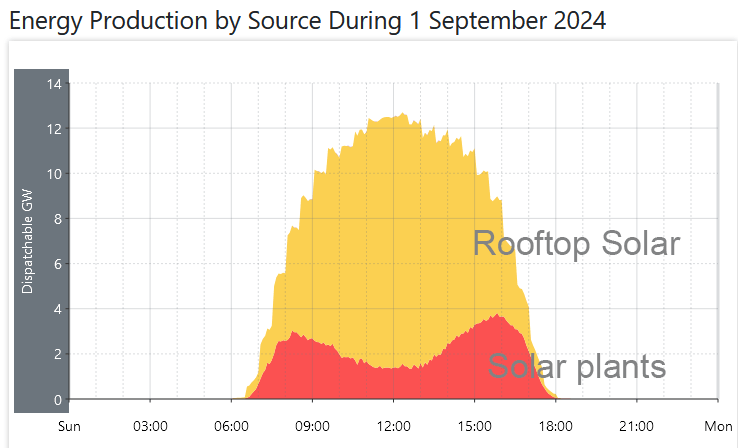
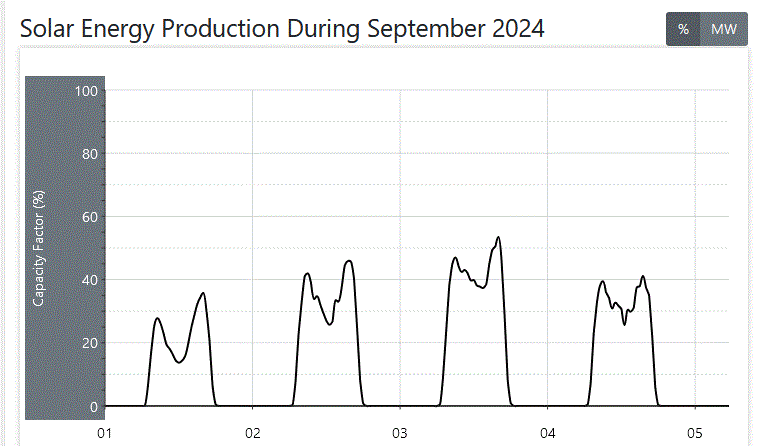
It’s just another day of profligate waste in Renewable WorldIt’s barely spring in Australia and already we’re reaching the point where there’s too much solar. There’s such an excess of useless energy, prices are negative, meaning the hapless generators have to pay people to take the poison power away. And on Sunday, at a time when investors ought be making their peak profit for the day, they were rushing to turn 80% of their panels off. Feel the pain — the stunted curve of the solar plants (below) is supposed to be the same shape as the rooftop PV. In reality, this is how we make the parabolic curve of orbital solar physics fit a rectangular box — by building five times as much as we need and wasting most of it. Bear in mind, this is just the start of a the lumpy road to nowhere. Even though we already have more solar panels than we can use, we’re supposed to be installing 22,000 more panels every day in Australia to reach our mystical NetZero target. Paul McArdle of WattClarity noticed the dire situation. As he says “rooftop PV is killing it’s big brother!” He has calculated the curtailment levels were often around 40 to 50% for large solar plants in the last week of August. Who would want to invest in a solar plant? And at the moment, there’s a bite out of the daily peak, every day. Call it “spillage”We’ve reached this surreal point because there is more wind power than usual and it’s spring. The weather is mild, so householders don’t need as much electricity — thus the minimum demand on the grid is falling dangerously low. That’s a problem because the giant coal plants and other reliable generators need to keep running, to supply the frequency stabilization and so they can ramp up to fill the gaps. Wild winds blow up solar farm profitsAngela Macdonald-Smith, Australian Financial Review [Josh Stabler, managing director at adviser Energy Edge] …said the available wind and solar resource almost exceeded total demand, but noted that renewable “spillage” – where renewable output is not made use of – was also at a record high. “Spillage and abundance will be continuous features of the electricity market into the future and will become more common, especially during spring,” Mr Stabler said. It’s mayhem on the market: The 24-hour average wholesale price was negative for Victoria, South Australia and Tasmania, according to National Electricity Market data, with NSW only just in positive territory at $16.81 a megawatt-hour for the 24 hours to 3am on Monday. That compares with the four-week average price in NSW of $206.23/MWh. So wholesale electricity prices are six times higher than they used to be, and we have an overdesigned grid with twice as much infrastructure as we need and most of the time, a lot of the capital assets are sitting around doing nothing. And people think if we just do more it will “be cheaper”. 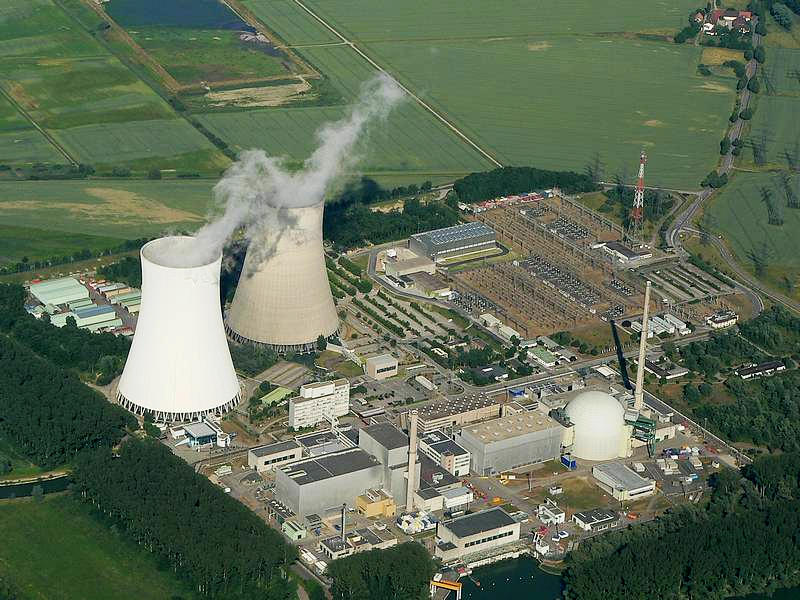 Phillippsburg Nuclear Power Plant by Lothar Neumann, Gernsbach
By Jo Nova If the Germans just did nothing at all, it would have been GreenerGermany already had nuclear power in 2002, if they just kept it and didn’t build all the wind and solar plants, they wouldn’t have had to spend 697 Billion Euro on subsidies, and would have cut their emissions by 73% more. If ever there is a statistic that says there is something rotten in the State of Climate Panic, this is surely it. I mean, does CO2 matter or doesn’t it? Do the Greens care at all, or even a bit? If there was a climate emergency and The Greens were worried about CO2, they might have protested that the EnergieWende was a reckless experiment. But if the Greens were tools for communists, foreign states or banker-investors, then they might keep choosing options that benefit other countries, help Bankers or just make Big Government bigger. Either the German Greens have utterly failed at the very task they set out to do, or they were really aiming at something else. Ross Pomery writes at RealClearScience and WattsUpWithThat Study Quantifies Germany’s Disastrous Switch Away From Nuclear PowerAt the dawn of the millennium, Germany launched an ambitious plan to transition to renewable energy. “Die Energiewende” initiated a massive expansion of solar and wind power, resulting in a commendable 25 percent reduction in carbon emissions by 2022… In 2002, nuclear power supplied about a fifth of Germany’s electricity. Twenty-one years later, it supplied none. A layperson might think that cheap wind and solar could simply fill the gap, but it isn’t so simple. Jan Emblemsvåg, a Professor of Civil Engineering at Norway’s NTNU just published a study comparing the ambitious German Energiewende renewable program with nuclear power: “what if Germany had spent their money on nuclear power and not followed their policy from 2002 through 2022 (20 years); would Germany have achieved more emission reductions and lower expenses?” Even German bureaucrats admit Energiewende “poses a threat to the German economy”: German Federal Accounting Office (Bundesrechnungshof) writes about the German policy dubbed ‘Die Energiewende’ in German, and it concludes: ‘The Bundesrechnungshof warns that the energy transition in its current form poses a threat to the German economy and overburdens the financial capacity of electricity-consuming companies and households’ (Bundesrechnungshof Citation2021a). A whole lot of wind (green) and solar (orange) power were added to the German grid and it was worse than useless:
Given these results, there can be no doubt whatsoever that if Germany had invested in NPPs [Nuclear Power Plants] instead of VREs [Variable Renewable Energy], Germany would have decarbonised more with far less nominal expenditures. The short conclusion is that Germany would have reached its climate goals with a substantial margin at half the expenditures of Energiewende. The Germans have done this experiment so we don’t have toJust burn that money in a pyre to the Weather Gods: These costs do not include the added burden of expensive electricity on businesses and homes, the opportunity costs of money that could have been spent elsewhere, or the loss of talent, brains and industry to other countries. Building new nuclear plants was still cheaper than wind and solarThe paper goes through another scenario where more nuclear plants were built with careful estimations of the costs and long times to construct plants and still concludes that the Germans would have saved $330 billion euro. Not coincidentally, in 2024 Germany has some of the most expensive electricity in Europe, business confidence is low, and VW have just announced that after 87 years in production, they might have to close their German factories. Volkswagen, which was founded in 1937, said on Monday that it could no longer rule out unprecedented plant closures in Germany as it seeks ways to save several billion euros. Chief executive Oliver Blume said: “The economic environment has become even tougher and new players are pushing into Europe. Germany as a business location is falling further behind in terms of competitiveness.” Volkswagen employs around 650,000 workers globally, almost 300,000 of whom are in Germany, and the threat of factory closures sparked an immediate fierce backlash … REFERENCEEmblemsvåg, J. (2024). What if Germany had invested in nuclear power? A comparison between the German energy policy the last 20 years and an alternative policy of investing in nuclear power. International Journal of Sustainable Energy, 43(1). https://doi.org/10.1080/14786451.2024.2355642
By Jo Nova The Modern West is regressing to 8th Century occult scienceToday the supposed “newspaper of record” for the most powerful nation on Earth is effectively telling people that the steak they eat, the car they drive and the heater they use could cause bridges to collapse “like Tinkertoys”. But you’ll have to join the dots yourself, because they never do. No one asks the experts: How many Tofu-burgers does it take to save Brooklyn Bridge? How many bus trips will we need to save the Golden Gate? The worlds leading journalists never ask the obvious questions. They just leave a trail of breadcrumbs: Man makes CO2, CO2 causes Spooky weather and Spooky weather eats bridges. So good people drive EV’s! Each breadcrumb looks like bread, like it might be real, but no one sees the whole loaf and before you know it, everyone is lost in the woods, installing solar panels to save their bridges. Two days ago the breadcrumbs said “good people go without air conditioners”.
Things are so bad the New York Times tells us that on a 95 degree day in summer, one bridge in Manhattan got stuck open “for hours”. (The tragedy). Another time a railway bridge in Iowa got washed away and some pavement buckled in Maine. The truth is that US bridges are a miracle. There are, seriously, more than 600,000 bridges across the country and yet this was all the catastrophe they could find in the leading paragraph. We’re supposed to believe that we’re in a bridge crisis, and that “extreme” heat, floods and “snap weather changes” are new, and worse, and we’re causing it. Be afraid:“…now, extreme heat and increased flooding linked to climate change are accelerating the disintegration of the nation’s bridges, engineers say, essentially causing them to age prematurely. The New York Times doesn’t mention the big numbers, but they do say that a quarter of the bridges in the US were built before 1960. So amazingly there are 150,000 bridges which are over 60 years old. The oldest is 327 years old. They’re trying to make out that old bridges weren’t built to cope with modern”climate change”. But who designs bridges that can’t handle warming of a half a degree? The last time anyone died in a bridge collapse in the US it was not climate change but because a ship ran into it. The time before that, the footbridge that collapsed was still under construction. People are not being killed by climate change, they’re being killed by incompetence. The Professor was paid to find a crisisAnd as I keep saying “we got what we paid for”: “We have a bridge crisis that is specifically tied to extreme weather events,” said Paul Chinowsky, a professor of civil engineering at the University of Colorado Boulder who researches the effects of climate change on infrastructure. “These are not things that would happen under normal climate circumstances. These are not things that we’ve ever seen at this rate.” So if Prof Chinowsky found that “climate change” had no effect at all he wouldn’t get much of a grant next year. His field is hardly likely to be starring in emergency sessions at the UN and he probably won’t get a paid ski-trip to meet Harry and Megan at Davos either. On a more mundane level the top students won’t be beating a path to his door. Even if he is a decent bloke and a breadwinner, all roads in Science World serve the government. The real problem in this story is that one sided government funding has killed science, and the journalists are conducting a seance with the ashes. h/t Bally By Jo Nova And then the climate pledges evaporatedThe Tech-Giants are backing away. Microsoft and Google have given up — they’re not bragging about their carbon neutrality anymore. Not now that their emissions have increased 29% and 50% respectively in the last four or five years. Over 500 companies pledged to get to net zero by 2040, but 96% of them are failing to stay on track. To distract us from talking about how the Climate Bubble has popped, some are blaming “AI”. The world is facing mass death and boiling oceans, and wind and solar are still as cheap as they never were, but Big Tech are sneaking away from saving the world, wait, because Artificial Intelligence uses a lot of electricity? It’s like, these CEOs were saviors of Mother Earth not long ago, but the ice-caps be damned, there’s a race on to capture the AI market? Apparently, the planetary heroes just turned back into robber barons doing business. Dr Jemma Green, who sells software for renewables markets, is trying to sell us a bad-luck story, as if it makes any sense. The truth is that if net zero technologies were cheap and useful, and the CEO’s ever cared about the planet, they wouldn’t be abandoning them. But they are… Why Big Corporations Are Quietly Abandoning Their Climate Commitments?Jemma Green, Forbes AI’s energy hunger and corporate climate hypocrisy …corporations like Google, Microsoft, and Shell once positioned themselves as leaders in sustainability, setting ambitious net-zero goals to align with global environmental efforts. However, the rapid rise of energy-hungry artificial intelligence is forcing these companies to reconsider—or even abandon—these commitments… Corporate climate pledges surged recently, with over 500 companies globally committing to net-zero emissions by 2040. This momentum continued between June 2022 and October 2023, with a 40% increase in new net-zero targets. Yet, as the AI revolution gains traction, cracks in these promises are beginning to show. Recent analysis reveals that only 4% of these companies are on track to meet their goals, highlighting a disconnect between corporate rhetoric and reality. Despite the headline, Jemma Green isn’t even trying to explain “Why” the end is here. After a few paragraphs blaming AI she laments how other giants like Shell, or Gucci, or EasyJet are stepping away too from their goals too, poking a hole in her thesis that it was only due to AI. It’s not like Gucci want to sell you AI programs to wear. What she’s documenting is the corporate world quietly erasing their mistakes: Shell, for instance, has abandoned its 2035 target of a 45% reduction in net carbon intensity, citing “uncertainty in the pace of change in the energy transition.” This target was a key milestone towards Shell’s broader goal of net-zero emissions by 2050. The same goes for luxury fashion house Gucci, which once committed to carbon neutrality through verified carbon offsets and in May 2023, quietly removed its claim of being “entirely carbon neutral” from its website. The truth is that if the Earth was in danger, smart CEO’s and billionaires, who have to live on the planet too, would be pushing nuclear power like their children’s lives depended on it. Instead it was all an intellectual fashion contest and a quick subsidy buck, and maybe a few even believed wind and solar power did something useful, but they don’t anymore.
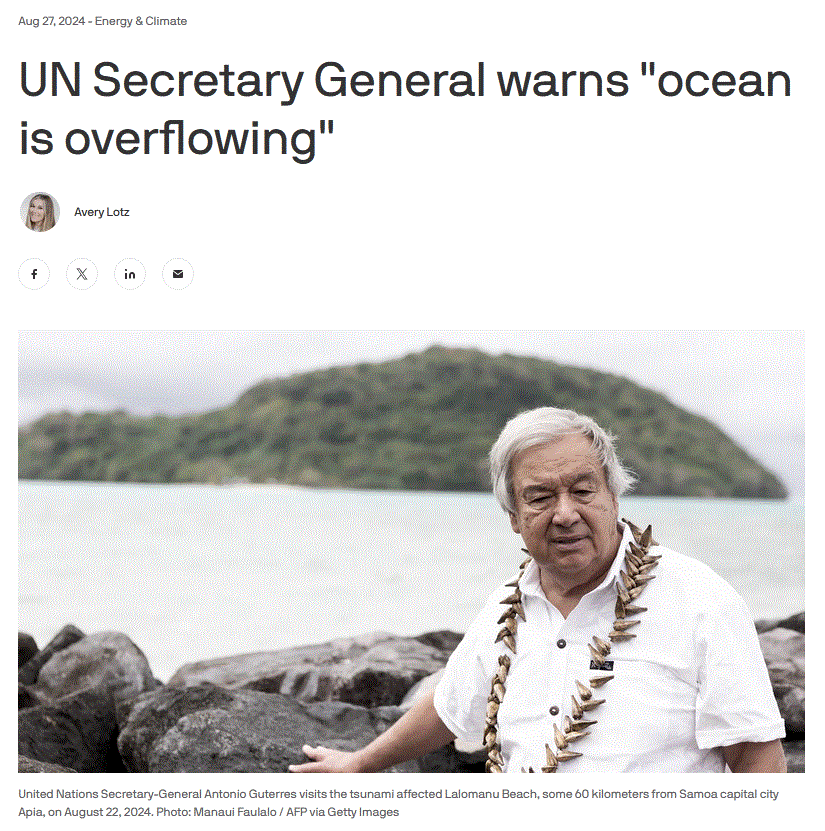
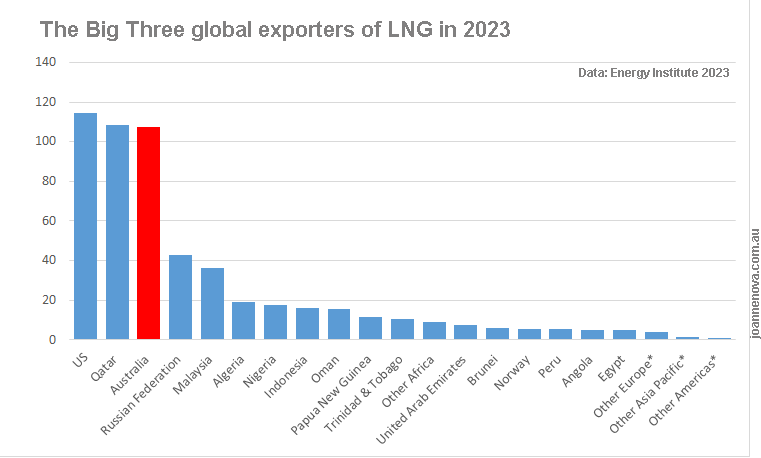
By Jo Nova And where was the ABC, the BBC, the CBC…This week UN was scaring the kiddies again in order to increase the river of funds that it feeds from. Harder to understand, science journalists were rushing to sell-out their homelands and repeat their incantations. We’re worrying about a 3mm annual rise (at most) but while Grok was inventing the wheel circa 5,000 BC, oceans were 2,000 millimeters higher. That surging water left clues like piles of giant oyster shells that are still 20 kilometers inland at Taiwan. In the frozen depths of the last ice age, the water piled up at the poles in the ice caps and the oceans shrank 125 unthinkable meters below where they are today. We’re getting precious about losing a sand dune, but Mesolithic people lost entire continental shelves. Only a poorly educated high schooler, or a UN Secretary-General, might be silly enough to think that the oceans had stayed the same for a million years and just jumped up 20 centimeters… Science communication is a train-wreck. When will the “journos” discover the Pleistocene. The prophesy reads like a new Bible: UN Secretary-General António Guterres warned Tuesday that rising sea levels will “soon swell to an almost unimaginable scale with no lifeboat to take us back to safety,” highlighting the dire threat the crisis poses to Pacific Island nations. The UN wants to be your God and they need your money: A coalition of NGOs used the forum’s backdrop on Tuesday to release a report claiming at least $US1 trillion in climate finance is needed to support low-income countries. While seas have risen in Tonga they have barely shifted in places like Kiribati, Fiji or Tuvalu. Does the money follow “the tide gauges”? Will the BBC or ABC ever ask Guterres a single hard question. According to 1000 tide gauges,spread all over the globe, sea levels are rising slowly at around 1mm a year. The rise started long before human CO2 output increased, and there is no sign of acceleration with rapidly increasing human emissions of CO2. Careful analysis of 60 beaches in Northern Europe to find one of the most stable gauges in the world agrees. The Topex/Poseidon satellite sea-level data set also showed similar rates until they were adjusted up to fit climate models (or one sinking gauge in Hong Kong). Likewise the Envisat sea-level satellite data was also adjusted up. Vincent Gray graphed sea level around many South Pacific Islands. There is no CO2 induced disaster. 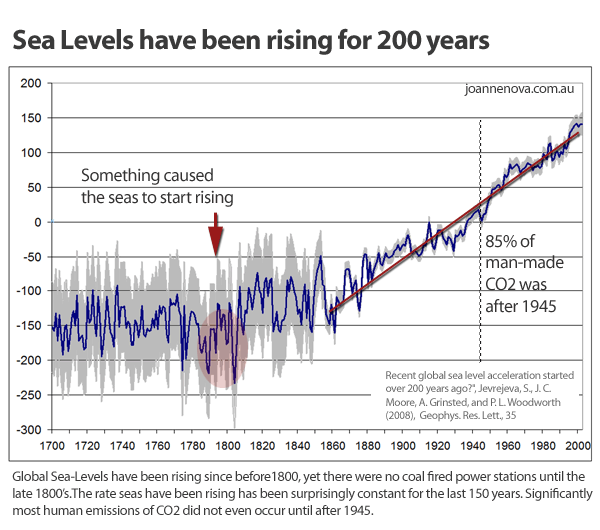 [Based on data from Jevrejura et al] Keep reading → By Jo Nova In Great Achievements of Government mismanagement, there is a $1 trillion dollar boom in LNG infrastructure around the world, and Australia is one of the top three exporters of LNG, far ahead of the rest, yet we’re about to run out of gas to keep the lights on. It’s so bad we probably have to import gas. As if anyone needed another example of how small-minded-dictocrat-decrees can screw up a free market and achieve the exact opposite to what they tried to arrange, feast your eyes on Australia. It takes real planning to start this far ahead and still bollix this up:Australia was literally the worlds largest LNG exporter in 2020 One of our large energy companies APA Group says a vital Queensland gas pipeline was already running at capacity this winter, and things are so bad, gas power stations here may have to run off diesel, which is stupid on many levels at once. Not only does it lose triple points in Climate-Scrabble, being a dirty high emissions fuel, it’s one of the only fossil fuels we aren’t swimming in. We have 300 years in proven reserves of coal and if we’re lucky, just 32 days of diesel. Gas shortfall imminent, APA modeling showsThe Australian Australian households could be hit with “cold showers” due to energy shortages, with the nation’s largest gas pipeline operator warning expensive gas will have to be imported into the country to fill the gap if pending projects are not approved. New modelling by APA Group shows Australia’s east coast is facing a prolonged period of gas shortfalls, with a vital Queensland pipeline running at capacity over this winter amid ongoing renewable droughts and production disruptions in Victoria. Officials this winter said the country’s fleet of gas power stations could be forced to run off diesel next year as traditional supplies run dry. APA Group was all set to start a major expansion of its gas pipeline in 2024 when one of the octopus arms of the government decided it might change the rules. The Australian Energy Regulator (AER) is suddenly saying it might shift from the current light regulation market to a full price management scheme, upon which all the investor-wallets at APA solidified with permafrost. The boss at APA, Adam Watson, said no one could figure out what the return on investment would be, so they suspended the expansion in May. For some reason, the Labor Party couldn’t see this coming. The Labor government aimed to reduce emissions, cut coal, and make electricity cheaper, instead as Watson says, we’re headed for a market that is less reliable, less affordable and has higher emissions. “Put another way – cold showers, higher energy bills and coal generating our electricity for longer.” Australia’s biggest gas deposits are 5,000 km (3,000 miles) from most of the people, and only connected by a small pipe or no pipe at all. The Bass Basin deposit is expected to run out around 2027 just when things get hairy on the electricity grid. 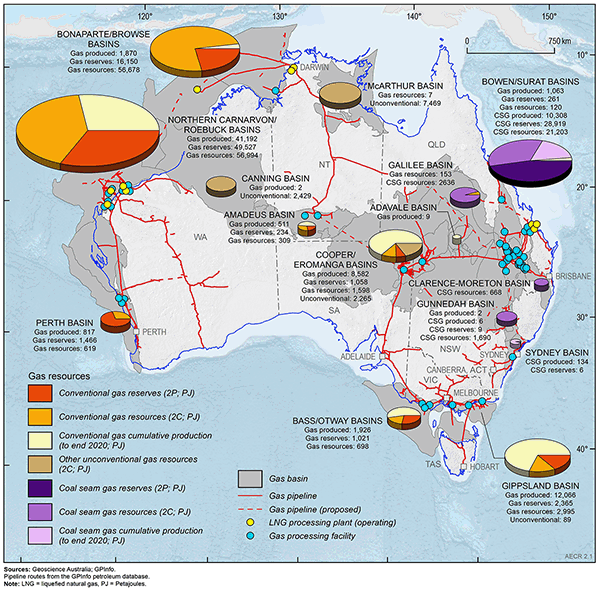 Click to enlarge. Geoscience Australia There is gas to spare underground, but Victoria banned Fracking “Forever” in 2017, and even put it in the State Constitution, just in case the stupid voters changed their minds. Though apparently this was largely a marketing ploy in Green fashion stakes, and legal eagles argued this was probably meaningless. Victoria did quietly allow some gas exploration a few years later, after they had scared all the investors off. Poetically, just a few months ago NSW banned offshore mining and exploration for gas and oil. Even though exploration is harmless, you never know what people might find. If the punters knew there was cheap gas nearby they might want to use it. Meanwhile Snowy Hydro has built a whole new peaking gas plant which was supposed to run on 30% Green Hydrogen (that was the only reason the Labor Government supported it). The gas pipeline is not finished yet either, so when it starts, for the first two months it will run on pure diesel. Another green win for Australia!
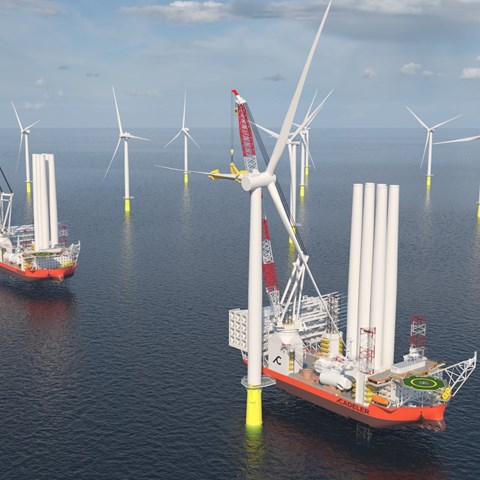
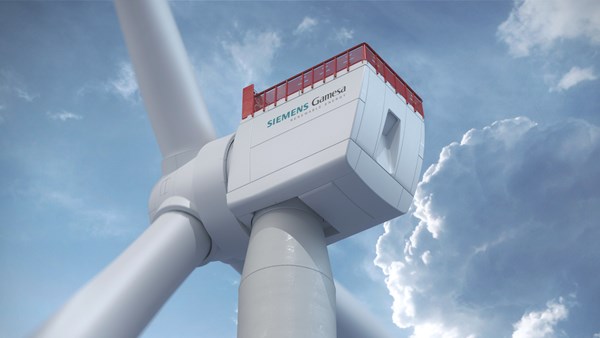
By Jo Nova John Constable puts some numbers on The terrifying scale of the green revolution in The Spectator this week. Ponder just the scale of the Sophia Offshore industrial wind plant being built off the UK. The wind is free, but to collect enough of it to power 2% of the country, the UK will have to build 100 wind turbines, some 200 kilometers out in the North Sea. Each blade is 108m long and weighs 65 tons, or about as much as a semi-trailer. When the wind blows hard enough, about 200 tons of matter will rotate above the ocean. The box holding all the spinning parts together weighs another 500 tons and needs to be suspended 140 meters up in the air over the waves and during storms.
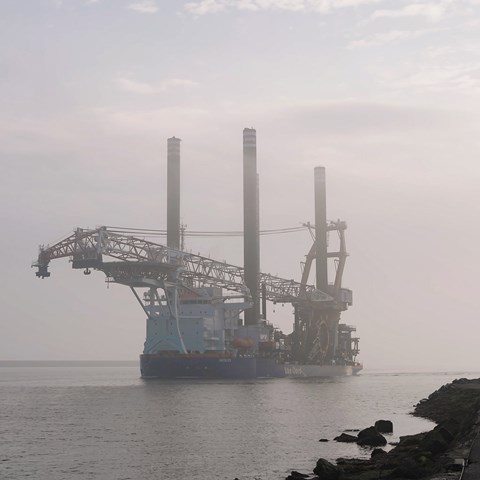
To make sure the whole thing doesn’t fall in the drink with the first stiff breeze, the turbines need to be weighed down with more than a thousand tons of concrete embedded in the sea floor. The blades will be “recyclable” they say, but who will clean all that concrete out of the wilderness 30 years from now I wonder? Let’s ask Greenpeace! All up, each windmill weighs around 3,000 tons, and the entire farm-that-grows-nothing will consume 300,000 tons of industrial material and cover 600 square kilometers. All this to make just a random 2% of the UK’s electricity, not necessarily when it’s needed, either, so even if the UK built 50 plants just like it, they’d still need to build an entire functioning generation network as back up. The Sophia plant will cost about £3 billion, and won’t last very long (compared to a normal power plant). But it will kill some whales and eagles, confuse Air Force and shipping radars and hypnotize some crabs. It may deafen a few porpoises too, not that they will complain. (Where are the Greens?) Two whole converter stations will also be built — one at sea and one onshore — to collect and convert the green electrons so they can be squeezed through the 200 kilometer long subsea cable. These decks (in yellow below) were made in Indonesia, where they still have affordable electricity. 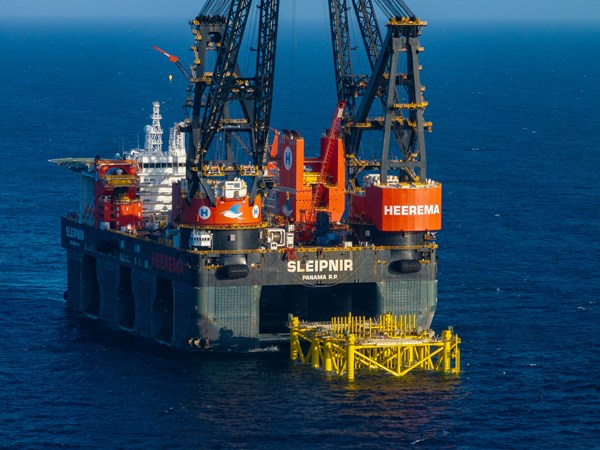 The Sleipnir semi-submersible crane vessel and installed jacket for the offshore converter platform ahead of the top side being installed. Sofia offshore wind farm, North Sea, August 12th 2024 If President Xi wanted to knock out the entire power station, by the way, he wouldn’t need to fire any missiles or send in a SWAT team. A Chinese cargo ship could just accidentally drag its anchor across the 200 kilometer cable somewhere. It’s been known to happen. As John Constable says, the 30 year old Sizewell B nuclear plant uses half a square kilometer and still makes 10TWh of reliable electricity. The Sophia wind plant uses 600 square kilometers to make 6 TWh of random power. The wind plant effectively afflicts 3,000 times as much of the surface of Earth as a nuclear plant does for the amount of energy made, yet the Greens cheer it on. What have they become… Read it all at The Spectator. hat tip Tonyb Photos from the Sophia gallery. |
||||
|
Copyright © 2025 JoNova - All Rights Reserved |
||||







Recent Comments