|
|
||||
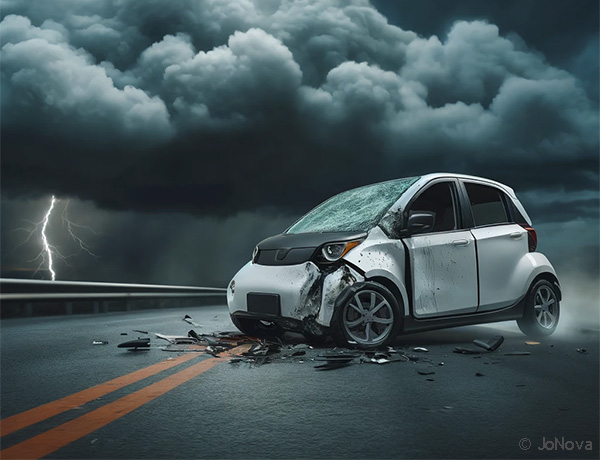
EV manufacturers are backing away slowly from the Great EV DebacleThe government commanded the EV bubble, but even with billions in subsidies, schemes and advertising the chemistry didn’t obey. Somehow, even with legislation, the right discoveries didn’t discover themselves on cue. VW has decided to use one third of its EV development money to develop a better fuel car instead. Hey, it’s only 60,000 million Euro. VW Will Spend Billions of Its EV Development Budget on Gas EnginesBy: Adrian Padeanu, Motor1.com Of the €180 billion ($196 billion) set aside in 2023 primarily for next-generation EVs, the German brand will now use one-third to continue the development of combustion engines. The announcement comes from Arno Antlitz, the Chief Financial Officer and Chief Operating Officer at the Volkswagen Group. The company intends to spend roughly €60 billion ($65 billion) to “keep our combustion cars competitive.” It’s a stark departure from the previous plan announced in late 2022 to build and sell only electric cars in Europe from 2033. Only a year ago Volkswagon was confident it could build a cheaper EV. But a month ago they reported a 20 percent fall in first quarter profits. Meanwhile Australia joins the EU with footage of “EV Graveyards” collecting at Port MelbourneAustralia remains far behind the rest of the developed world in EV sales but is obviously catching up on the latest trends quickly. Sales have fallen 44%:
And, apparently even those with money to waste don’t want to waste it on an “electric supercar”:Lamborghini Doesn’t Think Electric Supercars will Catch OnBy: Adrian Padeanu, Motor1.com Speaking with Automotive News Europe, Lamborghini’s head honcho Stephan Winkelmann argued electric supercars are “not something that is selling so far.” He went on to mention this genre might never catch on Supercars are for rich folk but Rimac CEO Mate Rimac recently admitted that high-end buyers don’t want electric supercars. It’s why the Nevera is still for sale, despite the hype around it and the limited production run of only 150 cars. The electric hypercar developed in Croatia set no fewer than 23 records last year, but it looks as though wealthy people weren’t impressed enough to sign their names on the dotted line. There is talk now of all kinds of variations of sustainable fuel to run combustion engines on. The CEO of Bugatti has even floated the idea of selling their bespoke customers their very own fuel station as well, so they can generate and fill their sustainable cars at home. Possibly the brag-able-value of owning a sustainable biofuel car that “charges at home” using some wildly expensive combination of solar panels and batteries won’t seem so brag-worthy in a few years time. Who wants to look like the loser who got car advice from a teenage girl? By Jo Nova To solve the increase in global disasters just axe the UNDespite a galactic rise in Headlines of Doom, the world is a safer place than ever. The United Nations however is an absolute danger to our quality of life and our children’s mental health. They’ve shamelessly concocted the myth that disasters are increasing due to “climate change”. NetZeroWatch report on a new paper on natural disasters and find that yearly deaths are down. Somehow satellites, phones, antibiotics, bulldozers and fire trucks are better at saving lives than horse drawn carts and hessian bags. Who would have guessed, apart from everyone?
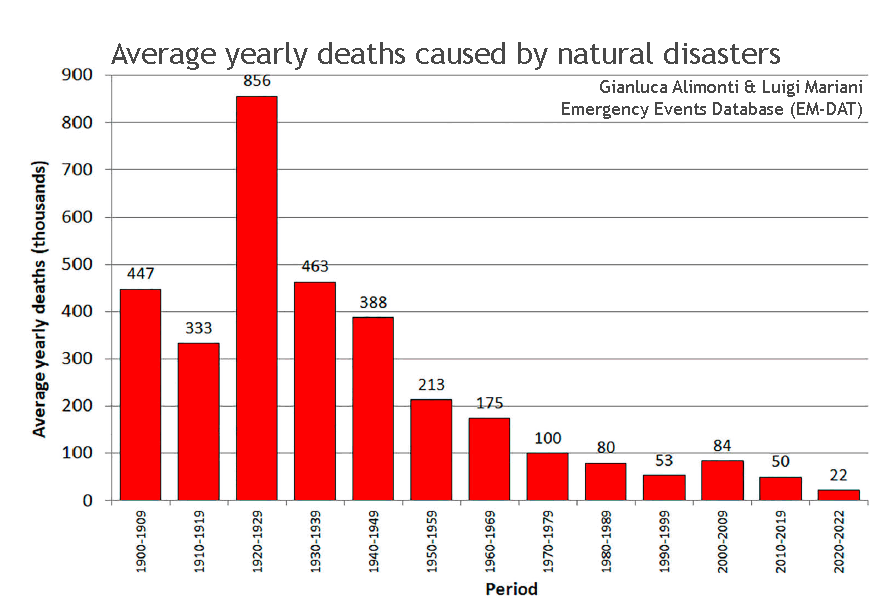
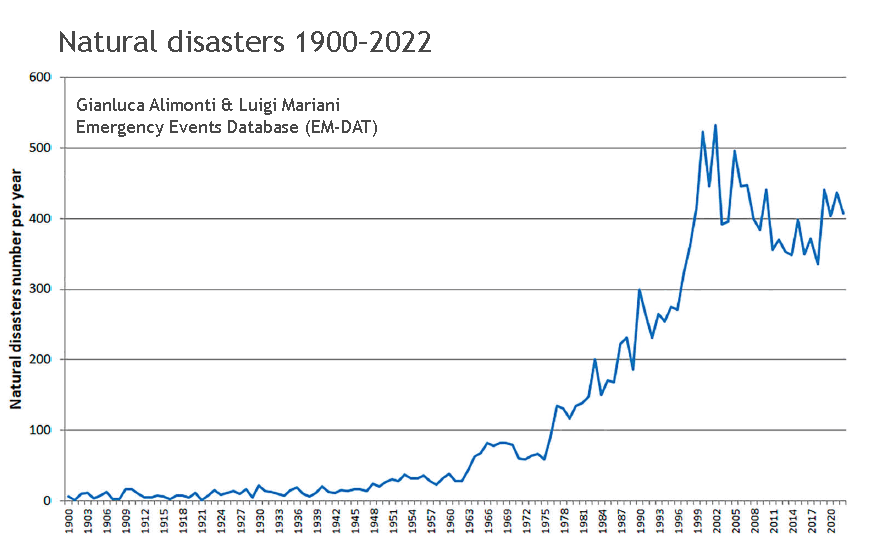
Below the graph of natural disaster events shows a huge increase in the reporting of disasters, at least up until the turn of the century. But there is, if anything, a decline since then. There are three very different trends. But the giant bureaucratic sponge that is the United Nations can shamelessly draw a straight linear trend through this graph and tell the world that disasters are getting worse, even as they are obviously not. In the last twenty years, humans have put out 40% of all the CO2 emissions they’ve ever put out since they lived in caves, but disasters have decreased 20%. It used to be that 20 year trends were enough to launch a new UN committee, but now the only trend-length that matters is the one that goes “up”. Another pair of analysts point out the CRED (Centre on the Epidemiology of Disasters) was only set up in 1973 and the EM-DAT database was only established in 1988. (Ritichie and Rosado). Even the CRED team itself has warned people about reading too much into these trends, yet practically every separate wing of the UN has done exactly that. The FAO said “disaster events have increased from 100 per year in the 1970s to around 400 events per year worldwide in the past 20 years.” The UN Chief said “natural disasters have quadrupled since 1970.” The the UNFCC took his misinformation and repeated it. A few years ago the WMO said “The number of disasters has increased by a factor of five over the 50-year period.” The BBC and The Economist lapped it up. Too many mistakes is never enough. In 2019, the UN Office for Disaster Risk Reduction (UNDRR) opined about the “‘staggering rise in climate-related disasters over the last twenty years’” proving only that lying UN agencies are a bigger threat to the science than the entire fossil fuel industry ever was.
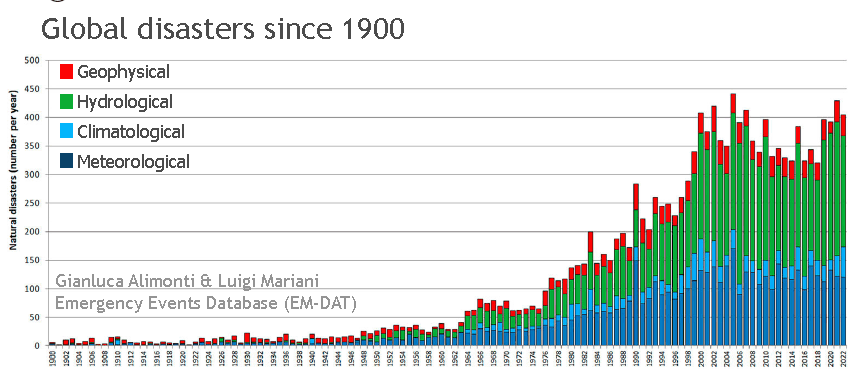
The rise in all of these disasters is mostly because people got better at reporting disasters. Back in 1901 if a cyclone landed in Ecuador, nobody rang up the UN, which didn’t exist, on phones that weren’t installed, to tell them about it. And when global population was five times smaller in 1900 tornados could wander the prairies and sometimes no one would notice. Droughts could strike rivers and unless the fish complained, who would know? Suspiciously geophysical disasters (like earthquakes and volcanoes) have also increased “since 1900” and at about the same rate and with the same “break point” in the trend. Obviously our gas guzzling cars are not causing earthquakes and beef-steak doesn’t set off volcanoes. So the rapid increase in these sorts of disasters in the 1970s and 1980s supports the theory that the rapid rise an artefact of data collection. There’s a lot more detail on that in the paper.
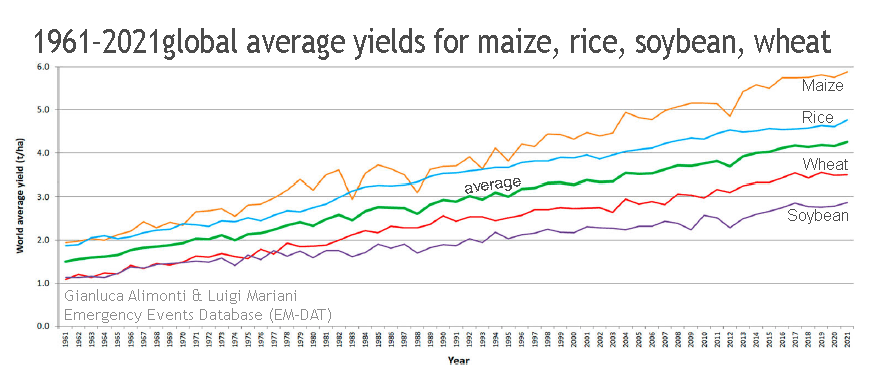
Meanwhile, the relentless good news on global crops continues. If there really were more storms and frosts and devastating floods, you’d think the rice paddies and cornfields of the world would have noticed. Yet here they go again, growing 2 to 4% more grain year after year.
Alimonti and Mariani don’t mince their words — the increase is just “better reporting”: We conclude that the patterns observed are largely attributable to progressively better reporting of natural disaster events, with the EM-DAT dataset now regarded as relatively complete since ∼2000. The above result sits in marked contradiction to earlier analyses by two UN bodies (FAO andUNDRR), which predicts an increasing number of natural disasters and impacts in concert with global warming. Our analyses strongly refute this assertion as well as extrapolations published by UNDRR based on this claim. The claim that the increase in disasters registered in EM-DAT in the final part of the twentieth century is mostly, if not completely, caused by better reporting and not by a real events increase, is supported by three independent lines of evidence: (a) several CRED reports (Guha-Sapir et al., 2004; Scheuren et al., 2008; CRED, 2015); (b) best fit analysis that found an important breakpoint and even a change in the trend sign of natural disasters at the beginning of the 21th century, in agreement with what is written and justified in point a; (c) the same trend change and breakpoint for geophysical disasters that have very little, if anything, to do with human activities or global warming. But it’s also “better blindness”. If the BBC, The Economist, and all the other sycophant agents of groupthink and power-mongers asked for “a graph” (with all the data) the facade would fall over in a week. REFERENCESGianluca Alimonti & Luigi Mariani (2024) Is the number of global natural disasters increasing?, Environmental Hazards, vol 23: No 2, 186-202, DOI: Emergency Events Database (EM-DAT) from the Center for Research on the Epidemiology of Disasters (CRED). Hannah Ritchie and Pablo Rosado (2024) – “Is the number of natural disasters increasing?” Published online at OurWorldInData.org. The GWPF helpfully provides a list of references, including their work refuting these claims:
June 7th, 2024 | Tags: Disasters, United Nations (UN) | Category: Global Warming |  Print This Post | | Print This Post | | Some weeks you need two Fridays. Sorry I got ahead of myself.
Stop Storms with Censorship!The UN Chief reminds us that we are babies who need an unelected tribal chieftain to protect us from seeing naughty persuasive words. Lord help us if grown up doctors, dentists, economists and people who keep planes-in-the-sky are accidentally exposed to The Word Of Exxon, or Shell, or BP. They might vote the wrong way, or buy the wrong car. They might influence their own children. (They might wonder why they pay money to The UN?) What looks acts and smells like a global government in waiting? The United Nations wants your money and control over what you read and see. They also want control over the voices of the industry they are proposing to destroy. The latest science decree from the Experts is that fossil fuel companies are the “Godfathers of climate chaos”. They’re probably sneaking around behind you like the mafia, dropping flood-bombs on your children’s school and raining on your Pride Parade. Fossil fuels are just like tobacco now — apart from how they harvest the fields and feed the children and fly us to Barbados for beachy weekends. (Marlboro only did that in the adverts…) The UN need an enemy to blame for everything, and the best kind of enemy is one that can’t speak: Ban fossil fuel ads to save climate, says UN chiefBBC “News” UN Secretary General António Guterres called coal, oil and gas corporations the “godfathers of climate chaos” who had distorted the truth and deceived the public for decades. Just as tobacco advertising was banned because of the threat to health, the same should now apply to fossil fuels, he said. His remarks were his most damning condemnation yet of the industries responsible for the bulk of global warming. They came as new studies showed the rate of warming is increasing and that global heat records have continued to tumble. Oh Woe, if only the UN could persuade the people not to buy oil, gas and coal to avoid the oceans boiling off to space. That would end the power of the fossil fuel giants right then and there. But after 30 years of trying, the UN, the bankers, and the sycophant cowards in academia all failed to convince the average driver to ride a bike or catch a bus. Let’s face it, they failed to even convince themselves to use Zoom instead of flying 100,000 planes to UN parties in Dubai or Azerbaijan. So the tar-and-feathering must continue: He said many in the oil, gas and coal industries had “shamelessly greenwashed” with lobbying, legal action and massive advertising campaigns. “I urge every country to ban advertising from fossil fuel companies,” he told an audience in New York. “And I urge news media and tech companies to stop taking fossil fuel advertising.” They must be afraid that one day the captive fossil fuels giants will wake up and fight back. Not that there is much sign of that yet: In response, representatives of fossil fuel groups said they were committed to reducing their emissions. “Our industry is focused on continuing to produce affordable, reliable energy while tackling the climate challenge, and any allegations to the contrary are false,” said Megan Bloomgren, Senior Vice President of Communications at the American Petroleum Foundation. Though the warning flares must be popping on the horizon. BP lost $1 billion trying to make wind power work, and changed policies from cutting oil to increasing it. Shareholders and investors like Bluebell Capital are openly knocking a few heads together on boards of sitting-duck gas and oil giants — explaining how their Net Zero targets are helping their competitors, and hurting their investors. Bluebell are buying the dips as it were –the dippy boards. They will reap (hopefully) the financial rewards of turning around suicidal companies. As a money making strategy, that might light a fire under some old fossils. The UN is a threat to democracy. Ban funds to the UN instead.
June 6th, 2024 | Tags: Fossil Fuel, Free Speech, United Nations (UN) | Category: Big-Government, Free Speech, Global Warming | Print This Post | | By Jo Nova It’s just another scientific study doomed to disappearA Norwegian whaler paid for 2,200 aerial photos of East Antarctica in 1937. Since then humankind has emitted 91% of all the emissions we’ve ever produced and the world is facing an extinction level catastrophe and yet satellite photos show this 2,000 kilometer long section of East Antarctica hasn’t changed — or at least, not in any way related to our uptake of coal power or planes, trains, airconditioners and cars. Basically the human race emitted 1,600 billion tons of carbon dioxide which was supposed to warm the poles twice as fast as anywhere else, but there is still nothing to see here. Belated Thanks to Tallbloke for the first article I saw on this. 2,000 km of Antarctic ice-covered coastline has been stable for 85 yearsUsing hundreds of old aerial photographs dating back to 1937, combined with modern computer technology, the researchers have tracked the evolution of glaciers in East Antarctica. The area covers approximately 2,000 kilometers of coastline and contains as much ice as the entire Greenland Ice Sheet. Compared to modern data, the ice flow speeds are unchanged. While some glaciers have thinned over shorter intermediate periods of 10–20 years, they have remained stable or grown slightly in the long term, indicating a system in balance. 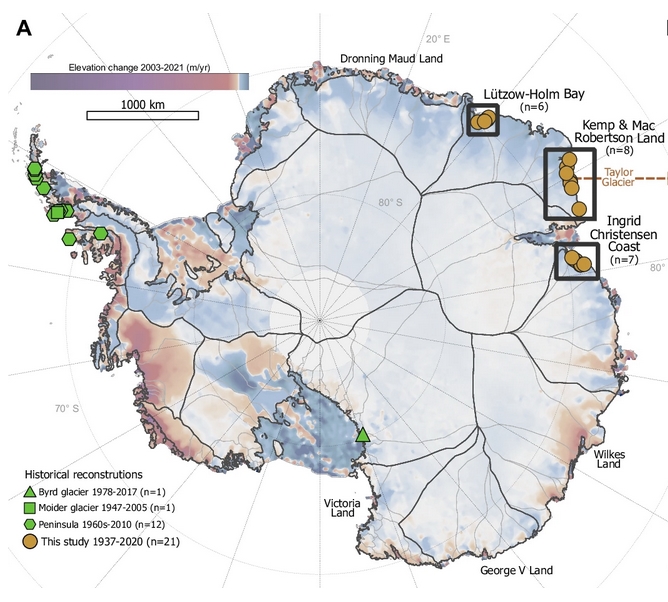 A Existing historical glacier reconstructions (Byrd11, Moider32 and Peninsula31) and glaciers included in this study (frontal reconstructions n = 21, elevation reconstructions n = 12, velocity reconstructions n = 4), overlaid on 2003–2021 Antarctic annual elevation change from Smith et al5., with MEaSUREs basin72
Imagine the fuss if these old photos showed a glacier melting? Most of the images used in the study were captured during a 1937 expedition organized and paid for by Norwegian whaler Lars Christensen. The mission aimed to produce the first maps of this part of East Antarctica, but the maps were never published due to the German invasion of Norway. Since then, the images have been stored at the Norwegian Polar Institute in Tromsø and forgotten. When the researchers from the University of Copenhagen read about the expedition, they realized that valuable images were likely hidden in an archive in Norway. They traveled to Tromsø and reviewed all 2,200 images taken during the expedition. They supplemented the Norwegian aerial images with images of the same glaciers from Australian surveys conducted between 1950 and 1974. 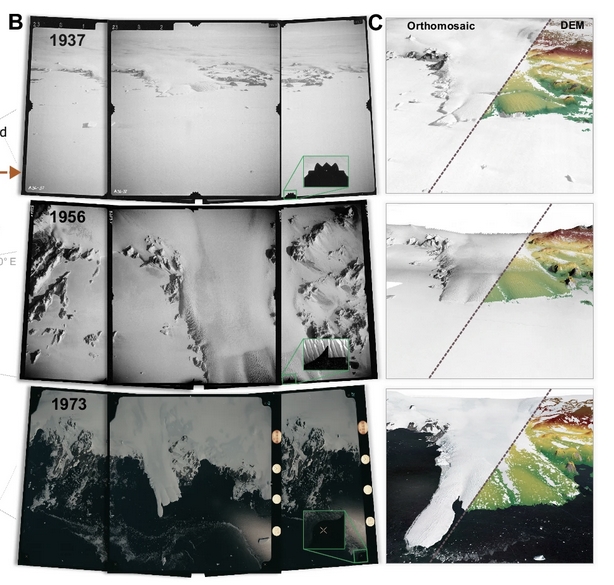 B Taylor glacier in 1937, 1956, and 1973 as captured in the aerial images. Close up shows the different types of fiducial marks used for standardizing the internal image geometry. C Produced digital elevation models (DEM) overlain on orthomosaics generated from interpolated DEMs. For the productions of the 1956 DEM and orthomosaic we included additional oblique images (not included here) as the glacier was photographed with a trimetrogon camera setup. During the last few decades, several sectors in Antarctica have transitioned from glacial mass balance equilibrium to mass loss. In order to determine if recent trends exceed the scale of natural variability, long-term observations are vital. Here we explore the earliest, large-scale, aerial image archive of Antarctica to provide a unique record of 21 outlet glaciers along the coastline of East Antarctica since the 1930s. In Lützow-Holm Bay, our results reveal constant ice surface elevations since the 1930s, and indications of a weakening of local land-fast sea-ice conditions. Along the coastline of Kemp and Mac Robertson, and Ingrid Christensen Coast, we observe a long-term moderate thickening of the glaciers since 1937 and 1960 with periodic thinning and decadal variability. In all regions, the long-term changes in ice thickness correspond with the trends in snowfall since 1940. Our results demonstrate that the stability and growth in ice elevations observed in terrestrial basins over the past few decades are part of a trend spanning at least a century, and highlight the importance of understanding long-term changes when interpreting current dynamics.
And for those who want to see the ebb and flow here are the detailed graphs of those 21 glaciers. Click to enlarge. It’s obvious that without long term data and climate models that work (which can predict precipitation) we have no chance of predicting glacier growth or loss, and nor should we infer long term prophesies from 20 or 30 year short cycles. Even 85 years of somewhat minimal data shows there is a lot of variation, and none of it apparently related in any obvious way to man made CO2 emissions. 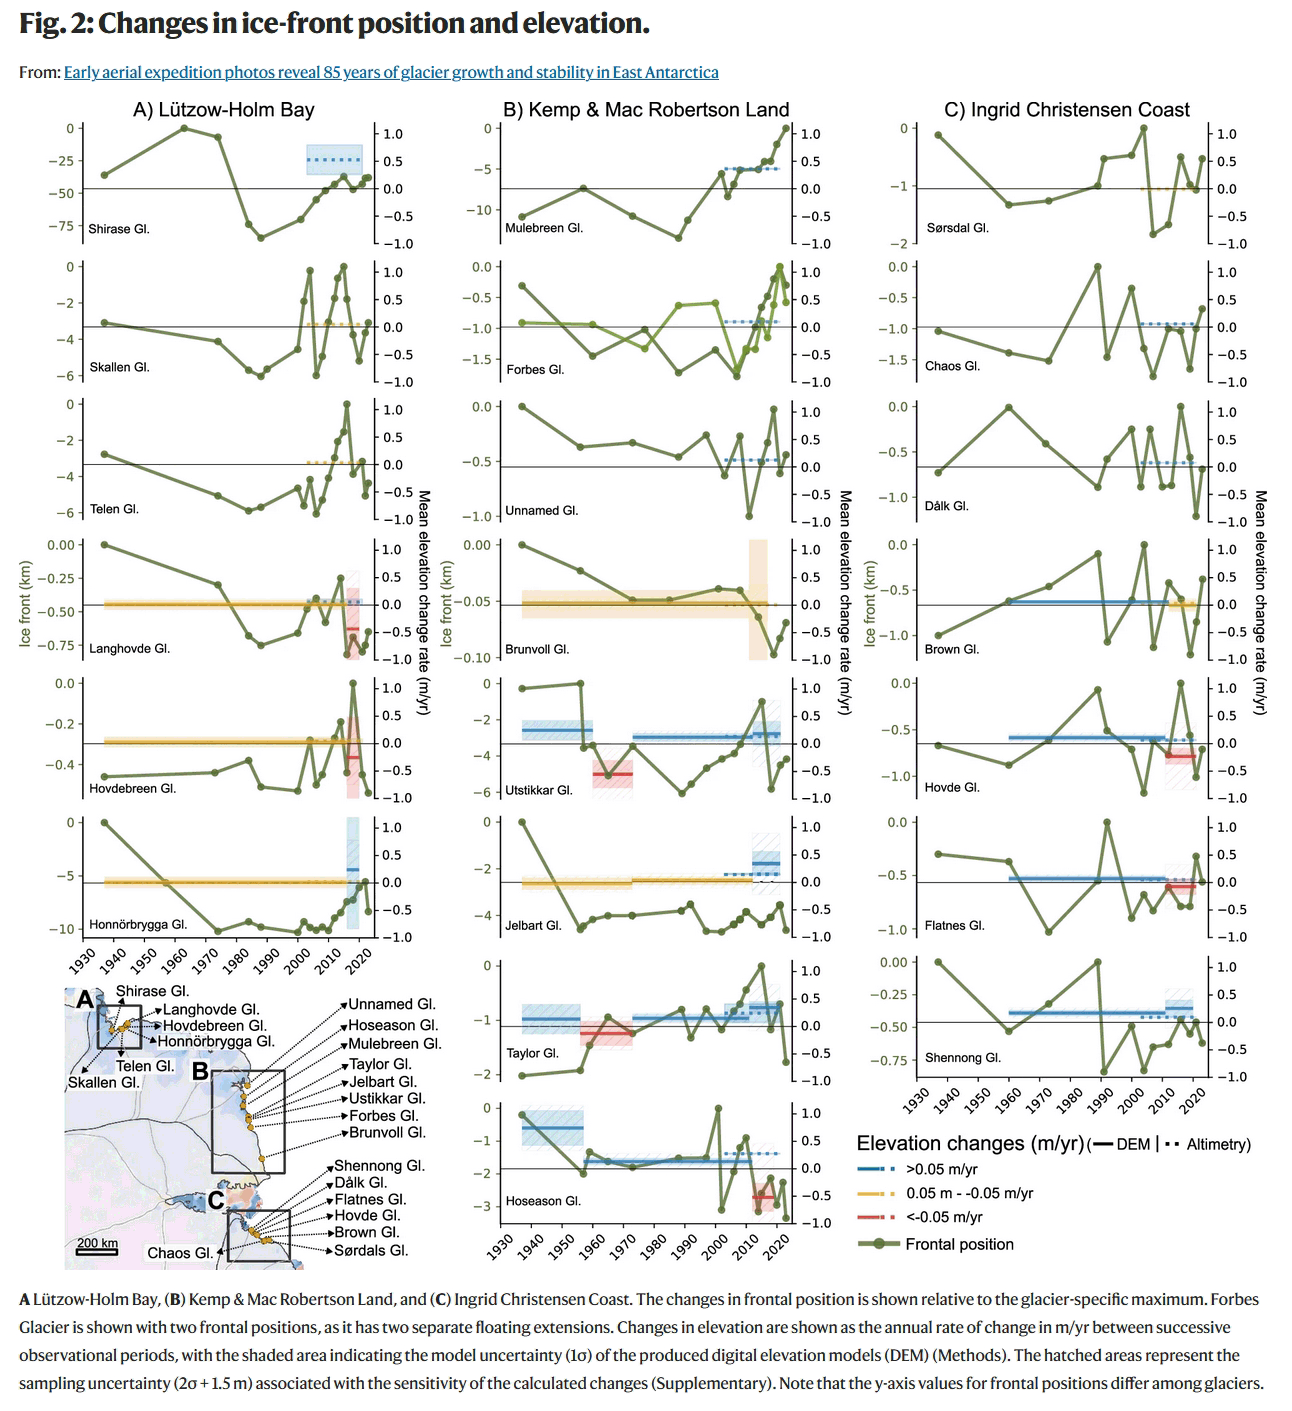 https://www.nature.com/articles/s41467-024-48886-x Thirty years of propaganda won’t die easily: REFERENCEMads Dømgaard et al, Early aerial expedition photos reveal 85 years of glacier growth and stability in East Antarctica, Nature Communications (2024). DOI: 10.1038/s41467-024-48886-x
By Jo NovaJust enjoy for the moment the small victory of what’s happening in democratic New Zealand. The Guardian is apoplectic, so we know it must be good: Rightwing NZ government accused of ‘war on nature’ as it takes axe to climate policiesThe Guardian The New Zealand government has been accused of waging a “war on nature” after it announced sweeping cuts to climate action projects, while making no significant new investments in environmental protection or climate crisis-related policy. But absent from the budget documents was any meaningful new spending on the climate crisis. Instead, dozens of climate-related initiatives, including programmes in the Emissions Reductions Plan and funding for data and evidence specialists were subject to sweeping cuts. Notice how the critics are all so vague. Their big fear, and worst threat, is some unfashionable place called “backwards”: The Labour opposition called the budget a “catastrophe” that was “taking us backwards”. For some reason the opposition did not say “Lord help us, The NZ government will warm the world!” Mostly because it sounds too stupid to lay the point of all these policies right out there. I mean, as if they can say that cancelling the Māori knowledge-based approaches to agricultural emissions will cause more floods in 2070? And in the end a warmer world isn’t exactly scary to New Zealanders like Ebola, poverty or an armed invasion. Be afraid, you’ll get more beach weather! The awful truth is that climate policies are just a fashion contest, so when they are taken away, the main downside is namecalling and a curse on your grandchildren. Like making witches angry or something? Green party co-leader Chlöe Swarbrick described the government as a “coalition of cowards” that was allowing the climate crisis to “rage on unchallenged” and whose attack on the climate would ripple through future generations. “The other day, government parties said, ‘drill, baby, drill,’ and today, they may as well have said, ‘burn, baby, burn’,” Swarbrick said… Getting to the nitty gritty, this all sounds good. The new right leaning coalition has found good savings in troughing bureaucracies and flag waving green clubs. Amazing how fast these things breed:
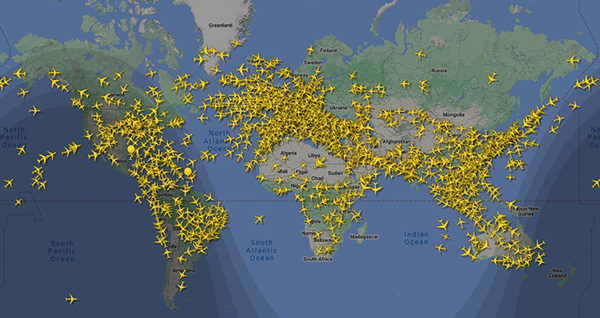
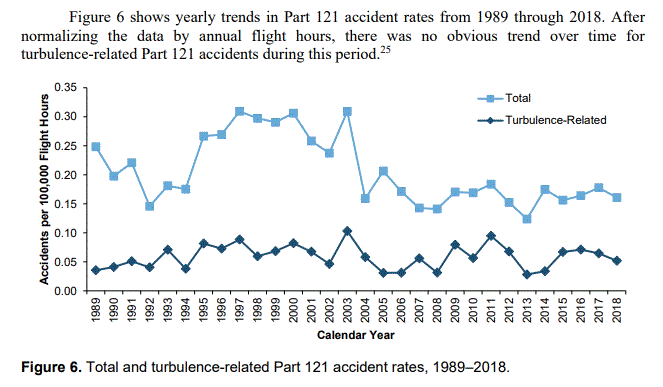
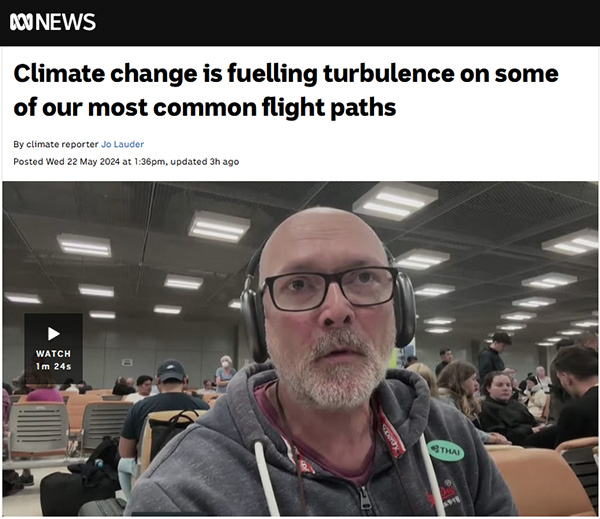
The new government will instead toss more funds at “climate resilience” and “disaster response”, which means adapting to the climate they already have. But there is so much further to go: $2.6 billion of climate initiatives will roll over from previous the Climate Emergency Response Fund (CERF) set up by the previous government. So there will still be money wasted on EV chargers, electric buses, emissions measurement schemes, and foreign aid to dictators. It will take years to unwind the climate grift. And when the Coalition are asked what they are doing for the climate, they point to the “climate resilience” funds instead of calling it pagan witchcraft and asking for hard observable evidence that CO2 causes any problem at all. Have those UN committees ever been audited? Let’s set up a team to do that. I mean, if we care about the environment and the third world, we need climate models that work, right? No more of these unverified guesses. Image by Ondřej Šponiar from Pixabay By Jo Nova The monster called “climate change turbulence” is an imaginary phantomAt any moment there are something like 10,000 boxes cruising in the air that know when they strike turbulence. Rumors are that these are even staffed with sentient beings. If Climate Change was making turbulence worse, you’d think pilots would have noticed? But instead of reporting what pilots said, which is that nothing has changed, almost all the media coverage about turbulence comes from models or cherry picked reanalysis of angels dancing at 197 hectopascals over the North Atlantic. The European Space Agency even puts sensors on planes. With 40 million flights per year, tracked by radar and monitored by satellite, and reported by pilots as well, if there were trends in clear air turbulence on passenger planes, there would be a mountain of data, and we’d hear all about it. Instead all they have are modeled guesstimates and slightly worse conditions over the North Atlantic. Pilots report that incidents of air turbulence are the same now as they always werePaul Homewood has found the US National Transportation Safety Board Report, and actual pilot reports (PIREP data). Basically, in thirty years of flights and after more than half of mankinds total fossil fueled emissions have been emitted, there’s no trend at all. To be fair, it could just be that we’re getting better at predicting turbulence so pilots are better at avoiding it. But if we’re going to headline newspapers with scary stories of flight turbulence (and if we actually care about people) the most important data might be the stuff that comes from planes. The Australian ABC blamed it all on the Ogre du Jour:
They found a Professor Furthermore, when the ABC says “our most common flight paths” (headlined above) they’re not talking about our Australian flights. Who is this “our”? It’s like there is no world outside the North Atlantic.  The change in ERA5’s 197 hPa annual-mean diagnostic-mean moderate-or-greater (MOG) clear-air turbulence (CAT) probability over 1979–2020, showing (a) the absolute change and (b) the relative change. The changes are diagnosed from the linear trend. Stippling indicates statistical significance at the p = 0.05 level, according to a two-sided Wald test (Fahrmeir et al., 2022) applied to the absolute change. | Prosser et al
The Prosser et al paper was deceptively headlined “Evidence for Large Increases in Clear-Air Turbulence Over the Past Four Decades” but it could as easily have said the opposite. They dismissed the pilot reports with barely one line: Pilot reports (PIREPs) have a longer record, but are not quantitative, and the geographical distribution of CAT based on PIREPs is limited in spatial and temporal extent (Wolff & Sharman, 2008). — Prosser et al 2023 Supposedly the point of the Prosser paper was to help aircraft and passengers, but actual reports from pilots: “who cares?” The other paper quoted by the ABC was a 2017 study also from the University of Reading, and it was nothing but climate modeling and magical unverified, unvalidated, fiction: A 2017 study predicted that severe turbulence will become two to three times more common over the North Atlantic by 2050-2080 because of climate change. However, the same study predicted a smaller increase of 50 per cent for severe turbulence over Australia. Right there in the abstract, the 2017 paper admits its all games with calculators — no data neededIt’s pure fantasy extracted from models we know can’t predict cloud formation at all, or water vapor at the heights that planes fly at. Their universal predictions of increasing humidity in the upper troposphere are legendary failures. The missing hot spot was called “a fingerprint” of man-made climate change right up until 28 million weatherballoons showed it didn’t happen. Reading Uni has a lot to answer for. One of the most prominent scientists pushing predictions of turbulent doom is Paul Williams, who wrote the 2017 paper and at least two further ones. He predicted a 55% rise in air turbulence over the North Atlantic. But Rupa Subramanya in The Free Press, writes that extra data wiped out the trend: In 2017, he co-authored a study that received a lot of attention, because it predicted that a rise in atmospheric CO2 could double, or even triple, incidences of severe clear air turbulence. He also published a much-publicized paper in 2022 arguing that wind speed changes over the North Atlantic had increased in the last few decades—the basis for arguing that clear air turbulence will get worse. And in another widely reported paper, published in 2023, Williams predicted a 55 percent increase in clear air turbulence over the North Atlantic. But how solid is his link between clear air turbulence and climate change? Earlier this year, Williams co-authored a letter to the Quarterly Journal of the Royal Meteorological Society, which walked back the findings of his 2022 paper. If we include new data, the letter explained, the increase in wind speeds above the North Atlantic ceases to be “statistically significant.” Where were the headlines New data shows the professor was wrong? Climate models will be useful when they figure out convection, clouds, rain, humidity, storms…Professor Lane says most of the turbulence in the tropical regions comes from thunderstorms, which are intensely more intense I tell you. He lives by a kindergarten climate rule where “energy = catastrophe”, thus: “With a warmer atmosphere, the atmosphere can hold more water, which can lead to those most intense thunderstorms being more intense with climate change. As those thunderstorms become more intense, they can also generate more intense turbulence.” Except that the biggest-storms-of-all are not more intense. Since the Tropical Cyclone Accumulated Energy Index started in 1970 CO2 has risen from an ideal 325ppm to an apocalytic 425ppm and the global population has doubled. Fifty years of reckless “pollution” have been and gone and yet cyclones are still the same? Prof Lane doesn’t appear to realize the water vapor hasn’t made it to the upper troposphere and even if it had, “more energy” is not always a disaster. There’s not as much energy in Antarctica, but no one wants to live there, and we hear they still have storms. Details matter. The lower troposphere has gained water vapor from the ocean as the system warmed, but it hasn’t increased in the upper troposphere where the modelers desperately need it to rise (and where those planes fly). The extra water vapor means the amount of energy held in the air is larger, but does that mean convection has increased or become more stable? After all, it’s not the total energy that creates instability, it’s the difference between two regions that causes the chaos. REFERENCEProsser et al (2023) Evidence for Large Increases in Clear-Air Turbulence Over the Past Four Decades, 08 June 2023, https://doi.org/10.1029/2023GL103814 Williams, P.D. Increased light, moderate, and severe clear-air turbulence in response to climate change. Adv. Atmos. Sci. 34, 576–586 (2017). https://doi.org/10.1007/s00376-017-6268-2 May 31st, 2024 | Tags: Climate Models, Flight, Turbulence | Category: Global Warming | Print This Post | | The big sunspot cluster that created the auroras a few weeks ago is very likely just over the horizon on the sun, and it appears to have spat out a doozy of an X2.9 flare to announce its return. While we can’t see the sunspot cluster itself yet, astronomers estimate that it is the same angry AR3664 set that has been circling across the far side of the sun for the last two weeks. This hyperactive region launched the X class flares that produced auroras on May 10th that were so powerful they lit up the skies far from the poles in Florida and Queensland. The solar storm was big enough that it reached down and twiddled with compasses on the sea floor as far as 2.7 kilometers (1.7 miles) underwater. So we are left with the paradox that solar weather controls half the groundwater refill in China, shows up in patterns of lightning in Japan, and somehow correlates with jellyfish plagues on Earth, but can’t possibly cause climate change. Apparently, our air conditioners can contribute to a heatwave but the vast electro-magnetic dynamo 333,000 times heavier than Earth can not. We know this because a foreign committee in Geneva says so, and they have skill-less models to prove it. The global climate models agree that the effect of the solar-magnetic-wind and electric-field is exactly 0.0 degrees (per doubling of their NSF grants). Some very active sunspots may last for months and each full rotation of the sun takes 27 days, so it may do a few laps and we may get more bites at this cherry. Or, if the sun is particularly grumpy, it may get more bites at us. As the sun rotates we’ll see more of what is probably AR3664, though to confuse things, when it rolls over the horizon it will promptly get a new number-name. (It has and is now “AR13697”). It’s difficult to track what happens to every sunspot cluster as they travel across the far side of the sun, so all sunspots shifting into view are automatically given a new number. Though according to Daisy Dobrijevic at Space.com “scientists can track the sunspot’s progress across the sun’s far side by observing how it affects the sun’s vibrations or seismic echoes, using helioseismology data.” Sounds tricky. You’d think we’d have a camera on an asteroid on the far side recording the other half of sun, but we don’t. We spent $100 billion trying to blame a fertilizer for our storms, but a lot less than that trying to understand the sun. As it happens, some officials at NASA even think the May aurora show was “one of the strongest auroras in 500 years”. They argue that some 7 different coronal mass ejections traveling at 3 million miles per hour, piled up together on the way and arrived all at once. In the last 70 years the other two big events were in 1958 and 2003. The Carrington event was so big it was seen in the Caribbean. People who want to see an aurora may get lucky in the next two weeks if a flare is ejected in our directionFor those keen to see an aurora, look out for notices of a large X Class flares. Depending on how fast the ejections travel, the charged particles usually arrive here about two days later, but may come anytime from 15 hours to 4 or 5 days later. Once the particles hit the satellites at the Lagrange point the instruments give us about 15 to 45 minutes of warning. The Lagrange point is 1.5 million miles away from Earth towards the Sun in an area where gravitational and centripetal forces equal out, and it takes very little fuel for the satellites to maintain their position. It is the closest thing to a parking spot in space where our space-cars won’t roll away if we’re not looking. Check the Glendale App for information or sign up for email alerts from the Australian Space Weather Forecasting Centre for aurora or from SpaceWeatherLive. Some bright spark set up Aurorasaurus to track aurora related tweets. Apparently they correlate quite well with geomagnetic indices. If only people were tweeting 150 years ago. For the record: Solar flares are graded B, C, M and X class, with X being the largest and each grade putting out ten times more energy than the grade before. Within each grade there are nine log divisions (Eg. M1, M2 etc.) There is no upper limit on X class flares and the one in 2003 overloaded the instruments (which max out at X17). It was later estimated to be X45, which sounds like it could have eaten the earth. The flares in May were smaller, like X4.5 and X5.8 but conglomerate. X class flares can trigger planet wide radio blackouts and potentially widespread auroras. UPDATE: Auroras are a fickle tool for measuring solar activity as only the ones aligned the opposite way to Earths magnetic field will generate the color-show in the sky. “The degree of magnetic disturbance from a CME [coronal mass ejection] depends on the CME’s magnetic field and Earth’s. If the CME’s magnetic field is aligned with Earth’s, pointing from south to north the CME will pass on by with little effect. However, if the CME is aligned in the opposite direction it can cause Earth’s magnetic field to be reorganized, triggering large geomagnetic storms. “ — Space.com The direction of the solar wind interplanetary magnetic field is called the clock angle, and to see an aurora we need the “Bz” to be negative. Since the sun flips its own magnetic field with each cycle, perhaps one orientation is more likely to generate auroras than the other? Some Russians claim that “odd numbered” solar cycles are more exciting for aurora watchers (and this is an odd numbered cycle — number 25). It maybe no accident that the last big auroras were 21 years ago at the peak of the last solar maximum with the solar north pointed in the same direction as it is now. So get your fill now of auroras if you can. It may be 22 years between drinks, so to speak. UPDATE #2: Sorry — thinking about it, the sun flips magnetic poles at solar maxima (ie. soon) not at solar minima but we label the “cycles” from solar minima to minima. Hence each 11 year Schwabe cycle will be half North-South, then the sun will flip to South-North for the second half. So it doesn’t necessarily follow that odd or even solar cycles will be better or worse for auroras. There is probably a 22 year pattern for auroras but it will be split across Schwabe cycles. Thanks to Willie Soon.
|
Jo appreciates your support to help her keep doing what she does. This blog is funded by donations. Thanks!
   |
|||
|
Copyright © 2024 JoNova - All Rights Reserved |
||||


![2024 Accumulated Cyclone Energy [ACE]](https://joannenova.com.au/wp-content/global_major_freq-ace-index-2024m.gif)


Recent Comments