
Buy my weather changing machines before midnight and I’ll save you $38 Trillion dollars and throw in some rainy days (or sunny ones, whatever you need).
Trust me, Earth’s Chief Climate-economist said, while stacking climate models that don’t work on top of crystal balls that forecast the economy. Two failures squared and projected to infinity makes great headlines and a never ending grant.
Their climate models can’t predict the most influential global climate phenomenon on the planet even six months in advance, so 25 year predictions are “obviously” the way to go. (No one will know they were wrong). The El Niño-Southern Oscillation (ENSO) drives heatwaves and floods across the globe but no matter what supercomputer they use, not one of the 23 General Circulation Models of Climate can tell you whether 2025 will be La Nina or El Nino, let alone 2045. We’re in the chicken-entrail days of climate forecasting.
Not one of the UN experts can even name the key variables that drive the ENSO cycle. Is it the solar wind blasting us at a million miles an hour, is it the interplanetary magnetic field, ultraviolet cycles, or cosmic rays? Is it geothermal hot leaks in submarine trenches we haven’t mapped, undersea volcanoes we haven’t measured, or phytoplankton blooms we didn’t even know we needed to pay attention to until last year? Remember how the same geniuses blamed mankind for the horrid benzene and toluene in the vast Southern Ocean for years, only to discover the dang pollutants were made by industrial microbes in the ocean? Both those gases are aerosols that seed clouds far above the ocean, and those clouds are big enough to be mapped from space, but Climate Models go Brrr, and say “give me your money”.
Climate Change Will Cost Global Economy $38 Trillion Every Year Within 25 Years, Scientists Warn
Robert Hart, Forbes
Damages from climate change will set the global economy back an estimated $38 trillion a year by 2049, with a likely range of between $19 trillion and $59 trillion, warned a trio of researchers from Potsdam and Berlin in Germany in a peer reviewed study published in the journal Nature.
To obtain the figure, researchers analyzed data on how climate change impacted the economy in more than 1,600 regions around the world over the past 40 years, using this to build a model to project future damages compared to a baseline world economy where there are no damages from human-driven climate change.
Bragging about “40 years” and 1,600 regions like that means something, is just fawning over mindless big number climate-porn figures. The last 4 million years of “climate change” looks like an earthquake readout and it wasn’t caused by man-made CO2. There are cycles in here that last 40,000 years and cycles we don’t even know about. We have captured one thousandth of one cycle and we’re boasting about it?
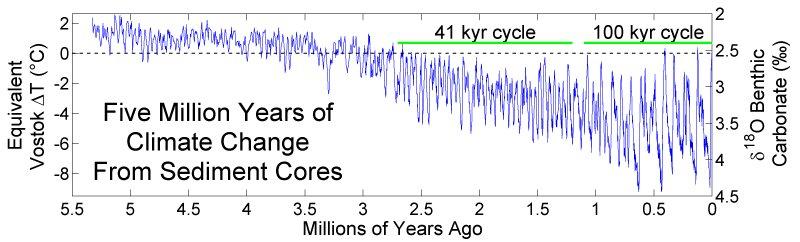
L. E. Lisiecki and M. E. Raymo (2005)
This paper in “Nature” the formerly esteemed journal, reads like a sales brochure in the press release. These scientists took lessons from the Mafia:
Study finds world economy already committed to income reduction of 19% due to climate change
Even if CO2 emissions were to be drastically cut down starting today, the world economy is already committed to an income reduction of 19% until 2050 due to climate change, a study published in Nature finds. These damages are six times larger than the mitigation costs needed to limit global warming to two degrees.
So based on their models that don’t work, and miss scores of variables, they estimate we should bet trillions, and redesign our entire national economy or our income will be smaller than it was probably, maybe going to be if we didn’t. Satisfaction guaranteed. Just ask us in 25 years and we’ll model how much money we saved you.
_____________________
Jo Nova’s tally of climate model failure continues: the hot spot is still missing, the climate models can’t predict the climate on a local, regional, or continental scale, they don’t know why global warming slowed for years, They can’t explain the pause, the cause or the long term historic climate movements either. Measurements of satellites, clouds, 3,000 ocean buoys, 6,000 boreholes, a thousand tide gauges, and 28 million weather balloons can’t find the warming that the models predict. In the oceans, the warming isn’t statistically significant, sea-levels started rising too early, aren’t rising fast enough, aren’t accelerating, nor are warming anywhere near as much as they predicted. Antarctica was supposed to be warming faster than almost anywhere but they were totally wrong. The vast Southern Ocean is cooling not warming. And the only part of Antarctica that’s warming sits on top of a volcano chain they prefer not to tell you about.
No wonder expert climate modelers don’t want their own pensions bet on climate models.
REFERENCE
Leonie Wenz, The economic commitment of climate change, Nature (2024). DOI: 10.1038/s41586-024-07219-0. www.nature.com/articles/s41586-024-07219-0
L. E. Lisiecki and M. E. Raymo (2005) — A Pliocene-Pleistocene stack of 57 globally distributed benthic δ18O records, Paleoceanography 20, 1003
Image created by Robert A. Rohde / Global Warming Art


The Official Narrative requires that the Scary Stories get progressively worse.
That’s doable because the Sheeple are simultaneously getting more dumbed-down and more indoctrinated. Day by day.
I wonder how long before the masses are required to attend a daily compulsory “two minutes of hate” as in Nineteen Eighty Four, except against “carbon” rather than the “enemy of the state” Goldstein?
Come to think of it, the Left already use Trump as their “enemy of the state”.
Perhaps they can have two minutes devoted to carbon and two for Trump?
https://youtu.be/XvGmOZ5T6_Y
Look at that video above. Is the wailing and ranting of the Proles any different to what you get at the typical Leftist rally/riot?
310
Re: “attend a daily compulsory two minutes of hate”. The kids already do that at school and university.
210
David. This was all settled long ago when it was first explained that the CSIRO has an in-house CSIRO Ski Club Inc, with lodges at Jindabyne and Perisher so’s the mostly-Canberra-based alarmists can get away in winter.
For decades the Club has prepared a yearly Financials Report for ASIC, in which the Committee and Office Holders declare the projected “outlook for club activities’. Each year they announce there are no adverse conditions foreseen which may / might have a detrimental effect on skiing, snow-boarding and shoeing etc. No CSIRO CLIMATE SCIENTIST disagrees. Not one complains that snow will disappear and that the climate is getting warmer, which will damage club activities. NOT ONE.
So, regardless of what they say in public about the HEAT….. in private (but under penalty if found lying) they say NO CLIMATE CHANGE approaching. That is all we need bear in mind!
171
Wow, I didn’t know that, WellInformed!
http://csiroskiclub.com.au/
Funny thing, being informed that I’d better see the Aussie snow fields because they were fast disappearing was the first I heard of global warming.
00
Using old and debunked assertions goes to prove what the Forbes article is saying
Eg frequency of coral bleaching worldwide has increased, temperatures are following the Mann model, etc etc
364
What Mann model?
Michael Mann produced a supposed temperature reconstruction to generate the infamous “hockey stick graph”.
He refuses to release the data or the computer code for public scrutiny, therefore it’s not science, it’s propaganda.
Also the hockey stick totally missed the Medieval Warm Period and the Little Ice Age.
If it was science, the data and code would be released into the public domain. That’s how (real) science works.
600
Dear Peter, one day when you start reading my blog instead of just reacting to headlines you’ll be in for a surprise.
There’s no downward trend in corals on the largest coral system in the world with the best measurements we have. Corals hit record highs in 2022/23.
Where is your disaster? It’s all in your head.
340
Why bother Jo, Simon is impervious to anything that is said here or elsewhere. It would be nice if he was a bit more engaged with such issues but it seems as though he is like a stuck record – spoon fed trash and regurgitated here. Simon gets a fail C minus from me.
170
I wasn’t involved in the conversation but here’s my contribution:
Pages2K reconstruction: https://www.nature.com/articles/ngeo1797
Marcott et. al. 2013: https://www.science.org/doi/10.1126/science.1228026
023
Eliminating the MWP won’t work, there is enough evidence to show that it was a universal phenomenon and warmer than our modern climate optimum.
Going further back there seems to be a disconnect between CO2 and temperature.
‘During the Last Interglacial, the proportion of CO2 in the atmosphere was about 280 parts per million.
‘The Last Interglacial was one of the warmest periods of the last 800,000 years, with temperatures comparable to and at times warmer (by up to on average 2 degrees Celsius) than the contemporary Holocene interglacial, with the maximum sea level being up to 6 to 9 metres higher than at present, with global ice volume likely also being smaller than the Holocene interglacial.’ (wiki)
100
The Marcott paper has been addressed 10 years ago which is why it doesn’t excite anyone today except the few warmist/alarmists who haven’t caught up to its demise.
00
The is Peter … the other mentally impervious one.
70
Oh, my mistake. Sorry Peter and Simon.
20
At the following link you can see the Mann hockey stick vs actual temperatures plus links.
https://thegreatclimatecon.com/graph-wars-unmasking-the-hockey-stick-deception/
260
Jo should submit this evidence for review, that should settle it ?
10
Mann’s model has been discredited on numerous occasions and the recent temp spike is a Hunga Tonga Hunga ring in.
https://www.drroyspencer.com/wp-content/uploads/UAH_LT_1979_thru_March_2024_v6_20x9.jpg
40
Strange then that everyone else is in the other camp https://www.newscientist.com/article/dn11646-climate-myths-the-hockey-stick-graph-has-been-proven-wrong/
here is a full list of the myths
019
120
‘It might even be hotter now than it has been for at least a million years.’
That should have raised a red flag, we are at the end of the Holocene Interglacial and I can say without fear of contradiction that our planet was hotter 6000 years ago.
New Scientist is rubbish on this issue.
90
Mann used two proxies. After the tree data showed a decline in temps from 1960, he just added the temp data. Hence the expressions, ‘Hiding the decline’ and ‘ Mike’s nature trick’. Briffa was advised to do the same when his data didn’t work out tp plan.
30
Peter, it has been exposed as data fraud because the Bristlecone Tree Ring data isn’t temperature data it was about CO2 fertilization effect on the trees by the two scientists who generated the data.
LINK
10
seriously? The Mann model? How many tree ring samples of Bristle Cone Pine did he have to extract before he got the right “DATA”? I would bet in years to come, someone will identify the single tree that Mann based his hoax on and place a plaque there condemning the stupidity of late 20th century “Scientists”.
130
Seriously, read the paper! Link is in Jo’s post.
Adaption is going to be hideously expensive, significant costs are already baked into the current warming trend. Mitigation is going to be far more effective, ideally greenhouse gas emissions reduction should have started decades ago.
025
>”significant costs are already baked into the current warming trend”
Does the “current trend” end with humongous natural variation as espoused by Gavin Schmidt (see comment #5.3) ?
40
Hi Simon. There can be no mitigation if man’s contribution to the increase in carbon dioxide is negligible.
Abstract
Recent studies have provided evidence, based on analyses of instrumental measurements of the last seven decades, for a unidirectional, potentially causal link between temperature as the cause and carbon dioxide concentration ([CO2]) as the effect. In the most recent study, this finding was supported by analysing the carbon cycle and showing that the natural [CO2] changes due to temperature rise are far larger (by a factor > 3) than human emissions, while the latter are no larger than 4% of the total. Here, we provide additional support for these findings by examining the signatures of the stable carbon isotopes, 12 and 13. Examining isotopic data in four important observation sites, we show that the standard metric δ13C is consistent with an input isotopic signature that is stable over the entire period of observations (>40 years), i.e., not affected by increases in human CO2 emissions. In addition, proxy data covering the period after 1500 AD also show stable behaviour. These findings confirm the major role of the biosphere in the carbon cycle and a non-discernible signature of humans.”
https://www.mdpi.com/2413-4155/6/1/17
100
So in order to save the planet, it will cost us the earth.
20
There is no Climate Emergency ongoing it is all a delusion that climate cultists promote, here is the reason why there is nothing to worry about:
Where is the Climate Emergency?
LINK
00
Yawnnnnn…… Zzzzzz… Try a counterpoint instead it is more exciting that way.
00
“frequency of coral bleaching worldwide has increased, temperatures are following the Mann model, etc etc”
Yes, I agree, you really should stop using old and debunked assertions.
330
The Income reduction by 2050, spoken about here is more likely due to Government legislated “Climate Policies”, than reduced phytoplankton in the Eastern Pacific, CO2 levels in our atmosphere, or any of the other variables that the experts can identify.
210
And Union retirement investment funds!
70
“The El Niño-Southern Oscillation (ENSO) drives heatwaves and floods across the globe ”
Except the BOM took a punt on El Nino, ignored their super expensive super computer (Price is a state secret) and predicted the hottest and dryest summer in decades. A Flannery instant drought. The cost to the country of this bad advice must be in the billions. Only to find the whole country was drenched in one of the wettest summers in history. So much for computers and El Nino.
But these cycles, more largely the AMO/PDO are regular and predictable with a cycle of 60 years and the De Vries Solar cycle with 250 years and they have both just peaked together.
The Carl Otto Weiss analysis of Europe (No proxies) for the last 250 years is spot on and the Industrial Revolution was in Europe, not Antarctica. Just two of the biggest cycles match the European City temperatures at 12 inflexion points, which is amazing. And El Nino is buried in there within the AMO/PDO
What the BOM just proved to everyone is that even if you know about El Nino, you do not have enough information even for mid term weather. But Volcanoes are not predictable. Clearly there were trillions of tons of invisible water vapour in the air that no one knew about. Likely Honga Tonga in 2022
So why should we believe the BOM who cannot even get the short term weather prediction right? As for Al Gore and Tim Flanner, words fail. Neither are scientists.
I prefer Prof Weiss’ approach. Blind fit with all the cycles you know and the answer pops right out. I can also recommend his graph because he shows that 1870 was a valley between two peaks. It is only as hot today in Europe as it was in Europe 250 years ago.
240
I met a man in the street and we talked about the weather, in passing. He told me he was a climate scientist. No qualifications but it is at the point where everyone is a climate scientist.
In this new field, real qualifications in science seem to be an impediment to realising the truth of Climate Science. Certainly meteorologists are not Climate Scientists and not welcome in any discussions by Climate Scientists. Australia’s Climate Council/Commission has never had a meteorologist. The council has acquired one atmospheric physicist though, but these people need jobs. Like James Hanson. After all how employable is an expert on the climate of Venus? Lucky Al Gore found him. And Michael Mann discovered a career in old tree rings.
Then online I get regular aggressive criticism from one individual. I checked. He has a PhD in Computer Science of all things. I wonder what part is the science? In the US you can get a Science degree in business accounting. The world is awash with scientists.
Now it seems anyone and everyone is a climate scientist. And you can get a doctorate in anything. It used to be a very rare and difficult qualification. I went to my son’s graduation and RMIT graduated 200 PhDs that night. One was in the logistics of the transport in Australia of Halal meat.
The most aggressive Climate Scientists though are politicians who know how to fix it all. Shut the place down, retire and enjoy empty beach resorts in the tropics, playing golf and sailing on other people’s money.
320
Not only unqualified people claiming to be “scientists”.
We have semi-literate people like PM Albanese and anti-Energy Minister Chrissy Bowen acting as “engineers”, making major and hugely expensive economy-draining engineering decisions that no competent engineer would make.
* When I say competent engineer, I don’t count “qualified” engineers who go along with the scam because of money or wanting to keep their job. They are morally corrupt and therefore incompetent to make real engineering decisions.
370
I ignored three warnings against Climate Scientists buried in our culture.
I always found the story of King Cnut and the waves a very odd tale. Why did he have to show his own subjects that he could not control the tide? It turned out to be one of the most important but obscure lessons in politics and power over nature. Clearly he had a problem with Climate Scientists.
The other odd fable was the story of Chicken Little/Henny Penny, “the sky is falling”. I thought at the time it was ridiculous. I was wrong. People do believe the sky is falling if told in an hysterical way, as with Greta Thunberg. Greta may not suffer the fate of Joan of Arc, who as one child recalled was burned to a steak.
Then the medieval stories of buying indulgences, to prevent mass suffering and hell fire in the afterlife. This appalling rort motivated a very devout and tortured Martin Luther to abandon the UN of the day, the Vatican in Rome and seek his own understanding. The story of paying to avoid hell fire has reappeared. Pushed by the holy afterlife Climate Scientists partying in Rome.
340
Yes. Well said TdeF.
We sometimes wonder about the motivation for such stories. Then we see what the Left are doing today and we understand why they were written.
220
This is Chief Engineer Albanese explaining how we can charge our electric cars at night for free with solar panels
https://youtu.be/vyS9uqRLbB8
160
And how long is the night in Stockholm, Copenhagen, Talin, St. Petersberg, Glasgow, Edinburgh,.. in winter? 18 hours.
And then at 60 North the winter tilt of 23.25 makes their latitude effectively 83.25 degrees. That means the sun rises to a glorious 6.8 degrees. The sun rarely rises above the trees. Perpetual shadow. And the lights are on all day.
The maximum solar incident intensity on a blue day on the ground in winter is 0% at 9am, 11% at midday, 0% at 3pm. Now try charging your battery with solar! Peak solar intensity 11%. Average 5% for 3 hours. A 3kw Australian system would be charging at 150 watts for 6 hours. 1kwhr. Unless it was vertical.
About half a billion live above 50 North, above London. Some very important cities like Berlin at 52.5 North. In the Northern Hemisphere Solar power and stored solar is practically useless for a lot of people.
110
Maybe he should try the Spanish method of shining lights powered by coal fired power stations on to the panels at night.
10
In a place where you can get a degree in TDS (Trump Derangement Syndrome) anything is possible.
80
A degree? I thought it was a disease. Maybe both?
90
Summer was not wet over the whole country my friend . It has been extremely dry and hot in the south west of Australia. We would like to see some rain soon.
80
I think the prediction was the East and South East for the bulk of the farming especially in the Murray Darling basin. El Nino being a Pacific ocean phenomenon, but who knows? These are wild generalizations now presented as professional advice by the BOM and the government.
70
Sorry Farmerphil, that’s too sensible. You have to put on your climatologist’s hat so you can read this from the BoM:
(from its 1 March review of Australia’s ’23-24 summer)
Our national weather people might one day realise that averaging rainfall over the whole continent is a bit odd. Then one of their marketing experts will make it “accessible” by counting up the entire rainfall volume and put it in “relatable” units. In a few years we may delight in learning that Australians have shared 7.2 Sydney Harbours in rainfall over the previous summer. It’ll be a testament to our amazing BoM and our hard-bitten farmers will have tears in their eyes.
130
>”I prefer Prof Weiss’ approach. Blind fit with all the cycles you know and the answer pops right out.”
Natural cycles are anathema to CO2-centric climate science.
Although the latest aberration has them “confounded” (see below) to such an extent that they cannot ignore the overwhelming natural variation driving it. Even Gavin Schmidt has had a “humbling” experience:
Tenth consecutive monthly heat record alarms and confounds climate scientists
https://www.theguardian.com/global/2024/apr/09/tenth-consecutive-monthly-heat-record-alarms-confounds-climate-scientists
August? Four months away. Easy to track at Climate Reanalyzer:
Daily Surface Air Temperature – Tropics
https://climatereanalyzer.org/clim/t2_daily/?dm_id=tropics
Peak anomaly was 1.2 with a spike up to 1.3 currently 0.9. At same page World peak anomaly was 1.5 currently 1.0.
There’s nothing to suggest either World or Tropics will be anything other than “stabilized” by August once the effects of the natural drivers have passed through.
But I do appreciate the “humbling” of “confounded climate scientists”.
60
Entrails are more reliable.
50
So say the soothsayers…gypsy clairvoyants insist that tea leaves are more reliable for prognostication
20
But a load of tripe is common enough.
20
Do you understand the difference between weather and climate?
215
It used to be 30 years of weather that determined climate trends. That was until climate catastrophists moved the goalposts.
100
>”Do you understand the difference between weather and climate?”
I wouldn’t call it a difference given climate is the aggregate and averaging of weather over a nominal term i.e. one is derived from the other.
In other words, all the recent “warmest ever” records month after month, driven by a combination of natural variation factors as Schmidt itemizes above, becomes climate unless the outlier datapoints are removed by say 5 yr smoothing.
To do that we have to wait 2.5 years at least before the smoothing can done given the latest El Nino + Solar Cycle + Volcanic peak was just last month.
And a lot can happen to global weather over the next 2.5 years absent the above natural factors.
70
Can we see climate change with extreme anomalous weather?
A change is seasonal behaviour gets the average punter talking, the weather is not what it used to be.
30
Not “the whole country.” The far eastern bits and much of the north. The western 40% has been very dry and very hot. These are the bits you can’t see from the top of the Great Divide even, the bits those in the far east know nothing about.
00
So lets use the UN data to prove that Humans have FLOURISHED since 1950 and we’ll use the POOREST continent as the best example.
In 1950 Africa’s population was 227 million and today is 1494 million and their life expectancy in 1950 was just 36 years and today is 64 years.
This is the greatest FLOURISHING in Human history and yet these so called Scientists act like zombies and ignore the UN data and the REAL WORLD.
Are they really this stupid or is something else on their clueless agenda? You either understand these very simple sums or you act like ignorant fools and BELIEVE in your silly FANTASY World.
https://www.macrotrends.net/global-metrics/countries/AFR/africa/population
150
Africa also suffered the highest death rates from HIV AIDS in the world over the last 40 years.
https://ourworldindata.org/hiv-aids
30
Would there be any correlation with the roll out of HIV drugs? Asking for a friend.
40
I don’t know F C and probably best to search online if you have the time.
00
AGAIN Africa has suffered from Malaria for a very long time and in recent decades at least 90% of global malarial deaths have occurred in Africa.
https://ourworldindata.org/grapher/global-malaria-deaths-by-world-region
30
BTW I’ve thrown in the African HIV Aids deaths and deaths from Malaria to prove that they didn’t have an easy time at all and yet somehow they’ve recently recorded the greatest Human flourishing in history.
Of course our Human history is at least 300,000 years and for 99.9% of our history lives were brutal and short.
So how did the UK’s Industrial Revolution foster our Human flourishing so quickly since 1800? Obviously the answer is Energy like Coal then later Oil and Gas and all of our persistent R & D over the last 100 to 200 years.
140
>”Their climate models can’t predict the most influential global climate phenomenon on the planet even six months in advance”
That’s because they are not actually “models”.
The essence of science is replication but climate modeling groups cannot replicate their own output let alone all the other groups output. That is why climate scientists studiously avoid graphs of models vs absolute observations.
Meanwhile all observation reanalysis replicates and corroborates (due mostly to common GDAS data source).
After about a quarter century looking into man-made climate change theory (yes, still a theory) and delving into climate models in particular including code, among other facets e.g. AO interface radiation-matter interaction, I have only ever seen one climate paper published that displays a graph of models vs observations in absolute terms.
That was this paper:
Connecting Climate Model Projections of Global Temperature Change with the Real World
Ed Hawkins and Rowan Sutton (2016)
https://journals.ametsoc.org/configurable/content/journals$002fbams$002f97$002f6$002fbams-d-14-00154.1.xml?t:ac=journals%24002fbams%24002f97%24002f6%24002fbams-d-14-00154.1.xml
Fig. 1.
(top) Global-mean 2-m air temperature from CMIP5 historical simulations (gray, 1861–2005) and various reanalysis estimates [absolute terms]
https://journals.ametsoc.org/view/journals/bams/97/6/full-bams-d-14-00154.1-f1.jpg
The anomalies derived from the absolute data are also shown (bottom). Easy to see why climate science only ever wants the public to always see models vs obs anomalies but never models vs obs absolute except this one paper that slipped through (don’t bother looking at data source papers referenced – obs reanalysis only).
If anyone has seen another example(s) please link, I would be very interested. If you’ve never tried to search for one I suggest giving it a go at least once just to experience the (almost) complete memory holing of what would bring down the entire climate “model” super-computing edifice.
100
Richard,
“climate change theory (yes, still a theory)”
I would say that the science to date does not warrant man made climate change dogma being elevated to being theory. The present day dog’s breakfast of climate science barely makes it to the hypothesis level.
20
The Romans would read the entrails of farm animals before deciding if to go into a battle. Since the food for the soldiers would come from raiding nearby farms, it’s likely that they were just looking for parasites. Evidence of widespread infection, and they would let the enemy take the region and get a belly ache.
Very sciencey. You give climatologists too much credit.
80
Touche. Apologies to Entrail experts.
90
Who are the most stupid? The ones promoting the scare tactics or the ones who fall for them?
120
Like oceans will boil.
And that person is a senior UN Official?
140
“The oceans will begin to boil” was Hansen.
“The era of global boiling has arrived” was Guterres.
Hydrovents gush out superheated water up to 400°C but no “boiling” unless near surface:
Hydrothermal vents: survival at the ocean’s hot springs
https://www.nhm.ac.uk/discover/survival-at-hydrothermal-vents.html
The notion that downwelling infrared category C radiation (DLR spectrum, solar categories are IR-A/B spectrum) is an ocean heating agent is absurd. IR-C (Terrestrial) is measured by BSRN and SURFRAD networks. Darwin fluctuates around 400 W.m2 24/7 but no point trying to harness the apparent energy because it does no useful work via say PV panels i.e. apparent but not real as in electrical parlance. I’ve had a very enthusiastic climateer zealot (HS science teacher) concede to me with this argument – there’s no counter.
Solar IR-A/B effectively penetrates ocean surface 1m where most of the photonic energy (energy-per-photon units electron Volts eV) is transferred to the water producing heat i.e. the sun is the ocean heating agent.
Of that 400 W.m2 DLR at Darwin only about 7 (1.75%) is attributable to CO2, the bulk is water either vapour mostly or clouds. But it is the change in CO2 that has the climate scientists all fizzed up – not the static quantity e.g. Standard Atmosphere. Berkeley Labs found a change in DLR attributed to CO2 of 0.2 W.m2 2000-2010. That is completely negligible.
Worse, DLR (energy-per-photon units milli eV) only penetrates the ocean surface a maximum of 100 microns (bit more than the thickness of a human hair) and is most effective at only 10 microns. Also completely negligible on a wind swept choppy ocean surface or even a glassy doldrums surface.
Given about 93% of planetary energy rise has been oceanic (6% land lakes rivers ice, 1% atmosphere) the attribution of ocean heat is critical to man-made climate change theory which generates hundreds of ZetaJoules of excess energy that they have to sink in a very large heat sink somewhere. Space is accounted for so that only leaves the ocean so they claim it for their theory. But they (IPCC) have no physical evidence to support their claim. Their rationale implies “trapped” atmospheric energy is imputed to the ocean despite lack of observation and contrary to the Clausius statement of the Second Law of Thermodynamics.
Their attribution statement is speculation only – “the expected mechanism” is “air-sea fluxes” – that’s no proof.
[Yes I know of Minnett’s idiotic and unproven theory]
[Yes I can cite all supporting literature for above]
50
>”IR-C (Terrestrial) is measured by BSRN and SURFRAD networks. Darwin fluctuates around 400 W.m2 24/7″
This study uses ARM ACRF and TWP-ICE data:
The Diurnal Cycle of the Boundary Layer, Convection, Clouds, and Surface Radiation in a Coastal Monsoon Environment (Darwin, Australia)
May, Long, and Protat (2012)
https://www.researchgate.net/publication/255000675_The_Diurnal_Cycle_of_the_Boundary_Layer_Convection_Clouds_and_Surface_Radiation_in_a_Coastal_Monsoon_Environment_Darwin_Australia
Figure 5
Aggregate diurnal all-sky downwelling (solid) and upwelling (dashed) LW for the (top) active monsoon and (bottom) break periods of TWP-ICE at the Darwin (dark gray), Cape Don (light gray), and Pirlangimpi (black) sites.
https://www.researchgate.net/profile/P-May/publication/255000675/figure/fig1/AS:392802992181250@1470662939583/Aggregate-diurnal-all-sky-downwelling-solid-and-upwelling-dashed-LW-for-the-top.png
I said 400 W.m2 but 440 in this study.
For comparison solar (SW):
Figure 6
Darwin Solar Irradiance (SW)
https://www.researchgate.net/profile/P-May/publication/255000675/figure/fig3/AS:392802992181252@1470662939656/b-Similar-to-Fig-6a-but-for-net-SW.png
Big problem for climate science.
The Terrestrial irradiance is more or less constant at 440 W.m2 24/7 but Solar only goes from 0 W.m2 at 6am to 800 W.m2 peak at 12:30ish and back to 0 at 7pm.
Solar only goes above Terrestrial from 9:30am to 3:30pm.
And yet it is solar power that is harnessed – not terrestrial. Why not harness the constant 440 W.m2 downwelling terrestrial power?
Ans: Downwelling terrestrial radiation has no heating power. It is not a heating agent for any surface material – water, land, photovoltaic (PV) panels, whatever. There is not the requisite radiation-matter “tuning” for heating to occur.
And yet climate scientists are adamant that a tiny change (0.2 W.m2/decade) in downwelling terrestrial radiation (please ignore upwelling completely) is heating the surface of the earth in excess of solar heating.
This has to be the worst global exhibition of scientific and physics incompetence in the history of the planet given current technology and what should be accumulated knowledge.
50
>”And yet climate scientists are adamant that a tiny change (0.2 W.m2/decade) in downwelling terrestrial radiation”
This refers to the change in the CO2 component of DLR. Total DLR varies wildly all over the planet i.e. the minuscule CO2 component change is lost in the noise.
20
Ocean temperature records are a statistical joke:
1. Very little area coverage before 1960
2. A graduation through at least five different instruments/methods since the 1930s until present.
3. Myriad adjustments to ‘correct’ errors, including in the recent ARGO data.
https://agupubs.onlinelibrary.wiley.com/doi/full/10.1002/rog.20022
30
Boil a jug with water for two cups of tea, two and a half minutes. Boil a jug with six cups of water, six minutes.
Boil all the World’s oceans ….. umm!!!
Tony.
110
I think it is likely based on a ridiculous misunderstanding, a brain fade and really funny. I expect he regrets it now.
He did graduate in physics and electrical engineering half a century ago and speaks five languages, but a long time ago. It’s a really crazy thing to say, that the oceans are boiling. And he means it. But he grew up in a Centigrade metric world in Portugal.
My funny view is that the sensational reports were coming in of a record 100F in very shallow water in Florida. And he did what a lot of people do, speak without thinking. He had conclusive evidence from scientists. The oceans are boiling.
Farenheit, Shmarenheit would be his view. The water is boiling. Run.
And he dug deeper “The era of global warming has ended; the era of global boiling has arrived.” There’s no misinterpreting that.
But 100F/37.8C is mildly warm not boiling. Or human blood would be boiling at 37.
So no need to make that cup of tea. The President of the UN says you only have to swallow a teabag.
100
And as for energy, the world’s oceans are 3.8Km deep on average over 3/4 of the planet. As divers know, 10 metres is an atmosphere, one bar. So 380 atmospheres. Then water holds energy better, 4x better with higher specific heat capacity, so the oceans have 1600x the heat storage of the air. Plus the oceans can only cool down by evaporation. They do radiate but at much lower temperatures, say 12C not 50C above the desert or concrete. So the air can drop 70C in a day in the desert and the oceans cannot change.
There is another effect that air is turbulent as it expands massively on heating, creating all the weather as it races upwards. Hot air has the same uplift as say hydrogen. Which is why hot air balloons work. But as water hardly expands on heating, you can have heat trapped at depth and moving.
The Gulf stream for example transports heat from the Carribean to Norway, the fastest ocean current known at 9km/hr, 100km wide, 1km deep and hot water. This is centrifugal force, not heat driven convection. And these currents likely abound in the major oceans, like the Humboldt current. And of course they carry CO2 as well, which may be why heat and CO2 are linked when such currents surface. But who needs real science when you can just make it up?
The oceans are boiling? If the air went up 1C, fine. If that heat went into the oceans they would go up less than 0.001C (1/1600). So you can forget that sea expanding nonsense. It would take forever to heat the entire oceans 1C.
And finally most of the sun’s energy lands on the oceans, not land. And it stays there because there is no turbulence. The surface heats up and evaporates and heats the air above. The consequent evaporation, air heating gives us the weather. As in the Caribbean, the equatorial Pacific for monsoons, tropical storms.
It is a peculiar attitude which allows people to think the air controls the oceans and we control the air. I would categorize it as a combination of ignorance and megalomania. Especially in politicians.
130
Best analysis and diagrammatic presentation showing the effect of different wind speeds on upper ocean heat I’ve seen is Fig 10 from this seminal oceanographic paper:
The upper ocean heat balance in the western equatorial Pacific warm pool during September-December 1992
Meghan F. Cronin and Michael J. McPhaden (1997)
https://www.pmel.noaa.gov/pubs/outstand/cron1713/cron1713.shtml
Figure 10. Box diagrams of the heat balance (equations (2a) and (2b)) for (a) the pre-wind burst period from September 19 to October 17, 1992, (b) the wind burst period from October 18 to November 12, 1992, (c) the post-wind burst period from November 13 to December 7, 1992, and (d) the beginning of the December wind burst from December 8 to 17, 1992. The mean wind speed during each period is listed, and the mean layer depth is indicated in the boxes.
https://www.pmel.noaa.gov/pubs/outstand/cron1713/images/fig10a.gif
Qstorage is very sensitive to wind speed so a small change in wind speed results in either heat loss, zero change, or heat gain.
There’s a graph elsewhere of that loss/gain for different wind speeds and a technical term for the loss/gain depth but I can’t remember the paper and can’t find the graph.
30
Wow. That’s serious analysis and very surprisingly complex, almost too complex. I am amazed by the elaborate equations used with three dimensional vector differentiation and have to wonder how they were derived and validated or whether they are hypothetical. It does seem overly complex for the ocean surface in the wild. The attempt to reduce real world to smooth mathematical models at a micro level is challenging, but what else can you do? And I have to say the effect of wind in altering energy fluxes is surprising.
But the effect of the same high winds on CO2 equilibrium is perhaps even more significant. I have read other papers which say the rate of exchange of gases goes as the fourth power of wind speed. And some of the wind events in the Western Pacific in this paper are substantial. So I am not surprised that excess CO2 does not hang around long.
I would have expected CO2 levels to be all over the place. The maintenance of CO2 levels is quite amazing when you consider it is substantially the same 0.042% within 0.001% from pole to pole in such circumstances with highly variable wind. That needs more than trivial explanation.
And the significance of this is the amazing IPCC yarn that fossil fuel CO2 sticks around in the air for on average 80 years or ‘thousands of years’ (4th IPCC report). Every researcher in the field says about 10 years for it all to go in the water. And wind is an extraordinary accellerant for the process. I remember one visiting researcher who put it all down to the wind driven formation of droplets and the vast increase in water surface area which results. It made sense.
40
>”And I have to say the effect of wind in altering energy fluxes is surprising”
My intro wasn’t quite accurate, increased cloudiness was the major Q factor in the top panel I linked (Fig 10a/b and see section 4.2 text first paragraph):
Fig 10a/b
https://www.pmel.noaa.gov/pubs/outstand/cron1713/images/fig10a.gif
Qsw decreased from 212 to 155 W.m2. That’s due to cloudiness.
Wind speed was the factor for the increased depth of the surface layer (h) from 34m to 68m in Fig 10a/b. Sec 3.0 states “During periods of light wind, the daytime diurnal mixed layer depth can be within several meters of the surface”.
That change in depth (h) alters horizontal heat transport (Qadv) markedly. I don’t understand Qpen at the bottom.
CO2 nowhere in all this. They don’t bother, as in almost all other oceanographic papers, to separate out LWdown and LWup as in the IPCC surface energy budgets (eg this Trenberth example). They just factor net LW (Qlw). That’s an outgoing cooling flux (OLR) – not a surface warming flux as climate scientists would have everyone believe.
40
Again here the OWI Data charts the boom in population since the start of Britain’s Industrial Revolution and the first billion on Earth was recorded in 1800 and over 7 billion more people today in 2024.
Human lives in 1800 were brutal and short and life expectancy was under 30 years.
But by 1900 global life expectancy was 32 years.
In 1950 global life expectancy was 46 years.
And today global life expectancy is over 71 years for the 8.1 BILLION people on Earth.
https://ourworldindata.org/grapher/population
70
Though a large part of the historic “life expectancy” was the death of children before puberty and mothers in childbirth. There are records of our ancestors reaching the age attributable to grand parents reaching grandchildren.
The advent of sterile surgical procedures and wound dressings started an “upswing” of survival which the addition of antibiotics accelerated.
20
Agreed ozfred but the flourishing happened because of the use of Energy like coal etc and all of the wealth and health etc that we enjoy today because of all the R & D and all this has taken place since 1800.
10
One reason for this booming population is never mentioned. It’s not more births.
Life expectancy was under 30 years. In India when the British arrived, 24 years. And is now 70-80.
And that alone has tripled the world population!
So it’s not that there are so many more people, 8x. But more like 2x and 3x from longer life span not higher birth rate.
People live longer, especially India and China. But also the generation is changing from 16 years to 30 years except for Africa and South America
Everywhere else a lot of the growth is a failure to die young.
WHen you add all this up, it looks like the world population will reach 9 billion and then drop rapidly, especially in China and India, while Nigeria currently at 220 million might catch China as it falls.
40% of Chinese women do not want to get married and in their society, that means no children. And you can end the one child policy, but that will still be the norm. All this points to a rapidly ageing society and then a rapid fall.
20
And you have to wonder how anyone inherits homosexuality which surely must limit population growth. LGBIT etc. It is terminal. Another limitation is that gay people never have twins, limiting population growth.
30
There are three types of “Models”.
1. Those with slim build parading on the catwalk.
2. Those from associates of the UNIPCCC which are used as attention distractors while significantly Not modelling the relationship between atmospheric CO2 levels and world Temperature.
and
3. Highly scientific engineering and chemical process models based on intense and relevant process analysis.
It is significant that type 2 has been used by the proponents of CAGW, although they may also be interested in type 1 as well.
As mentioned previously, so called Climate Models fail to link the two main factors in any way.
They are therefore, Not Models.
70
“Modelling” in reference to anything to do with climate, unreliables or subsidy harvesting is one of the most over-used terms in the modern lexicon.
Actual scientific models require an examination of the phenomenon which seeks to be simulated and then building and testing the model to determine if it conforms to real world data.
If a model doesn’t conform to the observed data, then the model has to be modified until it does. Only at that point can the model be considered worthy and validated.
None of the IPCC models conform to observed data and are incapable of forecasting or even hindcasting and therefore are not validated and not even scientific.
The models used by the IPCC are useless, not validated and should not be used to make multi-trillion dollar decisions, or any decisions.
The IPCC “models are a misuse of science and no more than propaganda weapons designed to propagate a Western-civilisation-destroying agenda.
100
IIRC – “Verify and validate”
And be wary of “DFS’s” – (data free statements)
30
Hi David,
“If a model doesn’t conform to the observed data, then the model has to be modified until it does”
In some areas of science we can relate various factors accurately eg electric current, resistance and voltage applied.
In many engineering systems there may be many
secondary factors present which are constant and do not vary. These factors may be isolated in a general factor which is constant over the zone of interest.
The main factors can be then be used with some confidence.
Unfortunately the Klimate Modellers do not link CO2 levels with atmospheric temperature and further ignore important factors like solar input variations over several time periods. And so on.
20
A reminder;
100
Also, a “report” from ‘United in Science’ which has the world in dire straits indeed:
World heading into ‘uncharted territory of destruction’, says climate report
https://www.theguardian.com/environment/2022/sep/13/world-heading-into-uncharted-territory-of-destruction-says-climate-report
By my calcs the GFS anomaly has been above said 1.5C for much of this year (1.5 equates to a GFS anomaly of 1.77):
GFS 2mT Anomaly
http://karstenhaustein.com/climate
Anyone notice the ‘uncharted territory of destruction’ ?
20
We can sit back and relax in the Southern Hemisphere
In Earth’s present-day climate, the annually-averaged surface air temperature in the Northern Hemisphere (NH) is 1.5°C higher than in the Southern Hemisphere (SH). This interhemispheric temperature difference has been known for a long time, and scientists have pondered over its origin for centuries. Frequently suggested causes include differences in seasonal insolation, the larger area of tropical land in the NH, albedo differences between the Earth’s polar regions, and northward heat transport by the ocean circulation.
50
Oceanic modulation is far greater in the SH due to much greater ocean area (and therefore less land area) than NH.
Peak NH summer is about 5C warmer than SH summer, hence the “warmest ever” record at top of the NH peak (but SH bottom).
The averaging of NH and SH to give a Gl average is physically unrealistic – they are disparate datasets whether phase, amplitude, or absolute difference.
Easy to see here:
Daily Surface Air Temperature
https://climatereanalyzer.org/clim/t2_daily/?dm_id=world
Switch from World to Northern and Southern Hemispheres.
Also, for chuckles, note Arctic and Antarctic are stubbornly refusing to play warming ball lately despite that The Arctic has warmed nearly four times faster than the globe since 1979
30
>”(1.5 equates to a GFS anomaly of 1.77)”
Should be – “a GFS anomaly of [0.77]”
20
Climate Change to cost $38 gazillion dollars every ten minutes, right after I retire say all The Experts…..So we have to spend $38 gazillion dollars every ten minutes on CCP RUINABLES to save the planet $38 gazillion dollars every 10 minutes…..oh and we the DAVOS BILLIONAIRES, WEF, UN, IPCC members are all heavily invested in government subsidised CCP RUINABLES, so global boiling is REAL OK!…Please, believe in global boiling otherwise we BILLIONAIRES will lose everything.
60
Higher CO2 levels are improving crop yields and increasing “Greening of the Planet” and related transpiration
This is all beneficial for further economic development, espacially in developing countries.
Famine is now generally a thing of the past except in war zones.
70
Co2 Lover the OWI Data has good records of famines since 1860 and there has been a big drop in famines since 1960. Just when another 5 billion people were added to our planet. Population in 1960 just 3 billion and 8.1 billion today.
I can’t seem to copy these graphs easily but if you scroll down you can find many examples.
BTW there doesn’t seem to have been a famine in the Americas for well over 100 years.
https://ourworldindata.org/famines
00
OK. I have a science PhD, a non science bachelor degree and decades of research and interpreting complex information from multipe data sources to technical publications.
I have no idea what this post is about.
Maybe start with something simple and glaring. What are the green bars meant to represent in the graph? They seem to span millions of years on the x-axis and yet are labelled in thousands. There is no green line they correspond to and the x-scale makes differentiating any pattern on the time scale of 10’s of thousands of years impossible.
What has the mafia to do with anything? What sales figures?
Maybe this is full of secret codes for something else and MP can help me understand the hidden meanings.
116
Baseline is in millions of years. Green bars at top shows the millions of years periods when either a 41k or 100k cycle occurred. That’s how I read it GA.
60
Thanks. You could be right.
15
You’ve already commented on posts using this same graph here , and here. One of those was only a month ago. So will you be honest enough to admit you don’t read the posts?
And honest enough to admit you’ve put thousands of comments on a climate science blog for years and you had no idea Antarctic temperatures varied wildly by 4 – 6 degrees every 41,000 years for millions of years during the current ice age?
Perhaps you should read this post before you make any more comments so you can catch up on where we were 14 years ago.
180
A nice graph. No error bars. Green bars only. 🙂
00
GA,
Its code for ‘The world’s scientific community is corrupt and Jo knows everything despite being unable to get anything past review’
30
THanks old man. You’ve done better than me
26
Apparently it’s satire.
112
Surely you jest, I’ll put up the UAH again and make a prediction.
https://www.drroyspencer.com/wp-content/uploads/UAH_LT_1979_thru_March_2024_v6_20x9.jpg
Even natural variables like ENSO, taking temps up and down, has been overwhelmed by Hunga Tonga Hunga. As La Nina approaches temperatures should fall, however because of water vapour in the stratosphere temps will probably remain stubbornly high.
That’s right comrade, its the greenhouse effect.
50
Ross is correct.
Those who have more than a passing interest in long term climate cycles would be well aware that over the last million years or so of the most recent ice age (The Qauternary Glaciation, commencing about 2,5 million years ago, and still ongoing) there have been cyclical ‘interglacials’ of 10 about thousand years when the ice retreats to the poles, occurring at approximatley 100,000 year intervals.
In the earlier part of this glaciation, the warmer interglacial cycle occurred at about 41,000 year intervals.
We are currently about 11,000 years into the most recent interglacial.
This last point always makes me wonder whether extending it may be a very good idea.
30
So highly credentialled and yet you have never displayed any knowledge of science whatsoever.
50
Gee it sounds as if you are suffering from excessive education…….
00
Figleaf (GA) has a science PhD and a non-science bachelors degree? Really? So, no basic science qualification. Your science PhD must be a real doozy? You meet such people from time to time but it’s rare that they openly admit it.
00
incorrect
00
It is an amazing thing, GA, that you would argue so strongly in favour of the CO2/climate change dogma, without researching or knowing anything about longer term climate cycles.
Those poorly understood climate cycles raise huge question marks in anyone who understands anything about data sets and statistical significance.
00
I think that is an overestimate by about 5 gazillion. We should get at least three quotes for it.
40
And the impact of rising CO2 levels on global temperature is 3 fifthteen’s of Sweet F*** All
30
While climate change mitigation is expensive, non-sterilizing, and does not prevent transmission, it does reduce the likelihood of hospitalization and death from climate change.
70
It looks awfully like the cure will be way worse than the disease.(unless you live in China)
30
Headline should’ve been – Climate Models go Brrr, and say “give me your money, LOL
30
Interesting to check the Energy use per capita for different countries since 1965 and Iceland has surged ahead since about 2005. In fact the winner by a huge margin in KWHs.
I thought Aussies were supposed to be energy wasters but Canada and even USA were also much higher.
https://ourworldindata.org/grapher/per-capita-energy-use?tab=chart&country=IND~USA~CAN~CHN~FRA~GBR~AUS~NZL~OWID_AFR~OWID_EU27~GRL~ISL~NOR~DEU
20
Iceland is a very special case because the population is tiny and the huge geothermal electricity generation is used to smelt vast quantities of aluminum for the US market, especially replacing the entire US grid. The power transmission lines are aluminum. (not aluminium, it’s American). So the per capita domestic consumption figures are quite wrong.
20
And then for all those trillions of dollars, I just answered the following question..
Can you provide some examples of how human actions have negatively affected the environment in relation to global warming, climate change, and the greenhouse effect?
Yes, the terrible windmills and millions of acres of solar panels are all anti environmental. Not just the mining, the CO2 output, the deaths of so many birds and the impact on the oceans but the seizure of public parks and forced installation of millions of kilometers of distribution lines for installations which will only last 20 years at best. History will show the biggest environmental disaster of the late 20th and early 21 century will be the twin evils of windtowers and solar panels.
*I admit I did not actually answer the question about climate change. Just the first statement about the environment.
50
Spot on TdeF and this TOXIC mess will have to cleaned up one day and let’s hope that the Albo loony + BO Bowen + Labor + Greens etc are condemned and possibly jailed for a reasonable term.
They are the scum of the Earth.
40
Come on, Jo!
Don’t hold back.
Tell us what you REALLY think!
Or are the legal eagles warning that the new Government re-definition of “informed commentary” as criminally irresponsible “misinformation” might be a bit of aa “disincentive”?
The sociopaths are going for broke on many fronts, globally.
Who is the “anointed” messiah they eagerly await.
30
“Their climate models can’t predict the most influential global climate phenomenon on the planet”
Most influential?
La Ninas and El Ninos are not global and they do not last long enough to be called climate effects.
Climate is an average of at least 30 years of weather.
Over 30 years the El Nino an La Nina ENSO cycle is temperature neutral. No effect on long term warming or cooling.
It is easy to criticize climate models, which I call Climate Confuser Games, for poor predictions. But they are not intended for accurate predictions (The Russian INM model may be the one exception) The confuser games are programmed to scare people and support wild guess predictions of CAGW.
The average 1970s model would appear to be very accurate today if programmed with RCP 3.4 instead of RCP 8.5, And we looked at only the 70 year prediction rather than 400 years out. And the water vapor positive feedback was mild rather than strong. Those assumption changes would cut the warming rate in half, coming close to the actual warming rate since 1975. But that post-1975 warming rate was harmless and can not be used for climate scaremongering. So the IPCC only publicized the extreme model preictions .. even though they have been wrong since the 1970s.
It’s all politics
Global warming and CO2 enrichment are both good news based on the past 48 years of experience with both. There is no economic cost of warming — only food production benefits and milder winters.
Spending on Nut Zero, particularly the solar and wind ruinables, is a total waste of money.
But Nut Zero is not a real engineering project. It is a political power strategy. Explained in my recent essay:
https://honestclimatescience.blogspot.com/2024/04/nut-zero-is-political-p0wer-strategy.html
10
Why can NO meteorologist predict the weather beyond 24 hours? THIS is where the question needs to be asked.
1°) Understand the metamorphoses of our planet. Our satellite planet of the sun moves in an ellipse. She does not come any closer to the sun or move away from it than usual. So let’s forget the ‘solar effect’. The Earth is a ‘pressure cooker’ which degasses from time to time (El Niño/La Niña). But there’s more than just this gigantic gaping mouth off the coast of Peru in the Pacific. There are thousands (millions?) of hot springs on the ocean floors that warm the currents. Yes, but there are also underwater and sub-oceanic earthquakes. These make the weather variable.
These hot springs (“mini-volcanoes”) close or open depending on the location of these tremors. So: no one can predict whether a hot spring (or rather ‘some’) will open or close.
2°) ALL gases degassed from the incandescent ferric mass are immediately recycled into the atmosphere (without which life on Earth could never have taken place).
It is therefore the same for carbon dioxide which is continually absorbed by phytoplankton on the surface of water (sea, oceans, lakes, rivers or puddles). Phytoplankton recycles this gas into nano-carbon particles (coal) and produces 31% of the oxygen present on Earth.
3°) The level of the seas and oceans cannot rise or fall. For what ? Because a few billion years ago the ice melted near the poles. The Atlantic therefore passed to the other side forming the Pacific Ocean.
Nowadays (in recent decades) learned ‘alir boys’ have imagined that… “if the ice melted (at the poles) it would cause the level of the seas and oceans to rise”!! However, at home, when the ice is… it LOSE volume and cannot give more water than its volume! Wow !!
4°) The ‘Global Warming’ is a gigantic scam launched by Al Gore in Kyoto.
00
I see the problem here. It’s a simple typo. That’s “38 trillion per year within *2500* years,” not 25. You know, when the ice comes back.
10
[…] From JoNova […]
00