
This work is supported by the Energy Realists of Australia. See the site for more information on Casualties on the Road to Net Zero.
SA is the pioneer wind state and the first to experience the rapid increase in power prices that hastened the demise of the local car industry. They literally blew up the last of their coal-fired power stations although they still have gas which is just as well because during wind droughts they live on gas and coal power from Victoria.
RE enthusiasts laud SA as an RE powerhouse, the wonder of the world and the shape of things to come across Australia. That is true but not in the way that they mean. Look at the situation in SA in the recent week from August 12 to Wed 18.
The chart below shows the amount of wind power generated in South Australia hour by hour through August to date. The dotted line across the chart at 219MW is close to 10% of the installed capacity of 2,100MW and it marks the upper level of supply that I regard as a “wind drought”.
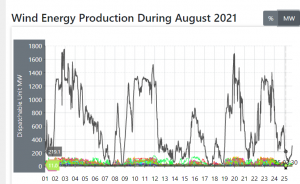
From the 12th to the 18th the supply was mostly under the line and consequently they were importing power every day of that week at breakfast and dinnertime. They were importing at lunchtime on weekdays as well during that period and this is unusual due to the amount of solar they have.
South Australia may be a net exporter over 12 months but that it practically beside the point because they depend on imports whenever they are in drought. When other states, led by Victoria, get rid of more coal power they will not have spare power during wind droughts to prop up SA.
That is just about the end of the RE story until there is feasible and affordable grid-scale storage because there is no way to deny the reality of wind droughts. They are clearly visible in the AEMO records and Tony from Oz has been monitoring the situation for years. It is about time for more people to pay attention. See here for the introduction to his comprehensive wind generation series.
Mike O’Ceirin has an interactive site based on those records and this link takes you to a list of periods when the whole of the NEM was in drought (under 10% of installed capacity) during 2020. On 18 occasions the duration of the drought was ten hours or more and in June the drought on the 5th and 6th lasted for 33 hours. Other droughts in June lasted for 18, 16, 14 and 9 hours.
For more instructions on wind watching check out the addendum to this post from the Energy Realists of Australia. But remember that wind watching can be time-consuming and habit forming so please watch responsibly. A Windwatchers Anonymous group has been established to support people who recognize a need for help with wind-watching dependence.
Pay attention to the low points instead of the high points!
RE boosters are excited by the high points of RE supply, but think about a flood protection levee or wall. You need to check the low parts where the water will penetrate and you you will not be impressed to see the high parts getting twice as high while there are still gaps in the wall. Windless nights are the gaps in the RE wall and there is no point in wasting more resources in RE capacity until the storage issue is resolved.
THURSDAY MORNING UPDATE – LOW WIND AT BREAKFAST TIME
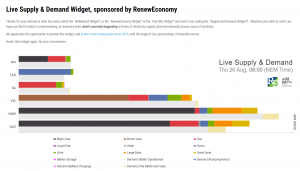
Access the widget in real time here. Western Australia is not connected to the eastern states that are all connected to form the NEM the National Energy Market.
Across the NEM at 8am the windmills are delivering 16% of capacity and 5% of the power in the grid. Queensland and Tasmania are the bookends of the system and the other three states are all in deficit. The lakes in Tasmania (the battery of the nation) are being drained so the ungrateful South Australians (croweaters) can have hot coffee on the way to work.
Urge your friends and relations to check this display at breakfast and dinnertime to see how much or how little green is visible on the bars to signal how much more wind capacity is required to dispense with the black, brown and red bits. Think about moving to Tasmania or getting a home generator!


I think it’s fair to say that the vast majority of people have no idea how unstable our grid would be without the fossil fueled generators. They will have to experience that reality to awaken them from their belief that unreliables are reliable and cheap.
240
Not to worry, the situation is under control.
‘Subsidise coal to keep electricity prices down.
‘Special payments will be needed to keep ageing coal-fired and gas power stations in business to avoid spikes in electricity prices, under a plan to shore up Australia’s energy grid.’ (Oz)
71
Up until a month ago I used to buy the Saturday Australian.
Now I don’t even get that.
40
Don’t worry, it’s coming.
20
Could you be more explicit? Force the banks to explain themselves.
‘The major banks will be called to a federal hearing into lending disputes over coal and gas projects in a new push by the Nationals to back the resources industry amid a debate with the Liberals over whether to set more ambitious targets on climate change.
‘Queensland Nationals MP George Christensen wants the banks and the nation’s competition regulator to appear before a parliamentary inquiry next week, extending the controversial review into the lead-up to a United Nations climate summit in November.’ (SMH)
20
Many years ago I did a quick exploratory calculation of the mass of material that was allocated to a kWh of electricity produced by regular coal fired generators and the new alternative Wind Power.
For the coal fired generators I totalled the foundation concrete and steel reo, then added the brickwork in the building walls then the massive steel and other metals in the rotating gens.
For the windmills it was the huge concrete base required to stabilise the ridiculously fragile tower, blades and gen/converter.
For each system I took the expected life, the mass of material in the unit and expected electricity that would eventually be available into account, and went to work.
The mass of material used to produce and deliver one kWh of rectified 240V 50 cycle electricity was calculated for both systems. Coal was added to the coal generation budget.
Guess what. Yes , the windmills used more material mass per kWh than coal fired power and thus created more CO2 per unit of electricity delivered.
Yes, it was a very rough calc, but gave a good indication of the real world situation as opposed to the romanticized renewables fantasy.
From every engineering perspective, the renewables idea is ridiculous but it was never set up to make electricity.
It’s main purpose is to make Money.
270
Yes, and it’s important to dynamite the most reliable means of producing electricity as the conquistadors burnt their ships so there’s no going back; an elite criminal group has Australia in a chokehold, one can only wish it ill.
240
I keep hearing the Johnny Cash song ‘burning ring of fire’ as the economy keeps on coarse to this money destructive terrible technology.
But that’s what our Monarchy wants as the Queen went all in on going ‘Green’.
50
Seems to be an amalgam of causality and casualty in your road zero link Rafe.
50
Thanks Serp:) Fixed.
30
This was the SA electricity production on 27th June
https://i.postimg.cc/3RYL0fZR/SA-Gas-27-June.jpg
Thank goodness for fossil fuels !
40
What needs to be kept in mind here is that South Australia only consumes 7.2% of all of Australia’s power, and only Tasmania consumes less. (6%) (and for some perspective on that, Sydney consumes SouthAus multiplied by three, and Melbourne and Brisbane EACH consume SouthAust multiplied by 2.5)(and my best guess is that those multipliers might even be on the low side)
Wind generation in SouthAus delivers 40% of ALL SouthAus GENERATED power. (Not Nameplate but actual delivered power)
The Nameplate for SouthAus Wind is 2142MW. Actual generated power is delivered at a Capacity Factor of 30%, so that’s an equivalent of 642MW, and that’s barely more than ONE Unit at a typical four Unit coal fired power plant, and Bayswater has Units of 660MW.
So wind power in South delivers 40% of 7.2% of the Australian total power consumption of 204TWH a year.
If they can’t run SouthAus on wind, how far do they have to scale it up for the three main States.
Naah! Wind CANNOT even get within cooee of replacing coal fired power.
Wind can deliver its average, and there might be days when it delivers high amounts, but what the hell do you do when it has days when there are hours on end at or close to zero, and you never know when it’s going to be high, and it never follows actual power consumption. It’s all over the place.
And building more of them does NOT even approach solving the problem at all.
They can ‘SAY’ (incorrectly) that it is cheaper, but when there’s no wind generation, it’s absolutely worthless.
Tony.
330
Nights do not have to be windless. The standard turbine begins turning around 8mph (sustained) and generates nothing. It takes a whopping 30+ mph to get full power, which almost never happens. The ramp up is pretty straight line so you need over a breezy 10 mph to get a measly 10%. Also solar only puts out as little as 10% on very cloudy days, so low wind days can be a big problem too.
I doubt the enormous storage problem is economically solvable, meaning W&S will never work alone. You basically need 100% “backup” which will actually often generate more than the frontup W&S.
171
Thanks David, the range in the production from individual farms can be very large, even in a single state. And other times when high pressure systems linger it is flat across the whole of SE Australia.
The charts show that the wind supply rarely exceeds 60% of capacity although some farms get up to almost 100% on occasion – that must risk disintegration!
Even on clear days there is not much solar power until mid-morning and it tails off rapidly from the late afternoon so there is next to nothing at breakfast and dinnertime.
That is apparent from the NemWatch widget that is such a great tool to show why wind won’t work although it is the property of the greatest crowd of wind boosters in the country.
90
C:/Users/Home/Downloads/1530-jan-ibso-NZ-Experience-from-Wind-Energy-Development-in-Europe%20(2)%20(1)%20(2).pdf Rafe you might find this an interesting expose on the gear box and other problems by a wind turbine engineer. Whilst from some years ago, the problems have not gone away.
20
From German OFF-Shore wind farms (averaging output 39.3% C.F. v ON-Shore 18%)
% of Time output % capacity
98.1%_________0.8
94%___________3.2
85%___________8.3
82____________11.5
76____________16.4
71____________21.1
62___________29.8
50%_________40.1
40%_________52.8
30%_________64
25___________69.7
20___________75.7
11___________86.1
7____________90.7
0__________above 98.1 ___(shut down in gales)
Whether the extra output justifies the extra cost of construction and maintenance is doubtful.
The UK off shore wind farms get subsidies up to $A 290 per MWh
30
I noticed this morning output figures for coal, gas and hydro, of 107% to 113%, you’ll never see those numbers from solar or wind.
20
But what about the worlds largest battery. That’s the future , all 10 minutes worth.
90
It has been proved however that they can provide local heating for a weekend. LOL
40
Freezing in the dark,asking Mummy”What did people light their homes with before candles?”will happen before the citizens recognize this scam for what it is.
How many freezer loads of food wasted,how much electronic gadgets destroyed before the publics attention focuses on the lies and the liars?
Probably thousands.
For public education is working.
Exactly as planned.
The Marching Morons are fully indoctrinated and stampeding forth..
Herds of Zombie like adherents to Gang Green,infecting and destroying civil society wherever it spreads..
You can’t cure stupid.
We have been protecting the useless and clueless from the consequences of their own actions,until we arrive at today.
Overwhelmed,out numbered and defeated by hordes of our own making..
So buy a portable generator and very quietly install it,where it cannot be seen or heard and run only lights invisible from outside your home..
For the modern Witch Hunters of the Cult of Calamitous Climate,will not rest,until all share their misery and depravity..
Oh you doubt this line of reasoning?
What have you seen these last 16 months?
There is no too low,for modern Progressives to go.
If you remain calm,retain wealth and keep your own electric devices functioning,you will be chosen as scapegoat of the moment..
How dare you have,the luxury of electric light and refrigeration,when the mob has destroyed near all?
Burn the Witch..
Mass hysteria is amazing.
Once again we are going to learn ,Civilization is skin deep.
200
Look at the fun that Extinction Rebellion are having in London at the moment.
Is it beyond hope that the police could be a bit more pro-active than they were two years ago?
http://Www.dailymail.co.uk/news/article-9925553/Extinction-Rebellion-descend-London-day-protests.htm
70
When those clowns superglue themselves to the road, why don’t they just put traffic cones around them and get on with the day.
60
So let’s think about that. We need enough generating capacity not only to keep the lights on but to re-charge the storage between droughts. At the moment nobody has managed to even keep the lights on for more than a few minutes. Good luck.
130
Similar here in the UK where for the past week wind has been providing 2 GW out of an installed capacity of 25 GW.
What I would love to know is what the firms get paid for a rather miserable performance,
i.e.:
Do they just get paid for the electricity they produce at market rates?
How does the contract for difference work in this case?
Do they have to pick up the bill for the back-up generators who have to keep their plants ticking over while the wind and solar producers get first bite of the cherry?
In all it seems to be a b…ers muddle with the consumer getting expensive and unreliable electricity and having to pick up the tab.
Before someone says that wind has supplied 40% of the UK demand at times, it usually happens on a windy summer Sunday with low demand, not at 7pm on a freezing winter weekday with an anti-cyclone over the UK.
90
They get market rates (inflated by carbon taxes) Plus subsidies.
The electricity supply situation is beyond description – lunacy or worse.
60
If you have blown up your coal fired power stations and put your hard earned on windmills to save the planet, you’ve just been scammed and offset …
China Coal Approvals Seen Adding to Confusion on Climate Action
https://www.bloomberg.com/news/articles/2021-08-25/china-coal-approvals-seen-adding-to-confusion-on-climate-action
>> China recently added more coal generation than Europe has operating!
70
And emerging nations are heading for oil and related products.
https://notalotofpeopleknowthat.wordpress.com/2021/08/25/emerging-oil-nations-reject-climate-curbs-on-exploration-pursue-rapid-development/
60
We’ve had a mostly windless summer here in southern Ontario.
Not that we need any green crap.
http://webroots.ca/static/ontarioelectricity/ontarioelectricity.html
60
It’s tourist season at Niagara Falls so the power generation is reduced to maintain the natural flow during daylight hours.
50
“by the way it’s not a river it’s a strait”.
Hidden Niagara – Creation of the Niagara Gorge
https://youtu.be/mDXrIPTYfTs
40
It’s getting dark Hydro is ramping up.
10
Gotta look after those tourists.
00
A beautiful set of numbers.
00
“China recently added more coal generation than Europe has operating!”
I could say that they would be laughing at the West but they are almost certainly working on the next faux solution to the next faux problem they bring to our attention.
Some decades ago they got government bureaucrats onto the concept of the “heat pump” to be used in supplementing regular heating elements in our hot water units.
Essentially these are refrigerators turned inside out and sound good until you examine reality. They are powered by the electricity they’re supposed to save and like all modern green ideas would use more electricity than they save.
Being made in Chyna these heat pumps don’t last long and, like the submerged water pumps in the compulsory storage units for roof water, have to be replaced regularly at significant cost.
On an engineering analysis roof water collection is a joke and it’s actually much cheaper and more environmentally friendly to build one large dam instead of the tens of thousands of residential “rainwater tanks”.
Take pity on those dumb Westerners, you can put anything over them.
Whatever we do we need to do it quickly; we’re about to go under.
When I see a news photo of the covid crew sitting close together at a table it makes my blood run cold.
Palachecz, Dan from Victoria, Scotty from marketing and Berys debating our future. What future.
50
We live in a street that cuts across a reasonably steep slope down to the river.
All of our stormwater | roof-water just runs to an old but adequate stormwater drain that cuts across all the back yards. But all new houses on our low side of the street have to install huge backyard tanks underground, and when full it is pumped up and disgorged into the street gutters.
That water runs into exactly the same stormwater drains we access, and it’s all then piped via gravity into the nearby river via a very large outflow.
My new neighbour shakes his head at this – and wonders how long the submerged pump in his tank will actually last, and what it will cost to repair or replace. He also has a mandatory above-ground water tank so he can recycle – but he doesn’t have a garden with plants requiring water.
30
That’s it: he’s got water he doesn’t need. If only there was a large communal reservoir to store all the runoff you mention.
10
Macarthur wind farm, one of the largest in Australia, was officially opened in south western Victoria in 2013. The 420MW wind farm was built at a cost of $1 billion by AGL Energy and New Zealand company Meridian.
During June-August, its output has varied from zero to 300 MW, average about 120 MW.
What does it take to turn that intermittent output into dispatchable power?
One option is to provide a backup gas or diesel generator of 120 MW. Just so happens that at Mortlake there is a 560 MW open cycle gas generator built in 2010 at a cost of $640 million. It is generally only used to meet peak demand.
Another is to provide storage for say 120 MW for 24 hours (that’s 20 times the size of that “big” battery in SA, so cost about $2 billion)
Surely it would make sense for any intermittent generator to also be required to invest in backup to guarantee reliable supply?
100
I think it should be mandatory for that to happen.
OR they pay for the backup that is needed to fill in the gaps.
30
The great irony of wind power in SA, is that following the large scale deployments, the state government then needed to provide heavily subsidised rooftop solar and battery solutions for low income people to avoid using the expensive wind. This says it all.
50
I guess the imminent growth in home generators is what they mean when they talk about green jobs? Even then there will be the RE scammers selling battery/invertor packs as “generators”
40
If “renewables generate the cheapest electricity” and “the Big Battery in SA has paid for itself inside 2 years” ** then the answer surely is for all wind farms to install batteries and supply more evenly. Benefit from prices not being pushed so far down when the wind blows, and get more money when it (or solar) doesn’t.
I won’t hold my breath.
**Both claims on Renew etc.
20
Graeme, Maybe you have not noticed the sudden explosion of “big battery” installations around the country ?
None of them are big enough to make any significance to continuity of supply from RE, but they will earn their operator/owners much profit from “milking the margins” between low and high wholesale power prices, and stabilising the grid when the RE induced fluctuations kick it out of wack ! (FCAS payments)
10
‘ They will earn their operator/owners much profit from “milking the margins” between low and high wholesale power prices, and stabilising the grid when the RE induced fluctuations kick it out of whack ! (FCAS payments)’
A problem that wasn’t around before uptake of useless power solutions.
20
Chad:
Do you mean like the Moorabool “big Battery”? 450MWh capacity – that would supply SA for a whole 18 seconds, and a lot less for Victoria.
Yes, they are into arbitrage – buying cheap (when the wind blows) and selling for a profit (when the wind doesn’t blow). How much stabilising the grid they do, I don’t know, but I see that the SA Grid authourity has installed 4 synchronous condensors for that purpose. Seems they don’t think much of the Horndale “big battery”.
And as for batteries we would need around 360 of the Moorabool big battery as a minimum.
10
Where I live in Victoria if I drive any direction on the compass I will pass wind motion power installations.(WMPI’s) All of varying age. Driving home the other day I passed two WMPI’s. One with the “old “turbines ( horter blades approx 15 yo) and then another with newly installed turbines (much longer turbines). Both installations within 5 km of each other and at similar heights. Light to moderate winds blowing late afternoon. The older turbines were spinning and the newer ones not. So, more wind force is needed for the newer turbines (3 Kw units?). So, those wind drought hours will probably increase as the newer turbines come on line.
40
I hadn’t realised that gearbox failures and problems were such a common occurrence, something that will become more apparent as the installations become bigger and bigger.
20
Oh and by the way – can we stop calling them wind farms? I know it’s a name recognition thing for the masses, but if we call them “farms” they come off sounding all cute and cuddly.
40
Well with the real ones it depends on whether it is evening or morning
https://redpowerphotos.s3.us-east-2.amazonaws.com/monthly_2021_08/FB_IMG_1629338133359.jpg.ea25ff475f59c7d1d54e18fcb8209dcf.jpg
10
Of course the entire delusional, TOXIC S&W fantasy is just more BS and fra-d and can never power a modern economy. IOW ZERO BASE-LINE power generation.
And never forget that the entire SH is a NET co2 SINK and the NH is the only NET co2 SOURCE.
See CSIRO Cape Grim site link. Under Seasonal Variation at the link. When will voters and the so called scientists WAKE UP and tell the truth.?
https://www.csiro.au/en/research/natural-environment/atmosphere/Latest-greenhouse-gas-data
20
Rafe,
At the site https://opennem.org.au/energy/sa1/?range=1d&interval=5m The graph is set on South Australia and one day at 5minute resolution (you can change the display with the buttons, obviously).
It shows little flashes of blue in amongst the wind and solar. This is the big batteries doing their thing to try to steady the rate of change of energy surging about the grid .
Of note is that the 5 minute resolution is far more scratchy than the regular 30 min resolution displayed. This helps to demonstrate the massive surges RE forces on the grid. The little blue battery flashes cost many millions of dollars.
In a normal grid large consumers( industrial) give notice of a load starting. The 5min resolution graphic shows RE doesn’t bother. The wild swings are an expensive nightmare.
40
Rob,
Opennem, is a excellent source of info, …..but like many other similar data sources i do not believe they have any way of knowing what the Roof Top solar generation is at any particular time , or over any useful period.
I am aware that some attempts are made to sample random RTS generation facilities, and then factor that up to a “State total”,… but the potential errors and assumptions in that process are huge.
At best, i would not expect their figures for RT Solar to be within +-20% of reality and hence not reliable for any serious analysis.
10
Chad,
I agree about behind the meter solar estimates. My comments were mainly about wind and batteries.
Wattclarity talks about the renew economy widget:
https://wattclarity.com.au/other-resources/widgets/reneweconomy-widget/cadence-timestamps-and-data-points/data-details/
I expect NEM widget is similar but I’m not sure.
00
Tony from Oz had a good look at the ups and downs of wind and we produced a briefing note to spread it around.
Hard to summarize in a few words but in short it is a very ugly situation and it gets worse rather than better as the installed capacity increases.
Over the relatively short period of the study, significant falls in the supply of wind power, equivalent to the size of a typical coal-fired generator, became more prevalent, larger in size and the power loss occurred more quickly.
Over the two years of the study there were 107 separate entries for power losses of 500MW or more within one hour. The highest fall was 980MW on 09May 2020; that is equivalent to two coal power generators going off line in the hour. There were 16 occasions when the fall was 700MW or greater.
20
P.S. if you zoom in on the green part, wind output, more little blue tips become clear. Big batteries are an enabling cost of RE. Nothing more. Still RE requires more and heavier transmission and control gear to accommodate surges and sporadic maximum output. An new dimension to gold plating the grid.
20
The GWPF now insist that Johnson’s wind delusion+lack of leadership on Nuclear power is a UK national security risk.
And ditto for us here in Australia. China is a long way ahead with NUKE development as it has been with COAL for decades.
https://www.thegwpf.com/boris-johnsons-wind-delusion-poses-national-security-risk/
40
I think what I find most disconcerting in policy in Australia is the wanton ignorance of technologies that can provide substantial reductions in GHG emissions AND system reliability.
The most efficient ultrasuoercritical cal technology today is already delivering 47.5 percent net efficiency rates—and the global fleet average has risen to 34 percent. Whereas 660MW was previously the maximum size of generator sets, they have reached 600-1100MW and operating temperatures and pressures increased. The RDK8 steam power plant at the Rheinhafen-Dampfkraftwerk facility in Karlsruhe, Germany owned by EnBW, has achieved a 47.5 percent net thermal efficiency while producing 919 MW of electricity. That’s correct: Germany has built new coal plant, as well as being networked to France’s nuclear capacity.
GE is now marketing advanced ultra-supercritical (AUSC) technology, calling it SteamH. SteamH combines steam plant technology operating with advanced ultra-supercritical conditions and digital power plant data platform called Predix. GE claims 49.1 percent efficiency for AUSC, and the first plant, Pingshan power plant phase two in China of 1350MW was commissioned in December 2020.
Predix allows much more flexibility ramping up and down – if we really need non-dispactcahble renewables.
For every 1% improvement in efficiency, GHG emissions fall by 2-3%, so best available technology can provided a 30-45% abetment of GHG emissions – more with brown coal, less with better black coal.
Are there any engineers advising the government(s) are are they all regulatory lawyers?
60
There’s a great German word gaining currency in the wind debate: “Dunkelflaute”.
It means “Dark Doldrums” – like we have in the UK quite frequently, often lasting for days.
There’s a further wrinkle to the low-output scenario. When a wind turbine is becalmed it doesn’t just stop generating…..it draws power from the grid.
The power is needed for a variety of uses: instrumentation; aircon/heating depending on weather; oil circulation; etc.. These are relatively small loads but, from time to time, the turbine has to be rotated to avoid bearing damage from staying in one spot (called “brinelling”, iirc). That can draw a fair current.
So, if a large windfarm is becalmed, there will be quite a draw on the grid: negative output, if you like.
I don’t have any figures for the scale of this load but it’s the last thing the grid needs when the renewable fleet is not producing.
10