At some point, the ice sheets want their land back
We’re balanced at the end of a ten-thousand-year warm spike, in an ocean of ice-ages, reshaping our economy to try to stop a half a degree of warming.
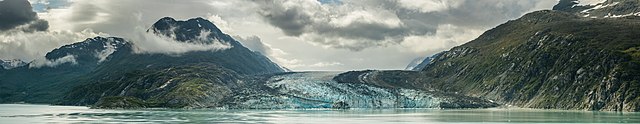
Those glaciers are coming… | Photo by Diego Delso
The last million years have been whipsawing climate action. While modern Homo sapiens sees two degrees of warming as an apocalypse, for most of the last million years it would have been God’s gift to Pleistocene man.
….
Ken Stewart compared the current interglacial with the last three, and found our favourite – the Holocene — has already run longer than all of last three did.*
Global Warming or Global Cooling: Keep an Eye on Greenland
Ken Stewart
There are several ways of identifying the start and end of interglacials. I have chosen points when Antarctic temperatures first rise above zero and permanently fall below zero relative to 1999. Graph 3 shows the length of time between these points for the previous three interglacials compared with the Holocene.
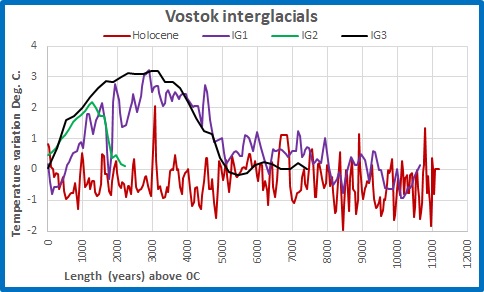
The Holocene has lasted longer than the previous three interglacials: and is colder.
The point where the green, black and purple lines end is when temperatures fell permanently below our current baseline temperature (1999 give or take a decade). We can also see just how tame the current interglacial has been — with all the others getting 2 – 3 blockbuster degrees hotter.
The key question is when does a little ice age become a Big One? Where’s the point of no return?
Possibly it’s the point when the Northern Hemisphere turns into a giant white mirror:
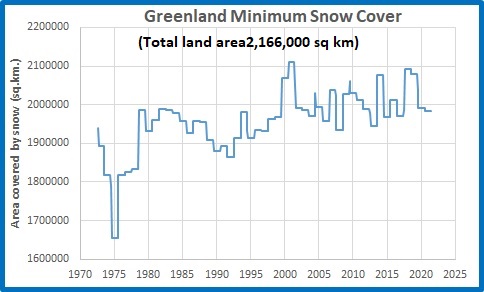
Many scientists think glacial periods start when summer insolation at 65 degrees North decreases enough so that winter snowfall is not completely melted and therefore year by year snow accumulates. Eventually the area of snow (which has a high albedo i.e. reflects a lot of sunlight) is large enough to create a positive feedback, and this area becomes colder and larger. Ice sheets form, and a glacial period begins. This is a gradual process that may take hundreds of years.
Well before global temperatures decrease, the first sign of a coming glacial inception will be an increasing area of summer snow in north-eastern Canada, Baffin Island, and Greenland.
Despite fifty years of greenhouse gas production, snow on Greenland isn’t melting away in summer as much as it used too. If this trend continues, Ken calculates Greenland might be completely covered in snow all year round in just 45 years.
It’s probably nothing…
But as Ken says, it’s only a short trend, and the Little Ice Age was colder but didn’t trip the albedo feedback loop and plunge us into a Big Ice Age, which was very convenient. We probably have a few centuries yet.
More to the point though — if climate models actually understood the climate, we might know the answer. What are our governments doing about that? They’re working hard to make the planet cooler, which is probably the best thing they could do, since they’re so bad at it, they might unwittingly help.
If the start of the endless winter was 50 years off, would we even know or will we still be holding UN Conferences to stop the warming as the Ice sheets reach Ontario?
Thanks to Ken. Go and say hello at his blog. It’s great work.
_______________________________________________
*Inasmuch as water evaporating off then falling as snow at Vostok represents global temperatures.
Photo (top): Lamplugh Glacier, Glacier Bay National Park, Alaska, United States. By Deigo Delso


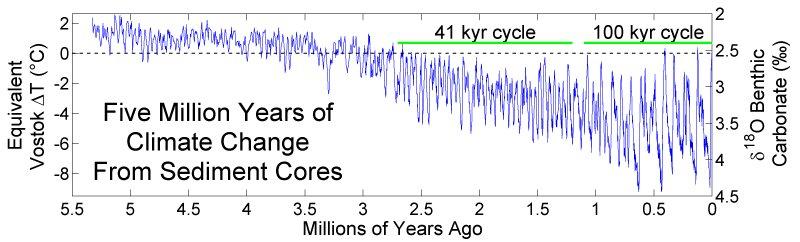
The first chart is somewhat misleading by showing the min/max difference decreasing in the past. What’s actually happening is that each sample represents longer and longer term averages as they go back in time. The same is true with the ice cores where recent samples are averages across as little as a 1-2 decades, while older samples represent averages across many centuries and even millennia. Longer period samples wash out short term deviations, so while it’s not apparent, the p-p deviations in the past were mostly the same as they are today. However, the long term cooling trend is readily apparent.
210
An interesting point and this shows the integrity of the team which collected the data and graphed it without the “corrections” so common in modern climate science.
220
Ah, but this also known as the adustacene.
100
And there’s no Justice in the Adjustocene.
Everything is turned inside out and upside down.
30
I prefer Absurdocene
00
This Greenland Ice core data graph is very interesting as it shows cyclic warming on the Greenland ice sheet, the same as is occurring now.
The Greenland ice core data/analysis was initially suppressed not believed, because of the unexplained cyclic warming. This cyclic warming is called a D-O events and it occurs with a periodicity of 400 years and 1200 correlating with solar cycle changes. (The solar cycle evidence is so regular it is used to find the timing of the D-O warming). Recent analysis has shown the exact same periodicity of warming on the Greenland Ice sheet, occurs in the South hemisphere, with same periodicity.
The ice formation and later analysis of the gases in the formed ice, hides rapid temperature changes. The gases are analyzed to determine ice sheet temperature. The is a delay in snow that has fallen on the ice sheet, to form the tight ice that traps gases in the ice.
The snowfall rate is much higher on the Greenland ice sheet, than the Antarctic ice sheet, so the smoothing/fast change hiding problem, is not as sever as the Antarctic ice core data. (i.e. The finding of fast cyclic warming was not expected as the fast warming is smoothed away in the Antarctic ice core data.)
This is the proxy temperature data from the analysis of the Greenland Ice Sheet Two project for the last 11,000 years, from Richard Alley’s paper.
https://www.climate4you.com/images/GISP2%20TemperatureSince10700%20BP%20with%20CO2%20from%20EPICA%20DomeC.gif
The Antarctic Peninsula juts out of the Antarctic polar vortex and has a high snowfall rate so it captures ‘fast’ changes to the South sea temperature with similar resolution as the Greenland ice core analysis. The south hemisphere has warmed cyclically in the past, exactly like it is warming now.
The first paper about this data was suppressed by firing the Nature ‘Science’ editor who has working with authors to publish a science paper written by highly qualified, unbiased proxy specialists.
Does the Current Global Warming Signal Reflect a Recurrent Natural Cycle.
http://wattsupwiththat.files.wordpress.com/2012/09/davis-and-taylor-wuwt-submission.pdf
“Public media in the U.S., including National Public Radio (NPR), were quick to recognize the significance of this discovery. The past natural warming events reported by Mulvaney et al. are similar in amplitude and duration to the present global warming signal, and yet the past warmings occurred before the industrial revolution and therefore were not caused by anthropogenic greenhouse gases.”
120
Good detail in the Richard Alley graphs.
20
The team had integrity handling the data precisely because they WEREN’T “climate scientists” but actual scientists.
50
Thanks.
That makes sense.
I was also interested in the 100,000 year cycles and the 41,000 year cycles.
The graph source is here, along with a discussion of the cycles.
https://commons.wikimedia.org/wiki/File:Five_Myr_Climate_Change.png
I found this by clicking on the graph, which takes you back to an old post by Jo in 2010, and thence to the source.
20
The end of the Holocene interglacial is the ultimate nightmare scenario, it truly scares me. When I tell people that I hope and pray for another 1000 years of continued warming, they look at me like I had just blasphemed. They must think I’m one of those dreaded climate deniers that they’ve heard so much about, maybe even a Trump supporter. The horror.
530
More often than not being a contrarian is being correct.
131
What are the chances that in the long history of the evolution of man we reach a point where nature could be our undoing yet our progress and inventions (read co2 emitters) are such that we inadvertently take the edge off that threat. Maybe that is why we are meant to be “warming up” at this particular time in our history. But then such thoughts might suggest that it is by design and not by mathematically stupefying coincidence. Such thoughts would add credence to Albert Einstein’s suggestion that “Coincidence is God’s way of staying anonymous” and that is just too far fetched for many – lol.
32
We are so incredibly fortunate to be living in an era of mostly benign temperatures, (although some more warming would still be very beneficial) and raised CO2 levels for plant growth to feed the world’s population.
Dropping back even to LIA temperatures and more associated chaotic weather patterns, would cause a lot of problems with famine and cold death in many parts of the world.
190
@Klem
End of the Holocene – I expect it to be slow and I won’t be here.
As I recall – no time to investigate now –
A glacial advance takes a long time because snow accumulates slowly. Snow and then cycles of thawing and freezing give us harsch, névé, and then firn. Layer after layer of snow has to fall before pressure becomes enough for ice begin to move out or down.
A glacier begins to flow when a thick mass of ice begins to deform plastically – – it is common for deformation to occur below a depth of 50 meters (about 160 feet) from the surface of the glacier.
In contrast erosion of ice and snow can be rapidly under warm rain.
So, glacial advance is slower than the return of an interglacial.
Search it up – don’t quote me.
30
I had that experience over lunch today with someone involved with business development. I tried discussing the science behind my scepticism of Global Warming and he said he didn’t have the background to understand the issues but he still believed in the narrative because I was not a scientist and couldn’t accept that I knew more than scientists and journalists who follow the IPCC, etc
BTW I’m an engineer so trained in science to a fair degree
Then we got on to renewables and he was adamant that we can switch to them because he recently bought solar panels for far less than in the past. I brought up that China was putting more coal power online each year (rather than deploying that amount of solar) than the total that Australia has installed and he stated that China needed to develop. The inconsistency between his arguments could not be made apparent to him.
This is the battle we face and why I think only blackouts and massive price increases for electricity, while the weather stays as it has always been, can cause the masses to see the fallacy of CAGW and renewables.
90
So you tried to brow-beat somebody into believing that China was somehow behind on embracing renewables?
You realise as soon as they bother to look up the facts, your credibility with them just plunges to zero, right?
That won’t be good for business…
“China is the world’s leading country in electricity production from renewable energy sources, with over double the generation of the second-ranking country, the United States”
“…in 2019, renewable sources provided 26% of its electricity generation”
“https://en.wikipedia.org/wiki/Renewable_energy_in_China#:~:text=China%20is%20the%20world%27s%20leading%20country%20in%20electricity%20production%20from%20renewable%20energy%20sources%2C%20with%20over%20double%20the%20generation%20of%20the%20second-ranking%20country%2C%20the%20United%20States
02
Poor Craig….. displaying the ignorance on a base-level AGW lackey can muster.
https://e360.yale.edu/features/despite-pledges-to-cut-emissions-china-goes-on-a-coal-spree
““China is the world’s leading country in electricity production from renewable energy sources, with over double the generation of the second-ranking country, the United States””
And over four times the coal fired power generation of the USA.
And you do know that nearly all China’s “renewable” generation is hydro, didn’t you !
10
typo correction first line above .. on => only
00
And the trouble for unreliables in China is that China is being sensible
“Grid firms will be encouraged to accept more renewables in addition to the minimum 90 GW capacity, as long as the projects are equipped with power storage or peak-shaving capacity which would help ensure stability of the grid system”
It now become cost prohibitive !
10
Our climate is a complex system. It has many non-linear contributing factors, feedback loops and time delays.
In chaotic systems statistics does not give reliable predictions. What we can do is to find system’s attractors. Melting point ice one factor that is physically important but it is not the only one. Vostok variation data of Holocene seems to be fluctuating between +1 and -1 C.
Having one single cause and one single effect suits well for political propaganda but complex systems do not typically behave like that. CO2’s 1,5 W/m2 is tiny challenger to Milankovitch cycles, sun, volcanoes, cosmic events. Natural variations can just match without any clear cause. Desire to explain everything is typical for media. When DOJ goes down it might be just first Monday of August.
111
Visited Ken’s blog.
The first graph is one I’ve always found fascinating: it shows so much detail, and the graphical presentations are so easy to look at.
🙂
90
And chaotic systems don’t have discernible “Tipping Points” as they can change abruptly for no apparent reason.
101
Oops, I messed up, that was supposed to be a reply to #2, Global Cooling July 31, 2021 at 5:55 am
10
https://en.wikipedia.org/wiki/Climate_of_the_Arctic
Not much snow in the arctic. The flip will come when precipitation increases. Ice sheets will form thicken and flow southward
Don’t expect albedo or temperature to have much to do with it unless things get a lot hotter
10
In our human era, the vast areas are devoted to agriculture And logging. Does that change the albedo ?
20
Yes we transform the face of the world, almost as easily as pine beetles or locusts
It leaves the possibilty of creating convection cells by constructing a checkerboard ofhigh and low albedo, each checker board square being miles acrosss in extent. Easier thsn a forest of windmills. quicker than building an Urban Heat Island
Amazing how easy it is to change the local climate by encouraging convection cell development
People are transfixed by CO2 but we have been changing climate in big ways long before that and through other means
60
No. I suspect rain in Summer is what leads to interglacial periods – a rare wet period in the Arctic basin. Ice is a good insulator so lakes of water can last a while on the surface. It need not be deep to change the albedo of the flooded layer. It’s the only thing that can explain reversal of such a strong positive feed back of ice reflecting the warming sunlight. Not very strong in Summer but many more hours than at the equator so the Arctic is pretty warm in Summer. “Many scientists think glacial periods start when summer insolation at 65 degrees North decreases enough so that winter snowfall is not completely melted” doesn’t really make sense when the albedo is so high. It’s not that big a variation in isolation.
10
“Don’t expect albedo or temperature to have much to do with it unless things get a lot hotter”
Is that the Oh Susanna effect?
60
Susanna as in Que Sera Sera
How do you get ice sheet formation and growth with low precipitation rates? I am told that there is barely any snow on the ground during winter. Water transforms from solid to gas by sublimation.Think desert
Put another way, why do you think the Antarctic ice cap is growing. Because it is colder? Because it is shinier? Because itis drier!? How about because it is snowing there more, Snowing so much that theice thickens rather than shrinks through sublimation
Here in warmer and wetter Ontario, we see the snow and ice magically disappear during the winter by way of sublimation. Old snow shrinks that way
https://en.wikipedia.org/wiki/Sublimation_(phase_transition)
Dont forget the glaciers. They might be shrinking due to global warming but the back end of growing involves lots of precipitation high up where the ice doesnt melt
The snows of Kilimajaroo disappeared because of a drop in precipitation
30
Javier, at Judith Curry’s place:
“Analysis of interglacials of the past 800 Kyr shows they depend on obliquity-linked summer energy, ice-volume, and eccentricity, and they end at glacial inception after ~ 6000 years of Neoglaciation-type temperature decline. The lag between orbital forcing and ice volume change indicates the orbital threshold for glacial inception is crossed thousands of years before glacial inception, and the Holocene went through that threshold long ago. In the absence of sufficient anthropogenic forcing glacial inception should take place in 1500-2500 years.”
https://judithcurry.com/2018/08/14/nature-unbound-x-the-next-glaciation/
If glaciation begins in 1500 to 2500 years I will have time to find warmer clothes.
130
I like Javier’s work and there is much to discuss, Meltwater Pulse 1A was extraordinary.
‘The warming phase is explosive, fed by a fast ice-melting feedback, producing an early peak. It appears to constitute an excitable system from a stable glacial state. A slow declining phase from the peak towards an inflection point (unstable point), suggests a quasi-stable warm phase as the warming conditions wane.
‘At the inflection point the intensification of the slow ice-accumulation feedback accelerates the cooling phase increasing the climatic instability and producing a faster relaxation towards the stable state.
‘Fast-slow dynamics acting on excitation cycles have been discussed as an explanation for both Dansgaard-Oeschger events and interglacials (Crucifix, 2012), in which the cold stable and warm quasi-stable states constitute the different branches of a slow manifold in an excitable dynamic system.
00
Greenland snow cover is a misleading metric. Increasing snow cover is actually an indicator of warmer temperatures as it is often too cold to precipitate.
Greenland ice sheet mass loss is on average 279 billion tonnes per year, sufficiently large to discernably raise sea levels, disrupt weather patterns and ocean circulation systems.
226
The Antarctic ice shield is based on snow fall, and we all know, Anatctic gets colder over all. What do you believe why it’s snowing there ?
Measuring snowfall in Antarctica
Discovering how much snow is falling on the world’s coldest, windiest continent
Simple simon, it snows because it, as you said
😀 😀 😀
181
“sufficiently large to discernably raise sea levels”
You mean the average 2mm or so per years as seen by the tide gauges ?
SMB was lower in the 1920,30s than it has been recently.
This year loss is less than average , until a loss in the last couple of days because of blocked weather patterns
https://notalotofpeopleknowthat.files.wordpress.com/2021/07/image_thumb-113.png?w=600&h=765&zoom=2
102
forgot pic link for the SMB history
https://i.postimg.cc/CLmFmrfx/Greenland-Surface-Mass-Balance-Fettweis08.jpg
52
Why stop at 2008? The most accurate measure of ice sheet mass is the GRACE satellite constellation. https://climate.nasa.gov/vital-signs/ice-sheets/
217
LOL, Variation of total Greenland mass since 1900 is a flat line.
https://i.postimg.cc/VNY0fL3Y/Greenland-ice-mass2.png
At the current rate of loss, which is totally unrelated to atmospheric CO2.
..it would take many thousands of years to disappear.
Did you notice SMB is above average this year ??
There is no evidence of the very tiny losses, measured btw, by gravity based systems measuring over a known active volcanic region (do you even comprehend what that implies ?), having any impact on sea levels whatsoever.
They are totally insignificant in the scheme of things.
Greenland ice area is far higher than its been for most of the last 8000 + years
https://notrickszone.com/wp-content/uploads/2016/12/Holocene-Cooling-Greenland-Ice-Sheet-Briner-16-copy.jpg
You really have a total lack of perspective about everything don’t you.
You have a very simplistic understanding of reality, at best !
111
So funny that they continue to show the tiny losses each year, even though it is gravity based over moving magma sacs
And of course there is still far more Greenland Ice than there has been for most of the Holocene.
Arctic sea ice extent is also well above what its been for nearly all the last 10,000 years
https://i2.wp.com/notrickszone.com/wp-content/uploads/2017/03/Arctic-Sea-Ice-Holocene-Stein-17.jpg
We are still very much in a cooler period of the Holocene
91
Not anymore we’re not. BP proxies stop at 1950 AD so you have to consider temperature increase and ice mass (not necessarily area) loss since then. Most temperature reconstructions have us now above the warmest periods of the Holocene.
https://www.nature.com/articles/s41467-020-18478-6
We’re in the Anthropocene now, and it may not for last very long.
217
‘We’re in the Anthropocene now …’
There is no suggestion of that in the Nature paper, we are entering a mini ice age.
71
“We’re in the Anthropocene now, ”
Get real. This is a non-thing. That is, there is no anthro-schist.
81
“Not anymore we’re not. “
Utter and complete rubbish
The “reconstructions” with a spike at the end, are baseless ignorance, splicing short term hi-resolution urban affected and often un-scientifically “adjusted” data onto highly averaged low resolution data.
I doubt your feeble level of mathematical comprehension understands the problem with that.
Arctic sea ice is still in the top 5-10% of the last 10,000 years
Greenland ice area is still only a tiny amount down from the highest levels in 8000 years
What don’t you comprehend about this picture of tree stumps under retreating glaciers, where trees have no chance of growing in the current somewhat chilly climate we are currently experiencing.
Its a simple thought process…. is it simple enough for you, though ?
And you still haven’t produce any scientific evidence that the highly beneficial warming out of the LIA has anything to do with human released CO2.
https://i0.wp.com/www.drroyspencer.com/wp-content/uploads/Mendenhall-Glacier-tree-stumps.jpg
We are barely a small bump out of the coldest period in the whole of the Holocene.
101
“We’re in the Anthropocene now, and it may not for last very long.”
The “Anthro-obscene” is due to manic data mal-adjustment, not reality.
It is human caused not-real warming.
And yes, we can all hope that someday, someone will bring these scientific miscreants to justice and end this farce.
51
Trees under Exit Glacier, as well
Trees were growing there as recently as 830 +/- yrs ago.
They can’t grow there now.
How much warmer will it need to get in order for the trees to take root and grow into a forest, once again ?
https://www.nps.gov/kefj/learn/nature/upload/The%20Retreat%20of%20Exit%20Glacier.pdf
81
” ice mass (not necessarily area)”
LOL. the simple one thinks mass and area aren’t related.
Please keep typing ridiculous inanities, Simon.. its fun to watch ! 🙂
Greenland SMB above average this year.. did you know that !
And since its got a positive SMB, and GRACE, in all her volcanic based wisdom, says Greenland is losing mass (all gone in about 120,000 years ! Panic !)
…. does that mean its melting underneath ?
Try blaming that on atmospheric CO2, just for our amusement 🙂
31
Oh, and we are still waiting for you to produce some actual scientific evidence that the slight warming since the LIA has been:
a) caused by human released CO2
b) has been anything but highly beneficial to all life on this carbon-based planet we are fortunate enough to live on.
122
AR5 Chapter 10:
https://www.ipcc.ch/site/assets/uploads/2018/02/WG1AR5_Chapter10_FINAL.pdf
110
ar5
Ha ha ha ha ha ha ha ha ha ha.
61
‘The observed recent warming hiatus, defined as the reduction in GMST trend during 1998–2012 …’
They can’t find any external forcing to account for it and now we have a new hiatus. The IPCC just brush it off as irrelevant, yet its integral to the whole debate, would you like to hazard a guess at the cause?
50
Climate Scientist Phil Jones wrote that Simon!
Well done.
50
LOL.
You were ask once before to point to the particular science in AR5
You failed miserably
And you always will, because it contains no science.. it is a political summary
So.. direct link to your “science”
….. or stop your child-like gullible stupidity !
80
Attribution studies are not science.
They are a “chose-what-you-want-to-show” and neglect-everything-else, farce.
And all the “likely’s” and “maybe’s” and “medium/low/high confidence” phrases, and many other anti-science statements riddled throughout this propaganda garbage.
… its a monumental joke that only the simplest of minds could fall for (unless they had another agenda for “dumb belief”). !
60
Quite hilarious really…..
They build their CO2 conjectures into models . run by CHIMPS.
Then they adjust the once-was-real data to suit their models…
.. and still fail !!
30
Even the first paragraph is a load on nonsense.
Sea level rise.. there is absolutely no evidence of any human effect
Ocean acidification.. that furphy again. !
Climate extremes.. nope.. not happening.. A few records either way.. normal process.. Current climate is actually quite benign compare to LIA.
There’s that scientifically unsupportable conjecture again…. ie load of BS !!!
And yes, the AMO does significantly affect temperatures. That’s why they had to “mal-adjust” the 1940’s peak.
The only warming in the satellite temperature era has come from El Nino events, about which climate models know nothing.
20
If you don’t accept the Chapter 10 summary, then you should read and critique the 600+ papers in the references.
The scientific consensus and every nation on earth accepts the science. What’s your problem? You need to show why the science is incorrect and then get those results peer-reviewed and accepted in a premier journal. If you can’t do that then your opinion is not worth squat.
011
Waiting for your “science” Simon !
Its your story.. you find it and produce it.
So far you are failing miserably.
And make sure it is actual empirical science. (as if you would have the vaguest clue what that is).. not some hugely biased unscientific attribution garbage.
And No… AR5 is a political summary..
It is not peer reviewed it is written specifically as a propaganda leaflet for political purposes.
What don’t you understand about that fact !
40
“accept the Chapter 10 summary”
And yes, I do accept the summary, for exactly what it is.
… a load of political agenda driven, uninspired, anti-science, hogwash !
Maybe if you had even a tiny amount of scientific awareness, you might see it too.
30
U.N. climate panel confronts implausibly hot forecasts of future warming
00
From the Union of Concerned Scientists
https://blog.ucsusa.org/dave-reichmuth/are-electric-vehicles-really-better-for-the-climate-yes-heres-why/
Look at the map of the USA with miles per gallon (MPG) Equivalent
Notice the values are calculated based on renewable generation. That cars are assumed to be charged duringdaylight and that the the US is closing nuclear and coal fired plants.
My point is that this is ‘advocacy’ is from a creditable source but gives clearly misleading information..
The USA will have big power generation problems, made worse by flooding the market with EV, made worse by switching to heat pumps, made worse by switching to electric stoves, made worseby switching to electric hot water heaters, made much worse by closing down nuclear plants.
The supposedly realistic credible Union of Concerned Scientis MPG map is “spin”
The purpose of the IPCC is to manufacture a consensus spin, to take scientific facts and spin it into a case for the earth is heating dangerousuly. It is very deliberately advocacy. Pure politics is the sciency kind of way
What could possibly go wrong?
10
If you are a scientest and you cannot explain the interglacials then your climate models are worth only small squat.
It is not astronomical because if it were so the IGs would have a precise period.
That leaves fluctuations within the sun or earth based. What is the earth based process for the IG?
00
Raving, your comment about the cause of the ending of glacial periods;
” It is not astronomical because if it were so the IGs would have a precise period”
O.K. we switch on the Sun and begin to melt the ice.
The last ice field over New York central park was almost a mile deep and now the Sun shines.
How long does it take to melt a single ice cube that could fit in the palm of your hand?
How long might it take to melt an ice cube that stretched from N.Y. up to the North pole?
Does vulcanism and solar variations enhance or delay the melt.
It’s a big thing when you look into it.
10
‘From 1979 to 2017, accumulated Antarctic precipitation contributes to significant ice mass loss acceleration in the Pacific sector and deceleration in the Atlantic-Indian Sectors, forming a bi-polar spatial pattern. Principal component analysis reveals that such a bi-polar pattern is likely modulated by the Southern Annular Mode (SAM).
‘We also find that recent ice mass loss acceleration in 2007 is related to a variation in precipitation accumulation. Overall ice discharge has accelerated at a steady rate since 1992, but has not seen a recent abrupt increase.’ (Kim et al 2020)
20
Current Greenland ice area is well above what it has been for most of the last 8000+ years.
Only a small about down from its peak in the LIA.
https://notrickszone.com/wp-content/uploads/2016/12/Holocene-Cooling-Greenland-Ice-Sheet-Briner-16-copy.jpg
111
Can’t be too cold to precipitate. Warmer temperature may mean higher humidity and therefore more moisture to precipitate. Simon your interpretation is wrong.
90
Greta will be a miserable middle-aged female longing for a great big bloke to keep her warm. Ha bloody Ha!
50
In this time of diversification – everything must diversify except the climate – she may long for one of her own kind… how un-diversified!
10
“Greta will be a miserable middle-aged female longing for a great big bloke to keep her warm. Ha bloody Ha!”
I think it’s more likely she’s on the other team.
50
The problems with the Left are that:
1) they think the climate and environment is static which is a very dangerous and incorrect belief (but consistent with their overall lack of knowledge of history, science in general, or their rewriting thereof),
2) they don’t understand what a scientific “model” is and have more faith in the models of corrupt “scientists” than even looking out the window to see what the weather’s doing. No climate model currently in use by warmists has ever accurately forecast or hindcast anything. Therefore the models are invalid but they keep using them. That’s not science.
3) The true reason the Left are pushing the anthropogenic global warming fraud is the serious economic damage that it’s doing to Western Civilisation which they hate (to the benefit of the socialist billionaires who are supported by a vast slave army of useful idiots)..
4) As to point 3) the damage being done to the West is now surpassed and massively accelerated by COVID mismanagement, lead by a “former” Marxist Terrorist at the World Homicide Organisation and for whom no Western leaders are prepared to question. President Trump was the exception and look what they did to him. Effective use of known antivirals could stop the pandemic in weeks or as fast as the drugs could be produced. COVID mismanagement has all the advantages for the Left of the anthropogenic global warming fraud but it’s working much faster.
4) Genuine climate scientists of the 1960’s and 1970’s were correct when they predicted global cooling.
201
David, generally agree … but,
#1 They appear to me to believe that the can produce a ‘static’ climate through enlightened good governance.
The glaciers will stand still in majestic Ansel Adams presence and it will never rain til after sundown like Camelot. 350.org
#3 I’ve mostly thought the purpose of AGW propaganda is to establish supra national global legal structures for the purpose of supplanting nation states. Of course, the US did stand in the way.
#4 They drew four Aces with the V.
80
Big admission from Science journal: “The climate models that project the future have grown too alarmist.
Many of the world’s leading models are projecting warming rates that most scientists, including model makers themselves, believe are implausibly fast.”
https://www.sciencemag.org/news/2021/07/un-climate-panel-confronts-implausibly-hot-forecasts-future-warming
Seems that ice ain’t going anywhere in a hurry.
It’s not like anyone pointed this out over the last few decades … the climate gate emails, Kevin Trenberth to Phil Jones, “It’s a travesty that we can’t account for the lack of heat.”
90
If the frigid snow blizzards of July continue for Australia’s Snowy Mountains, the next glaciation *may* commence upon the summit of Mount Kosciuszko.
N.B. *may/could/might/possibly/maybe.
P.S. Freezing snow showers are forecast for Jo’s home state of Western Australia this weekend, albeit on Bluff Knoll down south: rug-up Sandgropers!
90
Thanks for Ken and his hard work over the years.
Willis has also checked out Greenland over the years, like his essay about Greenland in 2019, “Greenland is way cool”.
And like his mention of Steve McIntyre who instigated his essay, I suspect they’ll be quick to pounce if things start to cool in any unusual way.Like after an early change back to the cool phase AMO.
Of course Greenland was way cool up to the change to the warm phase AMO and since about 1995 there has been some warming as we would have expected.
Of course many Solar physicists have different ideas about our Holocene’s longevity. Some think we are near the end and some think we may have a few thousand years and others like Leif Svalgaard think we may have 40 to 50 thousand years to go. Who knows.
Here’s Willis’ essay and a number of interesting graphs etc.
https://wattsupwiththat.com/2019/01/08/greenland-is-way-cool/
60
I’m not aware of his view on this. It would be a considerable departure from the well established cyclicity within the first graph, above. You’d need very clear reasons to think that cyclicity will suddenly change. I seriously doubt he has that, so I’m guessing he doesn’t really think that, just suggesting/speculating about a possibility of it.
The first graph on the left side looks like noise already there simply grew to become a climate trend via simply amplifying the level with time to the present day. Same existing noisy process became a louder detectable climate-signal oscillation. So what’s going to turn that oscillating signal back to noise amplitude level over the next 50k years, of a basically unprecedented super-interglacial?
I’m sure he doesn’t know that much … unless he really does believe AGW will modify the current cyclic trajectory’s path. Which would be a bit ‘courageous’, which may suit some funding options rather nicely I suppose.
The clearly more probable expectation is the cyclicity will approximately continue, and as can be seen, the amplitude is increasing with time, not decreasing, so the geological-scale ‘recent’ cyclicity probably won’t attenuate much for several million years to come.
31
WX Cycles, here’s Leif answering questions in AUG 2013 at WUWT. He refers to another study that Earth’s more circular orbit etc could extend the Holocene for another 50,000 years. I can’t find where he fully endorses this possibility but I’m sure I’ve read so since this date. Who knows? Myself I think this is an outlier opinion anyway.
https://wattsupwiththat.com/2013/08/05/the-sun-is-about-to-have-a-flipping-magnetic-field-reversal/
“Leif Svalgaard
August 5, 2013 9:22 pm
“davidmhoffer says:
“August 5, 2013 at 9:09 pm
OK seriously, what is the reason for the earth’s orbit becoming more circular?
Perturbations by the planets, mostly Jupiter [yes, the planets are driving our climate].
Peter S says:
August 5, 2013 at 9:11 pm
Is this change a relatively recent thing, (a few thousands of years), or is it part of a long term gradual change in cycle from elliptical to circular?
This takes place on time scales of 50,000 years and longer.
A paper with more:
“Science 23 August 2002:
Vol. 297 no. 5585 pp. 1287-1288
An Exceptionally Long Interglacial Ahead?
A. Berger, M. F. Loutre
“Today’s comparatively warm climate has been the exception more than the rule during the last 500,000 years or more. If recent warm periods (or interglacials) are a guide, then we may soon slip into another glacial period. But Berger and Loutre argue in their Perspective that with or without human perturbations, the current warm climate may last another 50,000 years. The reason is a minimum in the eccentricity of Earth’s orbit around the Sun.”
31
The eccentricity is not a huge player for descending into glaciation. The main driver is precession. Earth is already 400 years into the current cycle of glaciation. There will be clear evidence of that this millennium.
The tropical Northern Hemisphere will experience warmer autumns and the high latitudes cooler winters – ever more extreme for the next 12kyr and more extreme than now for the next 22kyr. Each year there will be more atmospheric water over the North Atlantic than now in August and September and will cool more rapidly through November and December. Snowfall becomes more intense. Ice accumulates. Some would say there are already early indicators of this cycle now apparent.
Ten thousands years ago, when the oceans were rising 1m per century, the latitude of London was getting 30W/sq.m more sunlight in June than the present time. And June sunlight over London will continue to fall for the next 10kyr. Glaciation of the land masses abutting the North Atlantic may not be apparent but it is already under way.
71
“It looks like we’re no more than 3 to 4 months away from a complete field reversal,” says solar physicist Todd Hoeksema of Stanford University. “This change will have ripple effects throughout the solar system.”
Blackouts to come maybe. ?
20
Thank you for digging that one up. As I suspected it’s really just within his range of possibles rather than a prediction. I’m going to go with the well-established observed cyclic trajectory given Earth tends to stick to long-term cycles for at least one more full cycle before fading into other meta cycles (and this one seems to be more that that), plus it’s defined by sediments and recent cores (and sediment maps and chronologies lie a lot less than individuals) so that graph will be more or less accurate enough to be a better than average guide to what happens next, on that cycle. I would say an almost guaranteed beginnings to a new glacial, within ~3,000 years. Just a misplaced confident guess based on that graph’s cycle path alone. Could happen sooner but unlikely to be later given the Holocene is already longer than most interglacials.
But obviously the UN will still be trying to convince everyone to give up Sovereign democratic governments and borders at that point to let them take-over everything with a proposal to save the world from cCrisis™, via the global-cooling-tax on the poor and a Global-Cooling Trading-Scheme for approved UN Delegates. So you own nothing, but know exactly who stole it. To benevolently fund a network of antarctic and mountain-ridge windmills powering giant copper electrical elements in the ice, which copper will be mined from the southern end of Uranus by NASA to melt the glaciers and keep everyone warm, plus to stop the tide going out 100 meters or so and wrecking the ocean-views of the UN Administrative Penthouse complex.
80
The Little Ice Age was when? I’ve seen claims for it starting around 1580/1600/1625 or 1645, and ending about 1710 (or 1855 in AGW folklore). I prefer about 1620 and an end in 1710 (a very cold winter in England and most, if not all of Europe) with notably warmer summers in the 1730’s. This seems to coincide with a time of few sunspots, indicating a less active sun, and starting with pronounced volcanic action.
There is another cycle we should consider, the position of the sun in its rotation around the galaxy. There is evidence for an ice age about every 130 million years approx. lasting 30-50 million years.
https://images.newscientist.com/wp-content/uploads/2011/11/28392301.jpg
So cheer up everybody, in about a million years we will be warm again.
40
Kinda disagree, ice-ages are defined by glacial growth and retreat conditions, and the un-doing of the glacial growth phased reversed globally from around 1815, so I think that marks a clear shut down of LIA conditions, perhaps as early as 1800 though as there would be some lag in the retreat process. The glacial retreat roughly got rolling ~210 years ago.
21
Two different ice-ages. My definition comes from the geological point of view that an ice age is when there is permant ice at (at least) one pole.
The Antarctic ice cap is said to have started 38 million years ago, or 32 or 25 or 14(restarted after earlier melt) 14 million years ago. Even so, the graph isn’t that good but I chose it because it avoided the extended timeline in the Paleogene.
Try http://www.buildart.com/images/Images2011/TIMELINE_FULL.jpg
There are difficulties with the idea in that the Permian had enormous volcanic action (Siberian traps) and the end Jurassic probably had only winter snow in Antarctica (at 2700p.p.m. CO2), but it does seem that there is some sort of cycle.
Re glacier retreat this was noted in 1745 for the Mt. Blanc glacier but that was changed when the glacier advanced again in the Dalton minimum, and it (but apparently not other Swiss glaciers) started retreating in 1838.
Some support for this is the Glacier bay (southern Alaska) surveys of retreat in the 1780’s onwards. Please note the glacier was grounded at the mouth of the bay in 1780 so warm water couldn’t enter the bay at that time.
https://web.archive.org/web/20160214051639/http://soundwaves.usgs.gov/2001/07/fieldwork2.html
30
We both understand what a geologically defined Ice-Age is, but nevertheless it was called the “Little Ice Age”, even though it obviously wasn’t. But glacial extension was the defining characteristic of that period. Nested in that geologically the defined ‘Glacials’ are described by sedimentary deposits and their timings. Just after 1800 seems to be the approximate end, the beginnings ~600 years earlier. And geologically the record would see that, in context, as nothing but a noise blip in the inter-glacial to glacial transition ice-age signal. Which is why I take none of this climate change stuff seriously, because Earth never changes the global climate by much, any faster than a ~500 year transition interval, usually a lot longer. Everything else is just noise within an LIA blip, which LIA blip was also noise, but on the Ice-Age’s signal.
40
‘Just after 1800 seems to be the approximate end …’
In the Southern Hemisphere the LIA came to a close near the end of the 19th century.
00
Lots of SUVs and coal power stations around then.
10
The Little Ice Age was when? I’ve seen claims for it starting around 1580/1600/1625 or 1645, and ending about 1710 (or 1855 in AGW folklore). I prefer about 1620 and an end in 1710 (a very cold winter in England and most, if not all of Europe. This seems to coincide with a time of few sunspots, indicating a less active sun, and starting with pronounced volcanic action.
There is another cycle we should consider, the position of the sun in its rotation around the galaxy. There is evidence for an ice age about every 130 million years approx. lasting 30-50 million years.
https://images.newscientist.com/wp-content/uploads/2011/11/28392301.jpg
So cheer up everybody, in about a million years we will be warm again.
30
Sorry about the double post. My first time comment seemed to have melted away.
30
There appears to be a fault in the system, now you see it, now you don’t. Its there on a different layer and hasn’t gone down a memory hole.
10
According to Hubert Lamb the LIA began in the 13th century and I fully support his hypothesis. Large icebergs in the North Sea are indicative of a change in the climate for the worse. North Sea storms also impacted Europe and Britain, with huge loss of life.
When these conditions return you will know where we are at.
60
Iceland was fiercely independent but sought Danish rule and help (without success) after 1220 . There was a famine in England in 1280 and the 1310’s were wet and miserable (the great dying of the beasts). The weather improved in the 1400’s lasting to 1580??
Hubert Lamb was an expert (and wrote) on Great Storms esp. in the North Sea. He linked them with climate change.
60
I think we need to clearly differential between real and natural, on-going changes in the climate…
.. and the fantasy of “Climate Change™” related to human release of much needed CO2 into the atmosphere.
I try to use the trade mark symbol whenever I mean the later.
Maybe just add the word “natural” in front when we talk about the real situation?
60
‘He linked them with climate change.’
The old trade routes to Greenland and Iceland were progressively cut off from around 1250, but to understand the mechanisms in play we should consider large volcanic eruptions as an extra variable, which drove us even deeper into the LIA.
In Britain and Europe there were good years and bad, but it was the cool wet summers which saw agricultural collapse and mass starvation. We know for a fact that sea level fell sharply around 1300, so this gives us a clear indication that glaciation was on the increase.
50
Its crunch time.
‘The pattern seems to have taken the form of frequent severe spells of winter weather and great year-to-year variability of the summers and harvests; these and more directly reported aspects of the pattern suggest an abnormally great frequency of blocking (with anticyclones over Northern Europe in latitude 60-70 N) …’ Hubert Lamb
51
There was the Oort Minimum from c. 1020-1050, followed by the Wolff Minimum c. 1280-1350.
The Wolff Minimum was followed by the Sporer Minimum 1460-1550 and then the Maunder Minimum: 1645-1715
The LIA (Little Ice Age) started with the Wolff minimum which was notable for its rain.
(very early 13th Century which prevented a battle. The French cavalry horses couldn’t get through the mud into Belgium)
The LIA ended around 1850 after the Dalton Minimum (1790-1830) encompassing Solar Cycles 4 – 7.
The coldest part of the LIA was from 1645-1715 which encompassed the Maunder Minimum.
I read somewhere that the Sporer Minimun was not a Solar sun spot minimum but the Solar System passing through a cloud of nova debris. Maybe.
The LIA is reputed to have run from 1290 to 1830.
A Research Team headed by Prof V. Zharkova has worked (see link 3 below) through the maths of the Sun Spot cycles and after using Principle Component Analyis they have determined the Sun is driven by two internal dynamos which are not exactly in step. They have predicted very low numbers of sun spots for cycle 26 when the two dynamos will be exactly in opposite phase to each other. Maybe that’s a real outlier. We will find out. Other predictions for cycles 25 (we have just entered cycle 25) and 26 are also for low activity.
(see
1. https://www.iflscience.com/environment/we-could-be-heading-mini-ice-age-2030/
2: https://electroverse.net/solar-cycles-25-and-26-will-be-very-similar-to-the-dalton-minimum/
3. https://astronomynow.com/2015/07/17/diminishing-solar-activity-may-bring-new-ice-age-by-2030/
)
NASA is expecting (or forecasting) a Grand Solar Minimum soon.
See also link #3 (Zharkova)
Think about the crop losses, rains, floods, volcanism etc etc during all those years of the Solar Minima: eg 1816: the Year Without a Summer. Mt Tambora and other Super Volcanoes.
Those Solar Minima can all be described by their disasters.
Here’s the prediction from Dr. Willi Dansgaard, back in 1970: it’s an ultra-long-range weather forecast taken from the Camp Century ice core by the man who invented Ice Core reading:
the climate will continue to grow colder during the 1970s and early
1980s; then it will become gradually warmer again so that by 2015 we shall
be back to where we were in 1960—no better; and after that it will start
becoming colder again. In short, the outlook for the next fifty years is
decidedly chilly.
He bases it on repeating cycles of change that he thinks fit closely with the ice-records of the past—in fact the combined effects of two dominant cycles, one giving peaks of warmth every 78 years and the other peaks every 181 years. Each of these cycles, Dansgaard believes, represents a regular variation in the Sun which affects its output of energy. Therefore he ventures to let the cycles run on a little way into the decades ahead.
Really Good News:
The really good news is that the planet’s magnetic field is weakening — rapidly. I understand it’s now down to about 80% of what it was. This means we are heading into a Geomagnetic Excursion. We don’t know how low the field will go, we don’t know when it will reach its nadir nor have we any idea how long it will last. Neither do we know what effects it will have on our climate. History says the stronger and deeper the excursion, the colder it will become.
We do know that Geomagnetic Excursions can be extinction level events. The best known GE is the Laschamp c.41,000 YA. It was a very strong GE, so it left it’s footprints around the globe. The planetary magnetic field dropped to around 5% during the entry and exit of the excursion. It remained at about 25% during the excursion. The Australian megafauna died out in the years leading into the Laschamp from about 43000 YA. Mt Toba had a few things to add at 39,000 YA, so it was a pretty rough time then.
You can be sure it won’t be Business As Usual through 2050 to 2100 … it won’t be caused by CO2. None of it. CO2 is plant food and apart from that, it’s just another atmospheric gas. It doesn’t cause much in the way of global warming. That’s Water Vapour. Over 70% of this planet’s surface is covered by water. Water Vapour is the only gas which carries the heat of its evaporation with it. There’s your warming. We are entering a period of cooling. Temps have dropped and the water vapour is condensing out of the air. Why have we had lots of floods? The water has to go somewhere …
Predictions for Solar Cycle 26 are for a lowering of the Sun’s output to around 60%, which will cause significant cooling but not necessarily freezing. However, if the Geomagnetic Excursion coincides with that, what will actually happen? Will they add and create freezing?
We are entering Interesting Times.
30
Thanks, a big but interesting read.
00
Thank you.
I did get one thing wrong: the Sun’s output is forecast to fall by 60% not reduce to 60% (a fall of 40%).
That’s going to be dark … and just a bit cool.
That seems to me to be just too extreme — I can’t see that happening because I can’t see how it will happen. But then again: when a huge star like Betelgeuse dims and brightens over months as it did over the end of last year and early this year through it’s own agency we’ll have to wait and see …
So with all that being pointed at us in the coming years, I can’t help but smile (or laugh) at all those who presume to predict ‘Global Warming’ through to 2050 and beyond to 2100. The Sun is most definitely not Steady State. When you base your predictions upon the wrong gas and try and freeze a cyclic agency into a steady state, then all the predictions fail. Yet they’re still wasting time and effort on the climate models … Oh Dear … How Sad … Too Bad….
Never Mind …
10
‘ … the climate will continue to grow colder during the 1970s and early 1980s; then it will become gradually warmer again so that by 2015 we shall
be back to where we were in 1960—no better.’ (Dr. Willi Dansgaard)
The great climate shift of 1976 saw a step change to warmer conditions, but apart from that a return to the 1950s sea floods and 1960s freezing conditions should eventuate.
00
At the start of the Wolf Minimum.
‘St. Lucia’s flood (Sint-Luciavloed) was a storm tide that affected the Netherlands and Northern Germany on 14 December 1287 (OS), the day after St. Lucia Day, killing approximately 50,000 to 80,000 people in one of the largest floods in recorded history.
‘This disaster was similar to the North Sea flood of 1953, when an intense European windstorm coinciding with a high tide caused a huge storm surge. The St. Lucia flood had a major influence on the subsequent history of the Netherlands.’ (wiki)
00
Volcanism was more than a bit player.
‘Here we present precisely dated records of ice-cap growth from Arctic Canada and Iceland showing that LIA summer cold and ice growth began abruptly between 1275 and 1300 AD, followed by a substantial intensification 1430–1455 AD. Intervals of sudden ice growth coincide with two of the most volcanically perturbed half centuries of the past millennium.’ (Miller er al 2012)
00
This might be the real start of the LIA.
‘In 1257, a catastrophic eruption occurred at the Samalas volcano on the Indonesian island of Lombok. The event had a probable Volcanic Explosivity Index of 7, making it one of the largest volcanic eruptions during the current Holocene epoch.’ (wiki)
00
Slightly off topic but… someone did say these things are prone to catching fire.
Gee it must have hurt the ABC to report this little gem. I hope nobody was hurt.
https://www.abc.net.au/news/2021-07-30/tesla-battery-fire-moorabool-geelong/100337488
60
Bob Tisdale followed Willis’ Greenland essay with more interesting temp data.
He found that there’d been no temp increasing trend line from 1925 to 2012. Using Berkeley.
It is also apparent that the 1900 to 2000 period ( 75 years) shows cooling, even after the AMO change to warm phase in the early 1990s.
See his essay and a number of interesting graphs etc and of course the absurd use of their RCP 8.5 MODEL by the warmists to bolster their dubious claims.
https://wattsupwiththat.com/2019/01/13/greenland-near-surface-land-air-temperature-data-from-berkeley-earth-present-some-surprises/
50
Sorry above should be 1925 to 2000, not 1900 to 2000. And cooling for 75 years is accurate.
10
UAH shows that apart from the 2015 non-human-caused El Nino event, there has been basically zero warming in the Arctic this century.
Even the effect of that large El Nino has all but disappeared
https://i.postimg.cc/85Gt0HqZ/UAH-Nopol-2021.png
60
I haven’t look at the following data but I’d imagine historic grain prices would give a strong indication of temperature over the Little Ice Age (i.e. if growing conditions were favourable or not).
http://www.iisg.nl/hpw/poynder-england.php
30
That was meant to be a reply to
Richard Owen No.3
July 31, 2021 at 8:26 am
20
Thanks.
Sir Frederick Herschell tried to link sunspots with wheat prices around 1805 (he used figures from Adam Smith).
70
Note Figure 9 graphics in the link blow, taken from Professor Will Alexander’s long record of South African and Egypt’s
river flow and from the World Data Centre for the Sunspot Index.
https://pielkeclimatesci.wordpress.com/2010/05/20/climate-change-the-west-vs-the-rest-by-will-alexander/
30
Edit. ‘below’.
10
That’s a good one.
20
Correlating food prices mainly with temperature is a risky game.
Food prices are also dependent upon other supply factors and upon demand, and demand was hit hard by the Black Death at various times during the LIA — depending upon what you define as the beginning and end of the LIA. Don’t forget that there were times when there was more food available than peasants to eat it after the great dying. The price of farm labour jumped and the price of food went through the floor on occasion. At other times the shortage of harvest labour made food more scarce. Things were variable depending upon when the plague struck.
For those heavily into starvation and plagues, here’s a history of English plague outbreaks and weather events that precipitated the disease outbreaks etc:
https://www.gutenberg.org/files/42686/42686-h/42686-h.htm#Page_180
Taxation and government interference in the grain market also played their part at various times (think renewable energy equivalent), a later example being the Corn Laws from 1815-1846 designed specifically to artificially inflate the price of grain to prop up the incomes of the landed gentry, and to hell with the starving common folk in the slums.
The Church with its historical 10% tithing laws played its part in the price of food too. Tithing didn’t officially cease until after WW1, although it fell into abeyance in the mid-1800s. Prior to the Dissolution of the Monasteries, the produce of tithing was a major player in the food market with the Church controlling so much land of its own, plus the tithes it gathered in (in kind) from all other land holders. I’m sure that if you were a corrupt abbot with a dominant share of the market and a captive customer base in your local towns and villages, you could rig the price to suit yourself.
Weather, disease and politics are inextricably intertwined into our history. The latter two are frequently, though not exclusively, shaped by the former. We live in extraordinarily benign and stable climatic times.
50
Sorry for being off topic but a module of a big Tesla battery outside Geelong is burning.
https://www.zerohedge.com/markets/smoke-australia-tesla-megapack-battery-catches-fire
https://www.smh.com.au/business/the-economy/fire-breaks-out-during-testing-of-victorian-big-battery-near-geelong-20210730-p58eh4.html
60
Wonder if they managed to stop it spreading.
That was all they could hope do.
Can’t put the darn thing out !
41
Also, you have to wonder how much damage was done to nearby units by all the fire retardants used to stop it spreading.
41
“Wonder if they managed to stop it spreading.”
The article says:
“Also, you have to wonder how much damage was done to nearby units by all the fire retardants used to stop it spreading.”
The Article says:
It may be a good thing they were just testing the battery at the time and it wasn’t under any actual load.
50
Yep, they have lost two units, close together.
There are a lot more units it could spread to.
40
Lets hope!
20
Of course Murphy had a hand, the one on fire is smack in the middle.
70
That’s going to be fuming for a while.
Clean, cheep, renewables.
No worries mate.
100
I Googled to see if it’s still burning but there’s no news meaning it’s out or the Enemedia won’t report the truth about one of their pet projects, built for no other purpose but to enrich the Elites.
The batteries are owned by French company Neoen whose only business activity is to invest in solar, wind and battery subsidy farms. It appears to have no useful economic activity, their business is subsidy farming only.
https://en.wikipedia.org/wiki/Neoen?wprov=sfla1
130
Keep us up to date with that blaze, if you would Yarpos.
Thanks in advance.
00
Also interesting to compare Vinther’s 2006 long instrumental record of Greenland? This is a very long study over 200 years and co-authors are prominent alarmist UK scientists Dr Jones and Dr Briffa.
BTW Dr Jones has since retired and Dr Briffa has passed on.
Looking at temps over this long period we find that much earlier decades are warmer than the last few decades and they even hold up well against some of the decades over one hundred years ago, back in the 1800s. See TABLE 8.
So what will be their excuse when the AMO changes back to the cool phase, perhaps sometime in the 2020s? Who knows?
https://crudata.uea.ac.uk/cru/data/greenland/vintheretal2006.pdf
See TABLE 8 from the study comparing decades.
40
Also Willis’ so called “where’s their climate emergency” essay also finds SFA to be concerned about for Greenland or Antarctica.
In fact Antarctica hasn’t warmed for 70 years according to the latest NATURE study.
And like Dr Humlum he finds no recent change in SLR at the tide gauges. DUH.
I think the Biden donkey should think again about his so called EXISTENTIAL climate threat.
I mean why waste endless trillions $ on a NON PROBLEM and rely on RELIABLE BASE-LOAD ENERGY for the foreseeable, PROSPEROUS future.
https://wattsupwiththat.com/2021/04/25/wheres-the-emergency/
60
Sea levels have not moved in my lifetime.
Locally the tide can range over 1.6 metres during the month so anything coming from the Fort Dennison records of sea level change is effectively irrelevant.
Everything is steady and the poles are certainly not melting.
60
I agree.
Port Phillip Bay (Melbourne) has shallow edges and is mostly built around. No one has lost a house, or even a front yard to sea level rise in my life time (68).
40
1868?
10
Both Fort Denison and the Bondi Surge pool show a basically constant sea level of around 1mm/year, with high tide rising at around 0.75mm/year and low tide rising at about 1.3mm/year.
Range is around 2m from low to high.
This is a truly scary rate of sea level rise… according to someone, somewhere. ! 😉
There is absolutely no sign of any acceleration due to mythical man-made warming or from melting of Greenland and Antarctica.
20
Fremantle has a steady increase of 1.7mm/year for more than 100 years.
10
Not sure if I’ve got it right but if I remember correctly, a period of warming to drive moisture into the atmosphere for snow to form, is needed to kick off into a glacial period.
30
Great analysis Ken. What a shame that this article isn’t published in all the legacy media today. Its based on real historical data, so those pesky fact-checkers shouldn’t really veto it. I see Angus Taylor’s at it again. He and Brandis just signed some cooling pact with the UK, which I am sure will be really effective (sarcasm button off).
80
At best a hypothesis, I’m afraid. Which makes it equivalent to anthropogenic climate change.
40
Copy that.
00
Actually, not a cooling pact. I should be more accurate A pact to guide investment toward ” low emissions technology” between UK and Australia. Either way, probably some useless tax investment in hydrogen and CCS. Along the way they will sucker in some corporates to contribute so that they can then make some of those TV ads with virtual signalling. If you watch the Tokyo Olympics at the moment there’s endless Coles and Telstra ads showing wind turbines, solar panels and then claims for “Net Zero” by 2025.
60
I would love to know what KWH an average Coleworths would use what with refrigeration, air conditioning and lighting, and they think they will be CO2 neutral in 4 years time, LOL
50
And Greenland’s close neighbour Iceland (1,200 klms) has been cooling for the last 8,000 years.
The only time it has been colder than today is in the 1800s or the LIA. Also more ice today compared to that long period except the LIA.
https://notrickszone.com/2020/12/14/modern-icelands-climate-is-colder-with-more-ice-than-any-other-time-in-the-last-8000-years-except-the-1800s/
91
The current glacial episode began in 1585. That is the last time, this precession cycle, that perihelion occurred before the austral summer solstice. The top of atmosphere insolation over the oceans has been in decline since then. There is more sunlight in the Northern Hemisphere but less in the Southern Hemisphere, which dominates the ocean surface area.
The tropical North Atlantic is getting more sunlight in August through October thereby getting more water into the atmosphere after the boreal summer. We should expect to see more cyclonic storms in the North Atlantic in August and September. The boreal winters are becoming longer and colder as the time of aphelion moves closer to the boreal winter solstice. The Northern Hemisphere will experience greater extremes – warmer summers and cooler winters for the next 22kyr. By then, the next glaciation stage will be through the first period of rapid glaciation and will take a short pause or even slight reduction in land ice.
Ten thousand years ago, when sea level was rising 1m per century, the sunlight over London was 30W/sq.m more than it got this June. The tropical North Atlantic was not getting any more sunlight than this year. Melting was trumping evaporation. In 3,000 years the sunlight over London will be 2W/sq.m down on today in June but the evaporation in the North Atlantic through August to October will double what it is today. Some of that water will end up on land and it will not melt the following year. That is the process of glaciation. It is a result of increasing extremes – hotter autumns in the tropics and cooler winters at high latitudes intensifying snow fall. Holland will again see frozen canals. The other bonus for Holland will be the falling sea level increasing the land area.
The chart in the post is interesting because early glacial episodes were a single precession cycle of 23kyr length. About 2Myr ago the glaciation cycles expanded to 3 or 4 precession cycles. The significant change 2Myr ago was the formation of the Panama Isthmus. Prior to that time, the tropical Pacific and tropical Atlantic were connected.
Another fact related to the global distribution of surface water is that the North Atlantic is a warm basin. Half of the surface area is south of 33N. Meanwhile the South Atlantic is a cold body – a reason Brazil does not get many tropical storms despite being in its warmest period in thousands of years. Since 1585, the tropical North Atlantic has been getting increasing sunlight, creating the conditions for glaciation, while the tropical South Atlantic has been getting less sunlight – that could be the precondition for the South Atlantic cooling that pulls the North Atlantic out of glaciation in about 100kyr. Or recovery from glaciation could be the dust build up as northern land masses become treeless and atmospheric dust build ups, increasing the light absorption of the ice.
The long term trends in top of the atmosphere sunlight are small. Since 1585 the average insolation over northern oceans has increased by 0.1W/sq.m while the insolation over the southern oceans have reduced by a similar amount. It does not seam much but each year the solar energy available above the oceans has declined by 1,200,000 Hiroshimas. Equivalent to having 6 Australian bushfire seasons fewer EVERY year.
Why are oceans heating? Well they are actually cooling slower than they were when sunlight over oceans peaked. The reduced insolation lowers net evaporation rate so the ocean thermocline steepens; increasing average temperature of the upper 2000m from about 4C to 4.06C in the last 65 years.
Australia is getting less sunlight in summer and more sunlight in winter. But expect reduced precipitation meaning inland temperatures will be warmer in summer.
60
‘ … that could be the precondition for the South Atlantic cooling that pulls the North Atlantic out of glaciation in about 100kyr.’
Hmmm … too big a picture. Has a mini ice age started?
10
The current glaciation cycle is in progress although I have not been out to ask the glaciers. They probably have mixed views right now.
In the short term, 2020 had more sunlight over oceans than all years since 2001. It will be 2061 before there is more sunlight over oceans than 2020.
Since 1600, 1736 was the year of most sunlight over oceans. However the Northern Hemisphere has been getting more sunlight and the Southern Hemisphere less sunlight in long term trends since 1585. 1607 was the lowest sunshine year in the Northern Hemisphere since 1600. Southern Hemisphere peaked in 1617 and has declined since. Northern Hemisphere will reach its peak sunlight this century in 2096; just 0.005W/sq.m over 2020 but 0.15W/sq.m more than the lowest in 1607. Seems tiny but that drop amounts to 7.6E20 joules difference in ToA insolation over the year; or 13M fewer Hiroshimas in 1607 compared with 2096 just in the Northern Hemisphere. That many Hiroshimas over that tiny hemisphere has to be felt!
As I noted in the earlier posts, the Northern Hemisphere is heading to more extremes while the Southern Hemisphere is less extreme but also lower precipitation.
In the next 5 years, global insolation (W/sq.m) over water is down from 2020 as follows:
2021 down .0145
2022 down .041
2023 down .014
2024 down .033
2025 down .015
2026 only down .005
So the trend in sunlight over oceans is down from where it was in 2020 in the short term. 2022 is substantially down – about 8M Hiroshimas down from 2020.
I have not yet got a handle on the thermal differences that drive El Nino but I expect a good place to look is the tug-of-war for air convergence between the Gulf of Mexico and the tropical Pacific.
Latitudinal changes in insolation can be much greater than the tiny values globally. March insolation at 5N was 0.5W/sq.m up in 2020 on what it will be in 2022. But September will have more sunlight at 5N in 2022 than 2020. In fact the last time Southern Hemisphere insolation was as low as 2022 was 2011!
It is clear that orbital changes have significant impact on ToA insolation. Glaciation is easy to grasp as it is a simple competition between rate of evaporation and rate of melt. El Ninos a bit more subtle.
If ToA insolation over water was the only thing that mattered, then both Northern and Southern Hemispheres will be a tiny bit cooler in 2022 than 2021. 2027 and 2030 should tie for the lowest temperature this decade. 2026 should be the warmest despite having a little less ToA insolation than 2020. The temperature depends on the latitudinal changes as well as the total amount.
As far as mini ice age, I think that has more to do with year-to-year variation and hemisphere-to-hemisphere differences than trends. For example,
40
Thanks Rick
Warmer ocean will bring increased snowfall. The positive feedback as snow/ice land area grows means those areas will be relatively colder and will cause greater snowfall. But a slow process.
Ken
100
Very slow, immeasurable even. Much too slow for the UN and governmental agencies plus taxation commissioners, weather bureaucracies and trading scammers to get excited about. Somehow I think they’ll be sticking to a carbon-is-evil narrative, even if we got another mid-1970s cooling cycle by 2040. That would just be evidence that the climate change crisis is real.
30
The proxy used for sea level shows changes as high as 2m per century – 200mm per decade. That would probably be noticed and fall will begin this millennium.
10
During the most rapid phase of falling into a deep freeze world, yes.
But glacials begin very slowly, not much happens in the first 3,000 to 5,000 years, the transition accelerates thereafter. When I say ‘accelerates’, I mean over a 1,000 year period three times as much change is occurring. I do not mean sooner. In other words, don’t expect noticeable global climate change any time soon. The LIA seems to be a clear early downstep of that glaciation onset process though.
What we will see much sooner is that the periodic decadal warming and cooling phases (weather-cycle noise) will get deeper in coldness and not get as warm as now, and the warming phase will get shorter.
Many people later this century will call that evidence of the onset of a glaciation, but it isn’t. The evidence of that will be glaciers accumulating across Siberia and the Canadian Shield. That will take a very long time to develop. Earth’s climate transitions are horrendously slow, the planet is vastly older than the average google user can possibly comprehend. Weather observers have no clue at all, geology makes very clear that 30 years does NOT amount to significant climate change – it’s nowhere near significant to measure global climate-change trend.
Which climate transition to a glacial I think is clearly underway over the past 3,000 years, but it can easily take longer than humanity has time left as a modern connected global civilization, obliviously twittering about it every day in terms of figments, about something they will never see occur.
00
Ken,
I produced the attached paper that I did not distribute widely because I am not yet happy with the need to involve dust to pull out of glaciation:
https://1drv.ms/b/s!Aq1iAj8Yo7jNhEUPzdLmLlSCh3_I
My main learning from this paper was that the North Atlantic is a warm basin. Not in the same class as the Arabian Sea and Bay of Bengal but it has 50% of its surface area below 33N. By contrast the South Atlantic is a cold basin with very narrow equatorial zone compared to the length of the Southern Ocean zone. It is known the South Atlantic warmed considerable when Drakes Passage opened about 20Myr ago.
Since preparing the linked paper, I learnt the the Panama Isthmus has only been above sea level for the last 2Myr. That is when the glaciation moved to the multiples of the precession cycle rather than just following the precession cycles.
What I am trying to do now is work out how the South Atlantic could hinder tropical evaporation and allow melting to dominate over snow fall. There is some evidence for the dust changing ice absorption but I think there may be another mechanism.
50
At the LGM Australia was a dust bowl, with dunes reaching the Great Dividing Range. With deglaciation the skies cleared up.
https://theconversation.com/two-centuries-of-continuous-volcanic-eruption-may-have-triggered-the-end-of-the-ice-age-83420
10
Glaciation is predominantly ice accumulation on the northern land masses above 50N and is an energy intensive process. South Atlantic definitely goes cold during glaciation as does the abutting portion of Antarctica. The tropical North Atlantic also drops to temperature consistent with low evaporation rate, which has nothing to do directly with ice absorption. High ice flows into the Atlantic may cause cooling but I consider that less likely than cool currents from the South Atlantic to the North Atlantic. I am yet to look closely at the temperature in the South Atlantic through a precession cycle other than knowing right now it is as close to as warm as it gets with the present eccentricity and eccentricity is reducing for a while yet.
The loss of plant growth in Australia is most likely due to the starvation levels of CO2 and the fact that the Southern Hemisphere is in a cool phase with low atmospheric moisture in the Southern Hemisphere when glaciation is in its rapid phase with water level falling.
There are papers that detail the high dust levels across Asia toward the end of glaciation. However I am not convinced yet that dust is the only way out of glaciation. I can get close to reproducing the cycle without changing ice absorption.
While precession dominates, the recent cycles also have an eccentricity signature with glaciation occurring during reducing eccentricity and deglaciation occurring during rising eccentricity but both situations are kicked off by the precession cycle at their onset. The present precession cycle effectively began in 1585 and eccentricity is now reducing. Now about 450 years into 12k years of rapid glaciation, level off and then more with ups and downs for about 100k years. I have not gone further than 50kyr forward from the present.
30
I can understand the basic elements of all that, but putting them together time wise is way out of my reach.
Fascinating.
10
Thanks Rick. I’ve read paper(s) on dust contributing to deglaciation but not convinced either. I’m more interested in glacial inception. Your model seems impressive compared with results of the usual suspects. I expect the world will see more large fluctuations like MWP – LIA as cooling progresses. The second graph above shows the Holocene roughly compares with the end of the Eemian (LG1) in fluctuations.
10
There is no evidence to suggest that winds carried Australian red soil to Antartica.
If we put a large canal at the Isthmus and allowed Pacific waters to flow into the Atlantic, the Arctic would melt and the ice age era would come to an end.
00
I think that theory is bunk Gordo, the circum-polar circulation of the Southern ocean is 45 millions years old, by far the more significant global ocean flow and southern hemisphere influence.
00
The formation of the Isthmus changed the world.
‘Evidence also suggests that the creation of this land mass and the subsequent warm, wet weather over northern Europe resulted in the formation of a large Arctic ice cap and contributed to the current ice age. That warm currents can lead to glacier formation may seem counterintuitive, but heated air flowing over the warm Gulf Stream can hold more moisture. The result is increased precipitation that contributes to snow pack.’ (wiki)
10
I did not know that this was relatively well known. It is not something that climate models consider.
10
There is no Arctic “ice cap” Gordo, only the Antarctic has an “Ice Cap”. Greenland has a much smaller icecap, but the arctic itself has no icecap at all, there’s only very thin sea-ice. Other than Greenland there is currently almost no glaciation left in the northern Hemisphere. But the southern hemisphere has not left the glaciation. Interglacials are very much a northern hemisphere thing.
00
That’s big.
20
We shouldn’t forget that forests grew in the earlier WARMER HOLOCENE and here is more evidence from Iceland and other areas.
These old tree stumps are found in many places in the NH and the 2000 MacDonald study also found evidence of Boreal forests across nth Russia that grew to the Arctic coastline, but today that area is just tundra and ice.
Here’s the link to the recent Stein study etc from Iceland.
https://wattsupwiththat.com/2021/07/12/melting-glaciers-revealing-ancient-tree-stumps-from-a-warmer-period/
11
Here’s the 2000 MacDonald study that found that boreal forests advanced to the Arctic coastline from about 10,000 to the retreat by 4,000 to 3,000 BP. Of course this area is much cooler today.
This early Holocene area was much warmer than today or about 2.5 c to 7c warmer. See the abstract below and the link to this International study.
https://epic.awi.de/id/eprint/4164/1/Mac2000c.pdf
“Radiocarbon-dated macrofossils are used to document Holocene treeline history across northern Russia (including Siberia). Boreal forest development in this region commenced by 10,000 yr B.P. Over most of Russia, forest advanced to or near the current arctic coastline between 9000 and 7000 yr B.P. and retreated to its present position by between 4000 and 3000 yr B.P. Forest establishment and retreat was roughly synchronous across most of northern Russia. Treeline advance on the Kola Peninsula, however, appears to have occurred later than in other regions. During the period of maximum forest extension, the mean July temperatures along the northern coastline of Russia may have been 2.5° to 7.0°C warmer than modern. The development of forest and expansion of treeline likely reflects a number of complimentary environmental conditions, including heightened summer insolation, the demise of Eurasian ice sheets, reduced sea-ice cover, greater continentality with eustatically lower sea level, and extreme Arctic penetration of warm North Atlantic waters. The late Holocene retreat of Eurasian treeline coincides with declining summer insolation, cooling arctic waters, and neoglaciation. © 2000 University of Washington”.
50
OFF TOPIC BUT IMPORTANT
https://www.dnaindia.com/science/report-vaccinated-people-may-spread-covid-19-at-the-same-rate-as-unvaccinated-says-leaked-us-data-2903404
Vaccinated people might spread COVID-19 at the same rate as unvaccinated, says leaked US data
DNA Web Team | Updated: Jul 30, 2021, 06:55 PM IST
Leaked unpublished data in US reveals fully-vaccinated people may be spreading COVID-19 at the same rate as unvaccinated.
With COVID-19 cases surging in the US, a leaked, unpublished internal government document has revealed explosive information regarding the virus.
As the highly transmissible Delta variant spreads across American stories, the document from US Centers for Disease Control and Prevention has revealed that COVID-19 spreads as easily as chicken pox.
Furthermore, the CDC document, which is a presentation, highlights unpublished data showing that fully-vaccinated individuals may be as spreading the Delta variant at the same rate as unvaccinated.
As reported, CDC Director Dr. Rochelle Walensky has confirmed to The Washington Post that the document is authentic. She told CNN, “I think people need to understand that we’re not crying wolf here. This is serious. It’s one of the most transmissible viruses we know about. Measles, chickenpox, this — they’re all up there.”
The US CDC will be publishing data that will support the controversial move in the US to update the COVID-19 guidelines for full-vaccinated people, which includes wearing face masks, even indoors if in a place where there are chances of contracting the COVID-19 virus like schools and workplaces.
She stressed that extreme measures were needed to get the virus under control.
The infectious Delta variant
While the original COVID-19 variant would spread as much as a common cold, the Delta variant is nearing the contagiousness of chickenpox.
The CDC presentation says the Delta variant is about as transmissible as the highly contagious disease of chickenpox. It suggests that infected person spreads the virus to eight or nine others people on an average.
SEE LINK FOR REST
40
Since the Little Ice Age did not trip the earth into an ice age, perhaps not enough stones were lined up for the ice to march across the northern hemisphere again, I’m rather taken with Robert Felix’s triple dynamo theory which adds another influence to consider.
This is where the shifting intersecting magnet planes of earth, solar system and galaxy are the cause of earth’s partial and full reversal of the poles. The resulting electromagnetic changes on earth cause massive volcanic output resulting in dim skies (cold atmosphere) and warm ocean surfaces substantially increasing precipitation (now snow). Since the mid 1800’s the north pole has been marching across in a relatively straight line with an associated increasing decline of the magnetic field on earth.
He cites Wyoming mass Dinosaur graves and still edible mammoth frozen meat as evidence that previous moves to colder climes happened very suddenly, maybe in a season or two.
Now, combined with the solar minimum we are just entering……
One of his books was recently updated in e-book format – https://iceagenow.info/
40
“He cites Wyoming mass Dinosaur graves and still edible mammoth frozen meat as evidence that previous moves to colder climes happened very suddenly, maybe in a season or two.”
Har … just made think … Canada could suddenly be covered with a mile high glacier tomorrow and they’d still blame it on AGW.
Also, I thought the mass dinosaur die offs were blamed on asteroid strike these days. Oh wait … asteroid extinction will be blamed on DJT and his selfish followers who refuse the vax.
Sorry, I just woke up to another day in Clown World.
40
Don’t even kid about Canada being under a mile of ice …. as it is we get 9 months of winter and 3 months of poor sledding.
Usually June July & August are the only snow free months in my neck of the Great White North (Calgary Alberta).
30
“still edible mammoth frozen meat “
umm.. can I say, “No Thanks” to that !
50
It’s a mammoth undertaking, without the right sauce.
30
… ketchup just doesn’t make it …
30
Wonder what the methane content of the atmosphere was in mammoth days?
Mammoth hunting as prehistoric demethanization.
To stop sea level rise coming out of the Ice Age and save the ice sheets?
10
Re mass Wyoming dino graves. The Howe Quarry in Wyoming doesn’t need no deep freeze to kill the dinos. They got trapped in mud and couldn’t get out.
“Judging from the contorted angles of their skeletons, the deaths of these animals were neither quick or painless. Some of the Sauropods were found upright, their heavy legs standing tall like columns, stuck in the ancient mud. It seems these dinosaurs survived a flood, but then were mired in the mud after the waters receded”.
From The Rise and Fall of the Dinosaurs by Steve Brusatte. Page 135.
20
Just for interest, I took yearly “UAH NoPol” data and attached it as well as I could to Hansen’s Arctic data from before when his salary rely on the AGW scam.
https://i.postimg.cc/26fgkpXm/Arctic-hansen-UAH.jpg
Note, zero line of UAH data needed to be at 0.3ºC on Hansen’s data to make the graph sections link together. Vertical scale is same on both sections.
As you can see, apart from the 2016 El Nino/Big Blob peak, temperatures are cooler now than the late 1930s/early 1940s.
31
Note also , that the warning trend from 1980-2016 is far less than from 1920-1940 or from 1880-1940.
31
If the proponents of man made Global Warming really think we can change the behaviour of an entire planet with tiny amounts of CO2, then we should be planning now to stop the cooling?
Perhaps we could output excessive amounts of CO2 and pray that they stay in the atmosphere long enough to stop runaway rapid Armageddon cooling and the relentless advance of the glaciers which will literally wipe most countries off the map. We are probably already at the tipping point for rapid decline as the current warming has ended. Time is of the essence. We need to subsidize the use of fossil fuels.
60
Macro VS Micro. Relatively easy to see trends between Ice Ages, but what about trends within the glacial cycles? Currently we have heat sinks over the USA and, to a lesser extent, Australia. These are MICRO trends in the interglacial cycle. In 50 years time it could be the reverse. Are we coming to the end of an intra-glacial warming period? Not enough evidence, although CO2 levels have nothing to do with it.
30
You’re thinking of Interstadials, a slight warming for a few thousand years and then plunged back into glacial conditions. Further reading on these cycles look at DO Events or Bond Events to illustrate the vagaries of the system.
00
How is plan X and theory N or whatever they were coming along?
02
We still have a year up our sleeve.
00
Gee Aye must be an Ed Wood fan. Plan 9 from outer space…makes as much sense as the theory N Gee Aye is raving on about
00