Paul Syvret seems to be hoping no one will notice that he doesn’t even try to respond to arguments about wind turbines. His technique to avoid debate is to decree that some other people were wrong once on a different topic. They used a rapid fire technique called a Gish Gallop, so therefore, thusly and henceforth anyone with a rapid fire technique can be dismissed with a handy wave of The Gish. It’s just another label in Syvret’s all-purpose excuse-list for not having a grown up conversation.
Those who have no evidence just make things up and toss insults. Syvret of The Courier Mail defends the wind industry from its critics — not with data about windfarms, but with allegations of imaginary astroturfing and denialism. He uses all his biggest scientific words: it’s “a barrage of BS”, “pseudo-science”, and a crusade run by a rat-bag in an incestuous network. He wants to make sure his readers know the critics are shills and conspiracy nutters because, well… he says so.
The Australian Environment Foundation is his main target today. What’s it guilty of? Well, it links to unpaid bloggers that Syvret doesn’t like: those ” sites promoting climate-change denial (such as junk science queen and conspiracy theorist Jo Nova) .”
It’s guilt by association, and three bonus mistakes in one sentence: Syvret can’t name any science the “deniers” deny, any “junk science” on my site, or any conspiracy theory I promote. Not firing blanks are we Paul?
Spot the real conspiracy theory
Syvret is convinced that money drives skeptics and unnamed “vested interests” conspire with the IPA. He has exactly no evidence to back this up. I don’t think he’s noticed though.
He thinks the critics of windfarms just pretend to be “grassroots”. As if no rational citizen could possibly object to wind towers even though they are expensive, unreliable, and don’t make any difference to CO2 emissions. Indeed any sane Green ought to object to them because there are far better ways to reduce CO2 (if only it mattered). If you care about the environment, wouldn’t you want the green-money spent on something that worked and didn’t kill quite so many bats and birds?
Unlike him, I don’t need to invent conspiracies — I can just talk about systematic flaws and quote studies.
Wind powered electricity costs 2 – 3 times as much as coal fired electricity (Victorian Auditor General).
$250 billion a year is invested into renewables each year (UNEP). Doesn’t that count as a “vested interest”? Or is “vested interest” just another insult to be tossed, rather than two English words to convey information?
But now I’m just Gishing aren’t I? Too many points, and Syvret can wave The Gish, and 6 million raptors and bats will be grateful. Spared the slicing and dicing thanks to his neutralizing logic.
Now maybe wind farms are getting better at not killing bats and birds; I hear they are improving. And there may be a role for towers in remote areas, or in the future. Perhaps we ought be spending more researching them. But Syrvet’s response to the cost-benefit analysis is essentially to say “You are a paid astroturfer and mentally deficient nut.”
This is not the kind of reasoning that Western Civilization was built on.
Can anyone name a wind project that doesn’t need forced payments from taxpayers to survive and which reduces CO2 emissions in the grid it works in?
If one such “farm” exists, how much it will cost to reduce world temperatures by 0.1 degree with that technology, rounded to the nearest trillion?
Move along here, there’s nothing to see
Is Paul Syvret just another victim of sloppy language and one-sided research? Did he fall for the “denier” label and assume he didn’t need to meet a skeptical scientist, or even read their blogs?
Name-calling bites the name-caller: brain off, parrot-mode engaged — pass along the abuse. He reflexively reeled off “climate change denier” without even investigating the words, let alone the targets — can he name a single person who denies the climate changes? Who is that strange soul who thinks the Earth was once a perfect constant global 15C.
Name-calling serves a diversionary purpose. Some unwitting readers (like Paul) will write the targets off without even hearing their point of view. If you have a megaphone, insults will work for a while. But skeptics have a megaphone too. No wonder thousands of readers are turning off the junk journalism and shifting online to where the real debate is.
Has journalism become a theatre-of-therapy? It’s almost as if Syvret has projected all his own failures onto his opponents. Within the one article, lies the baseless conspiracy theory, the loopy logic, and the urge to whip up loathing in the rent-a-rage crowd. Who is the denier here?
During the northern winter, there were more speculators in the carbon market than genuine players.
Those bankers must be very concerned about the environment.
Speculators main buyers in EU carbon auctions -report
17 May 2013
LONDON, May 17 (Reuters Point Carbon) – Banks and trading houses bought more than two thirds of the 138 million carbon permits sold by 25 European governments between Nov. 2012 and Feb. 2013 to help power plants and factories comply with the EU Emissions Trading Scheme, an EU Commission report published Friday showed.
Six “credit institutions” and six “investment firms” dominated the 35 auctions held over that period, picking up as much as 80 percent of the allowances sold in January alone, the report said, adding that only one of those companies was eligible to bid on behalf of clients.
Things have changed in the carbon market. From 2005-2012 most allowances were given away free, but now they are being sold at auction. So the period starting Nov 2012 was probably the first sales under the new system. It is expected that the bankers and traders will sell the permits to the power companies in the futures market.
You’ll have to click to go to the Domino site to see the helpful man tell you that “This is Big”.
They probably paid a lot for that ad.
Some of the poor users are not sure what it means. That’s OK, Domino helpfully provides an FAQ page:
Is it the same sugar? Will it function the same way in my recipes?
Yes, it is still 100% pure cane sugar with 15 calories per teaspoon. And, it functions just like all Domino®Pure Cane Granulated Sugar. Use it cup for cup exactly like the original Domino®Pure Cane Granulated Sugar.
Look out. You might think that carbon free sugar would be the ultimate diet-sugar. But it’s not so. Carbon free is not low-calorie. Lucky it is still useable at high temperatures “just like” normal sugar, eh?
Just so everyone can appreciate this special-chemistry-moment: in the sugar molecule below, the grey circles with a “C” are the carbon ones.
A glucose molecule. C stands for Carbon.
…
Remember the low-carbon crowd that this product appeals to are the ones who think they have science on their side.
To get certification this meaningless takes time:
“In order to earn CarbonFund.org’s CarbonFree® certification, Domino® Sugar products were put through a comprehensive, six-month certification process.”
Christopher Essex has been entertaining people with it for ages and points out that when your chemistry is this loose anything is possible.
He writes:
If you can have oxygen free carbon dioxide it is only a small step to having carbon free sugar. You could replace the carbon by, say, silicon from which one might get some kind of abrasive or just take all the carbon away and get water. So next time you drink pure water think of carbon free sugar.
Colleague Juan replies: “Perfect! if you can remove oxygen from carbon dioxide, and carbon from sugar, why not carbon from coal too?…”
The propaganda takes over people’s understanding of science, the advertising gradually erases what they were taught at school, and the population gets that much more confused. The brand-name of science becomes just that much less useful.
The environmentalist movement is attempting a … con. They are stealing the terminology of science to provide cover for an irrational, unscientific fear of industry and technology. And so while they loudly claim to be the tribunes of science, they actually play to and rely on the public’s ignorance of science.
“Get that carbon out of my food!”
Stephen Harper posted a study on this site in 2011, which showed (rather savagely) how effective the propaganda machine has been in undoing all those years of chemistry at school. He randomly asked 100 people in the street and the results show the sugar “carbon free” advertising might work.
… 37% of people are so convinced carbon is pollution that they think it would be a worthwhile aim to reduce the carbon content of their body. (The ultimate diet, you might say).
About a quarter of the population… would rather not eat food with carbon in it.
Nearly half the population think food would be safer without carbon.
I see WUWT had a post on Domino in 2009. It’s been around.
Here are the questions Tony Jones could have asked if only he or his billion-dollar organization had the time to use the Internet. Is he a journalist or an activist pretending to be one?
And how much does Jones get paid by the taxpayer for allowing McKibben a free pass to say things that are easily shown to be false? The ABC wants to keep that a secret. It wants your money, but not your opinion.
The full transcript is on the ABC site, I’ve selected parts below. (My cost to the taxpayer: $0).
TONY JONES: Let’s start with the statement most frequently used by climate change sceptics: the planet has stopped warming since 1998 and started to cool, actually cool, since 2003. True or false?
[Tony Jones is offering a blatantly false position for McKibben to knock over…. skeptics most frequently point out that there has been no significant warming (there are 350 million google results for that compared to 10 million for global cooling since 2003). The UK Met office, and the head of the IPCC say the same thing. The issue that matters is the “pause” that the models didn’t predict. In 2008 NOAA said that pauses of 15 years or more didn’t fit with climate simulations (so if it went longer, we would know models are wrong). The umpire here is awarding a free kick to start the game. – Jo]
BILL MCKIBBEN: Completely false. The data is unfortunately abundantly clear here. Not only is the air temperature continuing to go up, but a whole slew of studies in recent months have shown that in fact the rate of warming in the oceans is accelerating….
WHAT TONY JONES COULD HAVE ASKED: Bill, you say air temperatures are still warming but records from all five major datasets show no significant warming for a decade and a half. That’s RSS, UAH, Hadley in the UK, NCDC in the US, and NASA GISS. Even the UK Met Office and Rajendra Pachauri agree.*
And when you talk about the ocean, isn’t it true that the new ARGO system which started in 2003, and finally measures ocean temperatures accurately for the first time, has not found much warming at all, indeed it’s found nothing like what the models predicted it would find, and the small amount that has occurred could be statistical noise. And there is, in this short record, no sign of acceleration even though China has been pouring out record levels of CO2.
The warming of the oceans is nothing like the predictions of the models. (With the priviso here, that the error bars are so large they’re practically marked in “white”). The models are exaggerating.
BILL MCKIBBEN: …We’ve barely – we’re not even quite raised the temperature a degree so far and look what we’ve done. I mean, 80 per cent of the summer sea ice in the Arctic is now missing, the oceans are 30 per cent more acidic than they were 40 years ago, and because warm air holds more water vapour than cold, we’ve loaded the dice for drought and for flood which y’all in Australia have seen more than your share of in recent years.
WHAT TONY JONES COULD HAVE ASKED: Yet Antarctic sea ice has hit record highs. Ocean pH measurements are even more uncertain that ones on ocean temperature. A “30%” range on a logarithmic scale is not as significant as it sounds, especially when ocean pH varies naturally by that much each day in some places, and many corals and fish seem quite capable of adapting. As far as drought and flood go, Australia has always had both, there were waves of 50-plus temperatures right across Australia in the 1800’s. Most climate scientists admit there is no concrete evidence at all that current floods and droughts or storms are on the increase, let alone that it’s caused by CO2?
What caused these 50+ days in the 1800’s? Not CO2.
TONY JONES: Let’s just look at that figure though. 1998 was pretty much the planet’s hottest year, at least some argue that it was, since accurate temperature recordings were done. It appears there was a spike in that year, a spike in the temperature and since then temperatures have actually gone down?
BILL MCKIBBEN: No, temperatures haven’t gone down. The last decade was the warmest by far on record. 1998 was a very strong El Nino year and so it set a new record, a record we’ve now broken twice by small margins, but in general the pace of climate change continues unabated….
WHAT TONY JONES COULD HAVE ASKED: But when all the major land databases don’t show any warming, and the ocean warming is too small to be sure it is significant, what are basing your “unabated” claim on?
TONY JONES: Is the clear picture that you’re painting, was that muddied somewhat by the new research from the team of Global Change researchers published this week in Nature Geoscience that the rate of global warming is actually slowing…
BILL MCKIBBEN: It’s hopeful news in that they say the odds of warming at the very upper end of the scale are less than some had feared. Let’s hope that’s true. It really would be one of the first breaks we’ve caught from physics, but as they say in the thing – in their paper, it makes no difference to the plight of the planet. Two degrees where we’re going to clearly go well past on our current path is utter catastrophe. Really one degree is utter catastrophe. How many more summers do you really want like the one you just had?
WHAT TONY JONES COULD HAVE ASKED: (part II): And speaking of that hot angry summer we just had, isn’t it true that the University of Huntsville Alabama satellite records tell a completely different story, suggesting that this summer Australian temperatures were not unusual at all? The BOM results are based on a black box method that is unpublished and rely on averaging temperatures across thousands of square kilometers. Satellites cover the entire continent day and night.
UAH Satellite records cover the entire continent day and night and show the summer of 2013 was very ordinary.
TONY JONES: Yeah, I suppose if you say “caught a break from science”, does that actually give us more time to get our acts together as a planet and for the countries around the world to actually seek some sort of unified action? …
BILL MCKIBBEN: No, it doesn’t give us any more time. We’re still under the gun. What it does do I think is allow those who are working on these issues some reason for a little bitta hope. Frankly, the level of despair has been enormous and correctly so; we’re losing this fight….
(Jones does weakly ok on this, but could have done so much better…)
Two earnest young chaps drive out to meet the slimy-ogre-from-the-hobbit who posts skeptical comments all over the web, and discover, shock, Hoyt is actually a nice guy. He’s not only normal looking, he’s well spoken, and he has good manners. He’s likeable.
They young fans of the climate scare get excited when Hoyt admits he doesn’t believe a Democrat. (Hmm, I suspect they are thinking “ideologue”.)
They also got excited when he said he was a prostate cancer survivor, not because he survived (though I say, Thank Goodness) but because it gave them an excuse to talk about “doctors”. There’s an attempt at a James Delingpole-BBC moment coming where they play up a logical fallacy as if it tells us something about the climate. You trust medical science, but not climate science? I do hope Hoyt responded that if his medical doctors had been hiding data and losing records he would have been skeptical of them too.
The mouth of the Amazon is the worst source of “pollution”.
Bad news for fans of The Amazon River. A new study shows that while the Amazon rain forest is the Lungs of The Planet, pulling down gigatonnes of CO2, the river undoes all the good the trees do, and pours all the CO2 back into the sky. Damn that river eh? Lucky it only discharges one fifth of the worlds freshwater.
Apparently most researchers thought bacteria couldn’t digest the tough woody lignin of tree debris fast enough to prevent it getting to the ocean*. Underestimating microbial life seems a common affliction, and we hear was a big surprise that only 5% of the lignin actually ends up reaching the ocean where it might sink to the floor and be sequestered. The rest is broken down by bacteria and released into the air. The clues were there for years that the Amazon was giving off lots more CO2 than people expected, but the consensus was that it “didn’t add up”. So much for that consensus.
Yet another victory for observations over opinions.
Until recently, people believed much of the rain forest’s carbon floated down the Amazon River and ended up deep in the ocean. University of Washington research showed a decade ago that rivers exhale huge amounts of carbon dioxide — though left open the question of how that was possible, since bark and stems were thought to be too tough for river bacteria to digest.
A study published this week in Nature Geoscience resolves the conundrum, proving that woody plant matter is almost completely digested by bacteria living in the Amazon River, and that this tough stuff plays a major part in fueling the river’s breath.
The finding has implications for global carbon models, and for the ecology of the Amazon and the world’s other rivers.
“People thought this was one of the components that just got dumped into the ocean,” said first author Nick Ward, a UW doctoral student in oceanography. “We’ve found that terrestrial carbon is respired and basically turned into carbon dioxide as it travels down the river.”
Tough lignin, which helps form the main part of woody tissue, is the second most common component of terrestrial plants. Scientists believed that much of it got buried on the seafloor to stay there for centuries or millennia. The new paper shows river bacteria break it down within two weeks, and that just 5 percent of the Amazon rainforest’s carbon ever reaches the ocean.
“Rivers were once thought of as passive pipes,” said co-author Jeffrey Richey, a UW professor of oceanography. “This shows they’re more like metabolic hotspots.”
How do we stop that river, can we divert it underground, or cover it in white reflective plastic — do you think? Would it be better to dose it with megatonnes of antibiotics, and can we have a grant to study that? Does this mean flushing antibiotics down the toilet helps change the weather? Don’t send those old pills to landfill…
Remember there are global carbon markets running (limping) churning over $170 odd billion a year pretending that they can account for carbon flows in a meaningful way. Shame there are just a few odd gigatonnes still unaccounted for. Does this mean the parts of the Amazon that WWF “own” which were projected to net them as much as $60 billion may actually have a net worth of zero dollars when the “downstream” effect of their pollution is taken into account? We wouldn’t let the big mining corporations ignore their downstream pollution, so why let that naughty river get away with it?
Can someone calculate how many coal fired powerstations this river is equivalent too?
Finally the modelers are catching up with the slow-down or pause in global warming over the last decade. Where the best estimate for the IPCC was 3.3 degrees C with a range of 2.0 to 4.5C, Otto et al have revised the best estimate to 2C, with a range of 1.2C – 3.9C.
Effectively the power of CO2 to warm just got 30% less, according to a team of researchers, many of whom have in the past have published more alarming papers. Remember “there is no debate” and “global warming is a fact” a lot “like gravity”. (And that gravitational constant g could be revised by a third soon, right?)
Otto et al looked at the global energy budget which means adding up atmospheric, ice, continent, and ocean energy. They compare it decade by decade since 1970, and argue that the long term equilibruim temperature response need to be revised down. The oceans are taking up more heat than anyone thought (or says Jo, given how little we know about the oceans, it could be that sneaky energy is tripping off to outer space?)
Observations of the global mean temperature change plotted against change in forcing minus heat uptake (ΔF–ΔQ) for the equilibrium climate sensitivity (ECS) (a) and against ΔF for the transient climate response (TCR) (b), for each of the four decades 1970s, 1980s, 1990s and 2000s and for the 40-year period 1970–2009. Ellipses represent likelihood contours enclosing 66% two-dimensional confidence regions; best-fit points of maximum likelihood are indicated by the circles; and the curved thick and thin lines represent the 17–83% and 5–95% confidence intervals of the resulting one-dimensional likelihood profile in ECS (or TCR), respectively. All time periods are referenced to 1860–1879, including a small correction in ΔQ to account for disequilibrium in this reference period14. Straight contours show iso-lines of ECS (a) and TCR (b), calculated using a best-fit value of F2x of 3.44 W m−2 (also adjusted for fast feedbacks)10. Uncertainty in F2x is assumed to be correlated with forcing uncertainty in long-lived greenhouse gases10. To avoid dependence on previous assumptions16, we report results as likelihood-based confidence intervals.
For the number-junkies, one number that has been used ad lib as gospel for years appears to have changed. The hallowed forcing due to a doubling of CO2 was 3.7Wm^-2 is being lowered to 3.44Wm-2.
F2x is the forcing due to doubling atmospheric CO2 concentrations.
We use a value of F2x of 3.44 W m–2 (with a 5–95% confidence interval of ±10%) from ref. 10. Using a higher estimate of 3.7 W m–2 would shift up our estimated ranges for ECS and TCR, but only by about 0.1 K
The wide error bars on climate science knowledge (when it suits) mean that this 30% shift can be described as “in agreement”:
The oceans as measured by ARGO are warming, but that warming is not only far less than the models predicted, it is far less even than the instrument error.
The background of a crucial point
…
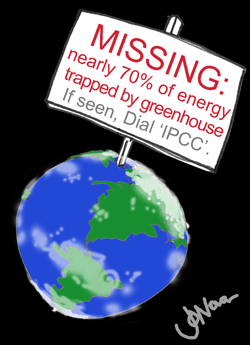
Everyone agrees: 90% of the energy in the Earth’s climate system is stored in the oceans. Rocks and sand don’t transmit the heat down, except at incredibly slow rates. The wil-o’-the-wisp-atmosphere hardly holds any energy. But water covers 70% of the surface, to an average depth of 3,700m, and it can store septillions of joules.
Climate models say the Earth’s energy balance is out of whack, and therefore 90% of the extra energy trapped by increasing greenhouse gases is stored in the ocean. The oceans are warming (probably), but the extra energy found in the top 700m of the world’s oceans is not enough. The modelers argued the heat was hidden below, that from 700m-2,000m. Skeptics argue the missing energy was flung out to space. This is the big enchilada, and as far as measuring oceans goes, everything changed in 2003 when we finally got the ARGO system, and that’s why it’s worth a closer look now.
David points out that the errors might be seriously miscalculated. A single ARGO buoy (which measures ocean temperatures down to 2000m) has an uncertainty of about 0.1C. But using 3,000 buoys doesn’t make that uncertainty dramatically smaller when all that data is combined together. It would, if the 3,000 buoys were all measuring the same swimming pool. But each buoy measures a different piece of ocean, and the ocean does not have one global temperature. Or it would if all the world’s ocean localities warmed by the same increment due to global warming, in each time period. But that would be a very brave assumption, because different parts of the world’s oceans probably warm at different rates due to global warming. So the measurement uncertainty is closer to the instrument error of 0.1C than the 0.004C as claimed by fans of man-made global crisis, and since the oceans have only warmed by about 0.02C (if that) since we’ve been measuring it with ARGO, that tiny amount of warming might just be noise. Going back further, the pre-ARGO data is so bad that longer datasets have much larger uncertainties.
Overview of Measuring Ocean Temperatures
According to many neat diagonal graphs, the oceans are warming, it’s alarming, and we have to spend billions to stop it. But is that warming enough, and how accurately can we measure it anyway?
For some inexplicable reason NOAA publish graphs of ocean heat content (OHC) but not ocean temperatures — the later are what the equipment measures, and what we relate to. So we need to convert OHC back to degrees C to find out the change in temperature.
Inspired by Willis Eschenbach, David Evans has done it with the ARGO data. (David doesn’t use non-ARGO data because he considers the XBT and buckets-off-boats stuff to be whimsical fantasy with error bars up where the unicorns fly, see below.) ARGO data only properly started in 2003, and any data at-depth before then was sparse. Compare it to the detail in our atmospheric measurements. We’ve been releasing weather-balloons twice a day from 800 sites around the Earth for five decades. To measure the global oceans we used 50 ships “of opportunity” (which happened to be in a shipping-lane) and XBT’s were fired down, not twice a day but once every few weeks. And vast tracts of the ocean hardly got measured, ever, especially the deepest parts. (XBT’s only get down to about 800m.)
ARGO data is good, but short. It’s fair to ask if such a short span is meaningful? Since thou shalt not create nor destroy energy — it is fair. The imbalance caused by extra CO2 has run day in and day out for nearly 3000 days since ARGO began. That energy has to be somewhere.
Where are the error bars?
This is the standard diagonal scare-graph for ocean temperatures, but with added notes about which parts are reliable.
It looks like a convincingly big rise, but it’s not enough, and the error bars are huge. Even on the accurate ARGO buoys error margins are probably not a lot less than 0.1C. GRAPH UPDATED*
David Evans separated the layers of ocean so we can compare the rate of warming in the deeper layer, 700m – 2,000m, with that from the top layer, 0 – 700m. (Bear in mind, the “top” 700 m is not exactly shallow — it is the hull-crush depth of a military submarine.) David found that the rate of warming in the deeper layer is the same as the rate in the top 700m.
Over this short period, there is no acceleration evident in either layer.
If the instrument error is 0.1C, the error bars would be off the scale. [Jo says, “look” the error bars are marked in white…] GRAPH UPDATED*
…
You might almost think the slight appearance of warming matters, but let’s put it in perspective — it’s not remotely close to what the models predicted.
GRAPH UPDATED*
Though the funny thing about having wider error bars is that even though the results look so different from the models, the predictions could still fall within the error bars! Why haven’t the modelers announced it? [Prediction from Jo: Trenberth channels Santer 2008, “reconciles model and ARGO data by revisiting error estimations!” Coming soon, with 17 authors and a major press release… Researchers investigate errors and find the missing energy!].
Dr David Evans discusses the ocean data
These notes about the graphs above and the following explanation of how he got the graphs and why he chooses to use ARGO over the other data sets are thanks to David.
What does a study of 20 years of abstracts tell us about the global climate? Nothing. But it says quite a lot about the way government funding influences the scientific process.
John Cook, a blogger who runs the site with the ambush title “SkepticalScience” (which unskeptically defends the mainstream position), has tried to revive the put-down and smear strategy against the thousands of scientists who disagree. The new paper confounds climate research with financial forces, is based on the wrong assumptions, uses fallacious reasoning, wasn’t independent, and confuses a consensus of climate scientists for a scientific consensus, not that a consensus proves anything anyway, if it existed.
Given the monopolistic funding of climate science in the last 20 years, the results he finds are entirely predictable.
The twelve clues that good science journalists ought to notice:
1. Thousands of papers support man-made climate change, but not one found the evidence that matters
Cook may have found 3,896 papers endorsing the theory that man-made emissions control the climate, but he cannot name one paper with observations that shows that the assumptions of the IPCC climate models about water vapor and cloud feedbacks are correct. These assumptions produce half to two-thirds of the future projected warming in models. If the assumptions are wrong (and dozens of papers suggest they are) then the predicted warming is greatly exaggerated. Many of the papers in his list are from these flawed models.
In other words, he’s found 3,896 inconclusive, subsequently-overturned, or correct but irrelevant papers. What is most important about his study is that after thousands of scientists have pored over the best data they could find for twenty years, they still haven’t got any conclusive support.
2. Cook’s study shows 66% of papersdidn’t endorse man-made global warming
Cook calls this “an overwhelming consensus”.
They examined “11 944 climate abstracts from 1991–2011 matching the topics ‘global climate change’ or ‘global warming’. We find that 66.4% of abstracts expressed no position on AGW, 32.6% endorsed AGW, 0.7% rejected AGW and 0.3% were uncertain about the cause of global warming.
Perhaps the large number that are uncertain merely reflects the situation: climate science is complicated and most scientists are not sure what drives it. The relative lack of skeptical papers here is a function of points 4, 5, and 7 below. Though its irrelevant in any case. It only takes one paper to show a theory is wrong. Who’s counting?
3. Cook’s method is a logical fallacy: Argument from Authority. This is not science, it’s PR.
The thing that makes science different to religion is that only empirical evidence matters, not opinions. There are no Gods of Science. Data, not men, is the authority that gets the last say (there is no Pope-of-The-Papers). Cook turns that on its head. It’s anti-science. When scientists explain why they’re sure gravity keeps the Earth in its orbit, they don’t argue that “97% of geophysicists voted for it”.
Cook knows this (I do keep reminding him), but he pretends to get around it. Spot the delusion: “Scientists must back up their opinions with evidence-based analysis that survives the scrutiny of experts in the field. This means the peer-reviewed literature is a robust indicator of the state of the scientific consensus.” Cook assumes that scientists opinions are based instantly and accurately, and only on the evidence, as if humans were Intel chips. He assumes that “peer review” is uncorruptible (unlike every other human institution), that two unpaid anonymous reviewers is “scrutiny”, that climate-activist-scientists don’t work to keep skeptics out of the peer review literature, and that ClimateGate never spilled out what really happened in climate science.
Don’t people who do psychological research need to understand the basics of human nature? Scientists can cling to the wrong notion for years — just look at those who thought humans would never fly (even two years after the Wright brothers’ first flight) or that x-rays in shoe stores were safe, or that ulcers weren’t infectious, or that proteins could not be contagious (then came BSE).
4. The number of papers is a proxy for funding
As government funding grew, scientists redirected their work to study areas that attracted grants. It’s no conspiracy, just Adam Smith at work. There was no funding for skeptical scientists to question the IPCC or the theory that man-made climate science exaggerates the warming. More than $79 billion was poured into climate science research and technology from 1989 to 2009. No wonder scientists issued repetitive, irrelevant, and weak results. How hard could it be? Taxpayers even paid for research on climate resistant oysters. Let no barnacle be unturned.
Sheer quantity of abstracts endorsing man-made climate change has increased, but so has the funding.
Over the same era, $79 billion was poured into climate science and climate technology related research.
The problem with monopsonistic funding models is that there is little competition. Few researchers are paid to research angles that are likely to disagree with the theory. Volunteers who want to do their own research don’t have free access to journals, may have trouble getting the data (sometimes it takes years or FOIs to get it, and sometimes it never comes). Volunteers don’t necessarily have the equipment to do the analysis, and don’t have PhD or Honours students to help. They also don’t get paid trips to conferences and suffer the impediment of having to devote time to earn an income outside of their research. When they do find something there are no PR teams to promote their papers or send out the press releases.
In the financial world we have audits, in courts we have a defense, in Parliament we have an opposition, but in science we have… whatever the government feels like funding.
In the end, there is no government funding, be it through a grant or institute that actively encourages people to search for reasons the IPCC favoured theory might be wrong.
5. Most of these consensus papers assume the theory is correct but never checked. They are irrelevant.
The papers listed as endorsing man-made global warming includes “implicit endorsement”, which makes this study more an analysis of funding rather than evidence. Cook gives the following as an example of a paper with implicit endorsement: “‘. . . carbon sequestration in soil is important for mitigating global climate change’. Any researcher studying carbon sequestion has almost certainly not analyzed outgoing radiation from the upper troposphere or considered the assumptions about relative humidity in climate simulations. Similarly, researchers looking at the effects of climate change on lemurs, butterflies, or polar bears probably know little about ocean heat content calculations. These researchers are “me too” researchers.
If a conservative government had spent billions analyzing the costs of the failed climate models and the impact of disastrous green schemes, skeptics would be able to quote just as many me-too papers as Cook quotes here. (But we wouldn’t, because analyzing the climate by doing keyword studies — it ain’t science).
6. Money paid to believers is 3500 times larger than that paid to skeptics (from all sources).
Cook seems to believe there are organized efforts running to confuse the public. Is that a projection of Nefarious Intent(NI) coupled with conspiratorial suggestions of mysterious campaigns?
Contributing to this ‘consensus gap’ are campaigns designed to confuse the public about the level of agreement among climate scientists.
Given that he is confused about what science is, he probably would think people are trying to confuse him when they give it to him straight.
His own personal bias means he is the wrong person to do this study (if it were worth doing in the first place, which it isn’t).
It has all the hallmarks of activist propaganda, not research. Cook tries to paint skeptics as doing it for the money, but blindly ignores the real money on the table. Governments have not only paid more than $79 billion in research, they also spend $70 billion every year subsidizing renewables (an industry which depends on researchers finding a link between carbon dioxide and catastrophic climate change). Carbon markets turn over something in the order of $170bn a year, and renewables investment amounts to a quarter of a trillion dollars. These vested interests depend entirely on a catastrophic connection — what’s the point of cutting “carbon” if carbon doesn’t cause a crisis? Against these billions, Cook thinks it’s worth mentioning a 20 year old payment of $510,000 from Western Fuels? And exactly what was Western Fuels big crime? Their primary goal was allegedly the sin of trying to ‘reposition global warming as theory (not fact)’ which as it happens, is quite true, except that technically, “global warming” is not even a theory, it’s a hypothesis, something with much less scientific weight.
Do you think if you had $79 billion you could get 3896 papers published
7. Keywords searches may miss the most important skeptical papers.
Keyword searches are more likely to turn up “consensus” papers. Many skeptical papers don’t use the terms “global warming” or “global climate change”: eg Svensmark (1998), Douglass (2007), Christy (2010), Loehle (2009), and Spencer (2011). Were they included? Perhaps they were, but they don’t appear to match the search terms in the methods. These are just a few seminal skeptical papers that might have been missed.
UPDATE:Lucia and JunkPschology in comments confirm that these six papers listed would not have made Cooks list. So in only half an hour of random analysis I can easily turn up major papers by skeptics that fall outside Cooks primitive keyword hunt. How many others miss too?
8. Some of these abstracts are 20 years old — does two decades of new evidence change anything?
Twenty years ago the IPCC was predicting we’d get warming of 0.3 degrees C per decade. The warming trend came in significantly below their lowest possible estimate, no matter which major dataset you consult. Back then scientists didn’t know there was an 800 year lag in the ice cores (where temperatures rise centuries before carbon dioxide does). In 1992 scientists didn’t realize that warming would soon flatten out for 15 years. They didn’t know that 28 million radiosondes would show their models were based on flawed assumptions about water vapor. They didn’t know that 3000 ARGO bouys would finally measure the oceans adequately for the first time (starting in 2003) — and find the oceans were not storing the missing energy their models predicted they would be, or heating nearly as quickly as the models predicted. In other words, even if there was a consensus in 1992, it’s irrelevant.
9. NaiomiOreskes found 928 papers with abstractsthat didn’t explicitly reject man-made global warming. So? Skeptics found 1,100 papers that support skeptical views.
Skeptics don’t issue press releases decreeing that this means anything scientific. It does mean that the media and IPCC are blindly ignoring masses of evidence, and that the term “denier” is well… marketing, not science. The people who deny these 1,100 papers exist are the ones calling other scientists names. When will journalists notice?
Given how much money has been paid to find evidence, the question real investigators ought to ask is “Is that all they found?”
Skeptics don’t issue press releases saying we outnumber and outrank the believers. Perhaps we should, but skeptics prefer to argue the evidence. Cook ignores the authorities that don’t suit him. Skeptics get Nobel Physics prizes, but believers only seem to get prizes for Peace. Phil Jones is one of the most expert of expert climate scientists, but he couldn’t create a linear trendline in Excel. Some skeptics, on the other hand, got man to the moon.
No wonder the public don’t think there is a consensus. There is no consensus among scientists.
Cook makes out that the public have been fooled by a deliberate campaign, but unless devious skeptics can cover continents in floods and snow, it could be that the public can see the failure of the models with their own eyes.
Is there a better argument to show why big government is a big-fail than just saying, E.U.? It takes real skill to start with 20 successful economies and combine them into one large bankrupt entity — and all this in only a decade-and-a-half.
For Australians, seven billion dollars is $320 per man, woman and child. That was nearly $1,300 per household of four.
If someone had knocked on your door with a registered E.U. tin, would you have felt compelled to give $1,300 (of non-tax deductible income) to rescue the poor bankers and burdensome bureaucrats of Europe? Perhaps you might have chosen instead to get a new fridge, take the family on a holiday, or pay for private tutoring for your teenager. But thanks to Swan and the force of big government, you didn’t get that chance. As it happens, Australia doesn’t have the cash to pay it anyway, so the government borrowed $7 billion and we’ll pay the interest, as well as the debt. Good-o.
It’s OK though, Swan tells us “but it won’t involve donating cash into a relief fund.” I’m so relieved.
Instead, we are borrowing money we don’t have, to rescue the regulators, bail-out the bureaucrats, and keep the EU politicians in their cushy but overpaid, net-drain employment who made mistaken decisions we had no role in.
Meanwhile people in Papua New Guinea, Indonesia, Afghanistan, and Bangladesh will just have to make do with a bit less (and, if the Eurocrats get their way, no prospect of life-changing cheap power anytime soon). I’m sure they feel a warm glow knowing their new water-wells, schools, or vaccinations are delayed for a “good cause”.
The opposition estimate Gillard will leave us with a gross debt of more than $270 billion. The cost of five years of mismanaged big-government was that even above the thousands paid in five years of tax, the average person owes another $12,000 dollars — or nearly $50k for a family of four.
What would your household have done with an extra $50k?
When will voters realize the true cost of the parasitic-political class, which voted to rescue fellow parasites rather than the poorest of the poor? What do we call this group who use the goodwill and productivity of others to fund their own mistakes through regulations and coercion: polarasites, politisites?
Budget night in Australia tonight. More fun.
*Minor edits to make it clear the $7b decision was made in 2012.
Who knew? Sometimes you should feed goats to prevent floods and droughts. Other times you should shoot them to get the same outcome. Confused? In times gone by you would need to ask the tribal witchdoctor. Now, in the post-modern period, talk to a climate scientist.
Steve Goreham highlights some Global Stupidity in the Washington Times. In case you didn’t know, for writing things like this his booksget burned. It could only happen in a centre for higher education.
— Jo
Shepherd or Shoot Goats in the Name of Climate Change
O’Hare airport will finally get its goats. The Department of Aviation of the City of Chicago has awarded a contract to a private firm to provide 25 goats to munch vegetation at the city’s airport. These “green lawn mowers” will help reduce carbon dioxide emissions to sustain the planet.
Last fall, when the project was bid, Amy Malick, head of sustainability at the Department of Aviation, commented on the planned use of goats in hard-to-mow areas, “They may have steep slopes, very hard to get to with heavy machinery, and those machines also emit pollution. They’re burning fossil fuel. So as a sustainability initiative we’re looking to bring in animals that do not have emissions associated with them, at least to the same extent that heavy machinery would.”
A shepherd will herd the goats across 120 acres at four different sites on airport property. The 25 fuzzy critters are expected to clear vegetation each day from a square at least sixteen feet on a side.
Senator Ron Boswell (National Party) makes the case in The Australian today that Australia is losing manufacturing due to rising energy costs, while the US is gaining manufacturing back from China because it has a cheap energy advantage with shale gas.
I could make the case that when Big-Government tries to change the weather, it has moved into the realm of witchcraft. There is no empirical evidence that reducing CO2 will measurably reducestorms, floods and sea–levels, and there is no economic calculation that suggests Australia can afford to change the global climate (even if it were possible). Business is doing the only sane thing and shifting to countries that are more rational.
Such is the “National Conversation” on these policies, it is impossible to say exactly how much The Carbon Farce has cost Australian business, due to the complexity of supply chain accounting and the rule that the government will put you in jail if you publish an estimate that is wrong. There are other factors at work, but there is no situation where higher energy costs make business easier, unless your business is one of the ones making expensive energy.
Energy taxes are the nail in the coffin of local manufacturing
Ron Boswell The Australian May 08, 2013 THE collapse of the European carbon price has laid bare the absurdity of the Gillard government’s energy-based taxes on production.
The Australian carbon tax, at $23 a tonne and rising, and the almost-as-expensive renewable energy tax are killing the competitiveness of our businesses.
Boswell lists the businesses cutting production in Australia: Holden, Bluescope Steel, Boral, Penrice Soda, Pentair, Amcor, Goodman Fielder, Caltex…
So Holden will cut 500 jobs in South Australia and Victoria to reduce costs while Labor adds an estimated $550 to the manufacturing cost of every new Holden: $350 with a carbon tax and $200 with renewable energy targets. European car manufacturers gain an immediate advantage because of their far lower carbon price, not to mention the high Australian dollar. Why subsidise the Australian car industry on one hand and penalise it with energy taxes on the other?
Australia’s strong manufacturing sector was based on two great advantages: abundant food and mineral resources and cheap power from massive coal deposits.
By increasing the cost of power, Labor has thrown away one advantage and major Australian manufacturing operations are going out of business or overseas.
Businesses here are cutting jobs to save costs:
BlueScope Steel in Victoria, 170 jobs gone; Boral, 790 jobs gone; Penrice Soda in SA, 60 jobs gone; Pentair, a company that made steel pipes in western Sydney for 60 years, 160 jobs gone; and Amcor, 300 jobs gone. Goodman Fielder is shutting 15 factories, cutting 600 jobs, Caltex its Kurnell refinery, 330 jobs, and the Norsk Hydro aluminium smelter near Newcastle, 350 jobs.
Others are moving production overseas: Kerry Foods, 100 jobs gone; Kresta Blinds, 72 jobs; Cussons soaps, 75 jobs; Aerogard, 190 jobs; Harley-Davidson, 212 jobs; and Bosch, 380 jobs. Golden Circle has moved processing lines and jobs to New Zealand too.
In the US, manufacturing is growing:
General Electric is spending $US800 million ($784m) bringing back production of electrical appliances from China to Kentucky. Apple is spending $US100m on a US manufacturing line for Mac computers currently made in China. Other companies lured back to the US include Caterpillar, Whirlpool, Otis, Electrolux, Google, NCR and Zentech. Foreign companies plugging into the US’s cheap power include German chemicals giant BASF, which has already committed $US5.7 billion to North America since 2009.
US commentators are talking about an extra $US1.5 trillion increase in manufacturing production and 3.7 million manufacturing jobs by 2025. One of the main reasons for this resurgence is cheap electricity, generated by the shale gas now being tapped into by US power companies.
The carbon tax is placing an $8 billion a year burden on Australia…
One industrial user in Queensland told me it recently received a $244,000 electricity bill. Of that, $32,500 was attributed to the RET and $45,000 to the carbon price. This is an increase of almost 50 per cent on this user’s costs last year, due to the RET and the carbon price. A cost projection prepared for another Queensland industrial user shows that next year it will pay a $5.78 million electricity bill; $495,000 of that will be from the RET and about $1m from the carbon price.
Even companies that don’t use much electricity suffer from higher energy prices
All businesses in Australia hurt when Australian consumers have less to spend. The invisible opportunity cost robs them of customers:
Modelling done for NSW’s Independent Pricing and Regulatory Tribunal, the Climate Change Authority and other bodies all show that households would save about $270 a year with the RET and carbon tax gone.
That’s $270 from every household each year that could be used to create jobs in restaurants, holiday towns, local shops, gyms, sporting facilities… instead of Australians enjoying memorable moments, and getting fitter, it funds some bureaucrats, it provides jobs in China, Japan and Germany and other places where “renewable-energy” machinery is made, and it helps to reduce world temperatures by zero degrees.
But it’s true that part of that money props up a small local industry. It’s a group of people who install equipment they hope will change the weather.
We might as well be casting spells and stirring cauldrons.
Welcome to the land of witchcraft.
*Update: Added “Senator” and Nationals to the first line. h/t for proofreading to Themm.
How is the hallowed Green tech industry working out for China? Not so well.
Shi Zhengrong was called a “hero of the environment” by Time Magazine. He was a billionaire who ran the worlds largest seller of solar PV cells. But the glory days of 2008 – 2011 are gone. Another bubble bursts. Wiped out in two years. How fast was this fall?
In 2008, CNN named Shi “China’s Sunshine Boy.” In 2009, Fortune anointed him “China’s new king of solar.” That year, New York Times columnist Thomas Friedman also cited Shi and Suntech as models of China’s green leap forward — which he called “the Sputnik of our day” and a spur for U.S. clean energy policy.
Now, however, the Chinese Sputnik has crashed to Earth, and the Sun King has been toppled.
… a Chinese court declared the company bankrupt after a petition from eight Chinese banks. On Wednesday, the company announced that its 2012 revenue had plunged 48 percent from the previous year.
Suntech — which in 2011 was the world’s biggest seller of silicon-based photovoltaic modules — was once valued at $13 billion on the New York Stock Exchange; it is worth less than 1 percent of that today. A news report that Warren Buffett might be eyeing all or part of Suntech lifted the battered share price more than 80 percent in one week, but acquiring Suntech could be a risky bet. [Buffett denies this according to Bloomberg]
…
Quartz reports that just last week Suntech cancelled a major order: “This doesn’t look good. Suntech, the embattled Chinese solar panel maker, has canceled $1.3 billion in polysilicon orders…”
Shi was trained in Australia, under our best.
The rise of Suntech was a rags-to-riches story for its founder. Given up for adoption by destitute parents in a farming area, Shi excelled at school and obtained a master’s degree before moving to Australia in 1989 on an exchange program. He accepted a scholarship to do solar cell research at the University of New South Wales, quickly earned a PhD … [The Washington Post]
An old fashioned glut with new fangled technology. There were just too many solar panels in the world that nobody wanted:
China has about two-thirds of the world’s solar panel manufacturing capacity. China alone, theoretically, could supply all of the world’s solar demand and there would be no room for U.S., German, Japanese or Taiwanese companies. [The Washington Post]
And people said that solar was becoming more competitive with coal?
“Analysts said Suntech’s business model, deliberately pushing down prices to capture larger market share despite narrower profit margins, contained the seeds of its own destruction.” [The West]
The last profit was in 2010:
Suntech recorded a net loss of $1.0 billion in 2011, from a profit of $237 million in 2010, according to company filings. The firm has yet to report financial results for 2012. [The West]
What the government giveth, a bureucrat can take away, and when combined with a rapid expansion at the wrong time, it became the perfect (solar) storm:
… just as Suntech became the world’s largest solar panel manufacturer, the European debt crisis hit. Profit margins collapsed, and customers’ unpaid bills piled up. In June 2012, a puzzled Citigroup analyst noted in a report that as major countries such as Germany and Italy sharply reduced subsidies, Chinese manufacturers led by Suntech boosted capacity 30 percent, “only exacerbating the excess supply conditions.” The report said that “module prices are likely to remain below Suntech’s production costs for the foreseeable future.” [The Washington Post]
If Shi had been doing his research properly and reading skeptical blogs he might have seen the writing on the wall.
Remember how we are supposed to be following China and how China is “going Green”?
Suntech is not unique. Most Chinese solar panel manufacturers have been losing money…
Thanks for the invite to assist with the crowd sourced online survey.
Unfortunately I just can’t see this working.
1. The survey is profoundly anti-science, it’s exactly the kind of thing I debunk on my blog. Consensus is the stuff of politics, not science. Science is not a democracy, and we don’t vote for the laws of physics, which are either right or wrong and not “97% popular”. Hence, any answer you get in this survey (and it appears you already have the answers) has got nothing to do with understanding the climate of Earth. It may possibly be helpful in psychosocial analysis of groupthink in modern science, or the effect of monopsonistic funding on scientific progress, but that brings me to problem 2, even if it were useful for that, you are not the researcher to study that. See point 2.
2. You still refer to us as “deniers” in much of your work. You admitted there was no such thing as a “climate denier” a few months ago (albeit after five years of using the term), but you have not adopted a more useful name, or apologized for abusing the English language. Clearly you think skeptics are run by their lizard brains, unable to think, prone to burying their heads in the sand. (Didn’t you put that on the cover of your book?) So in the end, if skeptics are deniers, and they are so incapable of thinking, it’s not rational for you to want deniers to “help” with this fallacy of a survey, because irrational dullards would be bound to do a bad job. It appears more likely that that what you are trying to achieve is a new way to survey people who disagree with your scientific opinion. That would make this a form of confirmation bias for the purpose of PR and not science. (See also point 1).
If this is what John Cook thinks of skeptics, why would he ask them to “help” his research?
3. Your recent work with Stephan Lewandowsky has rather vaporized any small remnant of trust or goodwill most skeptics feel for you. Hence, as commenters are already saying on threads related to this, what skeptic would bother giving you 10 minutes of their time? One term I heard was “barge-pole”.
4. Lastly there is the question of honesty. You’ve given each skeptic blogger a different survey link, so presumably you can track responses to certain blogs. Yet in the email you tell me that the responses are anonymous and you don’t disclose that each site was given a trackable link. That’s dishonest. (It reminds me of the time you insisted you hosted a professional research survey on your blog and when you couldn’t find it, said improbably, that you’d deleted it, except it was never on your blog in the first place was it? There is a peer reviewed science paper that justifies itself because of that imaginary post of yours, why don’t you correct it? Are you interested in the truth, or just “The Cause”?)
I think that’s got it covered: It’s anti-science, illogical, run by the wrong man, and you haven’t been honest.
But if you can fix all that, then send me an email.
Australia could be leading the world in research that will save lives and earn money. Instead we lead the world in gullible obedience to an absurd scheme to change the weather.
Making human body parts from off-the-shelf or customized cells is a vast improvement on waiting for healthy people to die and donate, and a lifetime of immunosuppressants. Any delay in developing these techniques will surely cost lives and prolong disability. Those who do develop and patent these techniques are bound to profit and be able to afford even more research, and will improve national productivity as well as the quality of life. For those on waiting lists, spending $3billion on solar panels to stop storms and hold back the sea is the cruelest waste.
This type of medical work could make waiting lists for organ-donation a thing of the past. The political vanity of supporting useless causes for the sake of symbolism has a ghastly price.
Read about what this poor little girl and her family have had to go through. She is two, and had never been home or tasted food until last month. She has not been able to speak, but might possibly one day. This is marvelous news, which we fervently hope continues to deliver. It is very early days…
Toddler is youngest to ever get lab-made windpipe
Tuesday Apr 30, 2013 | Lindsey Tanner for The Associated Press
South Korean 2-year-old has new windpipe made from her own stem cells; youngest patient ever
CHICAGO (AP) — A 2-year-old girl born without a windpipe now has a new one grown from her own stem cells, the youngest patient in the world to benefit from the experimental treatment.
Hannah Warren has been unable to breathe, eat, drink or swallow on her own since she was born in South Korea in 2010. Until the operation at a central Illinois hospital, she had spent her entire life in a hospital in Seoul. Doctors there told her parents there was no hope and they expected her to die.
The stem cells came from Hannah’s bone marrow, extracted with a special needle inserted into her hip bone. They were seeded in a lab onto a plastic scaffold, where it took less than a week for them to multiply and create a new windpipe.
About the size of a 3-inch tube of penne pasta, it was implanted April 9 in a nine-hour procedure.
Princeton scientists have made a bionic ear that extends human hearing into ranges humans can’t normally hear.
A bionic ear created with 3D printing. It contains an antenna that can pick up radio waves. Credit: Photo by Frank Wojciechowski
May 1, 2013 — Scientists at Princeton University used off-the-shelf printing tools to create a functional ear that can “hear” radio frequencies far beyond the range of normal human capability.
The researchers’ primary purpose was to explore an efficient and versatile means to merge electronics with tissue. The scientists used 3D printing of cells and nanoparticles followed by cell culture to combine a small coil antenna with cartilage, creating what they term a bionic ear.
“In general, there are mechanical and thermal challenges with interfacing electronic materials with biological materials,” said Michael McAlpine, an assistant professor of mechanical and aerospace engineering at Princeton and the lead researcher. “Previously, researchers have suggested some strategies to tailor the electronics so that this merger is less awkward. That typically happens between a 2D sheet of electronics and a surface of the tissue. However, our work suggests a new approach — to build and grow the biology up with the electronics synergistically and in a 3D interwoven format.”
UPDATED: Post note below, with a couple of extra caveats…
Lüdecke, Hempelmann, and Weiss found that the temperature variation can be explained with six superimposed natural cycles. With only six cycles they can closely recreate the 240 year central European thermometer record. There is little “non-cyclical” signal left, suggesting that CO2 might have a minor or insignificant effect.
The three German scientists used Fourier analysis to pick out the dominant cycles of one of the longest temperature records we have. The Central European temperature is an average of records from Prague, Vienna, Hohenpeissenberg, Kremsmünster, Paris, and Munich.
The dominant cycle appears to be about 250 years. There is also a cycle of about 60 years, corresponding to the Atlantic/Pacific decadal oscillations.
Data is of course, always the biggest problem. If we had 10,000 years of high quality global records, we could solve “the climate” within months. Instead, we have short records, and Lüdecke et al, make the most of what we have. The European records are only 240 years long, or (darn) one dominant cycle, and only one region, so to check that the results are valid over longer periods they also analyze a the 2000 year Spannagel Cave stalagmites proxy, where the dominant cycle of roughly 250 years is confirmed. To show that the results apply to other parts of the world, they look at the German Alfred Wegener Institut (AWI), Antarctica series.
Ominously, the temperatures of the dominant cycle (in Europe at least) peaked circa 2000 and if the six-driving-cycles do represent the climate then things are going to get cooler, quickly. Wait and see…
Fourier analysis can’t tell us what causes the cycles, but it can tell us the likely frequency, amplitude and phase of those cycles* (see the post note). If these are accurate, it can be used to rule out significant effects from man-made forces and ultimately to predict what will happen next.
— Jo
Image: Celcius thermometer made by Pierre Casati, Lyon circa 1790. Source Historical Climatology
—————————————————————
Periodic climate oscillations
Horst-Joachim Lüdecke, EIKE, Jena, Germany
Alexander Hempelmann, Hamburg Observatory, Hamburg, Germany
Carl Otto Weiss, Physikalisch-Technische Bundesanstalt Braunschweig, Germany
In a recent paper [1] we Fourier-analyzed Central-European temperature records dating back to 1780. Contrary to expectations the Fourier spectra consist of spectral lines only, indicating that the climate is dominated by periodic processes (Fig. 1 left). Nonperiodic processes appear absent or at least weak. In order to test for nonperiodic processes, the 6 strongest Fourier components were used to reconstruct a temperature history.
Fig. 1: Left panel: DFT of the average from 6 central European instrumental time series. Right panel: same for an interpolated time series of a stalagmite from the Austrian Alps.
Fig 2: 15 year running average from 6 central European instrumental time series (black). Reconstruction with the 6 strongest Fourier components (red).
Figure 2 shows the reconstruction together with the Central-European temperature record smoothed over 15 years (boxcar). The remarkable agreement suggests the absence of any warming due to CO2 (which would be nonperiodic) or other nonperiodic phenomena related to human population growth or industrial activity.
For clarity we note that the reconstruction is not to be confused with a parameter fit. All Fourier components are fixed by the Fourier transform in amplitude and phase, so that the reconstruction involves no free (fitted) parameters.
However one has to caution for artefacts. An obvious one is the limited length of the records. The dominant 250 year period peak in the spectrum results from only one period in the data. This is clearly insufficient to prove periodic dynamics. Therefore, longer temperature records have to be analyzed. We chose the temperature history derived from a stalagmite in the Austrian Spannagel cave, which extends back by 2000 years. The spectrum (Fig. 1 right) shows the 250 year peak in question. The wavelet analysis (Fig. 3) indicates that this periodicity is THE dominant one in the climate history. We ascertained also that a minimum of this 250 year cycle coincides with the 1880 minimum of the central European temperature record.
Fig 3: Wavelet analysis of the stalagmite time series.
Thus the overall temperature development since 1780 is part of periodic temperature dynamics prevailing already for 2000 years. This applies in particular to the temperature rise since 1880, which is officially claimed as proof of global warming due to CO2, but clearly results from the 250 year cycle. The 250 year cycle was driving the temperature drop from 1800 to 1880 (see Fig. 4), which in all official statements is tacitly swept under the carpet. This same general fall and rise shows in the high quality Antarctic ice core record in comparison with the central-european temperature records (Fig. 4, blue curve).
ALMOST 150 suspected rorts of the Gillard government’s Renewable Energy Target scheme were reported to the regulator last year, with NSW and federal authorities assisting with the execution of two search warrants as a part of the probe.
The Clean Energy Regulator yesterday released its annual report to government on the administration of the RET — a scheme that provides certificates for both large and small-scale renewable energy generation as part of the bipartisan target of ensuring 20 per cent of Australia’s electricity comes from renewables by 2020.
The regulator’s audit report revealed that during 2012 it received 147 allegations of rorts, the majority of which related to the creation of dodgy certificates for rooftop solar panels.
So far three “monitoring warrants” have been executed by NSW and Australian Federal police. One matter is before the Federal Court as a civil prosecution. One criminal matter was heard last year.
…businessman John Testoni of Sydney Solar Eco Solutions pleading guilty to improperly creating $170,000 in RET certificates for 24 non-existent solar system installations in the Sydney area.
Fake markets just ask to be scammed. Who can forget the Spanish winter of late 2009 when 4,500Mw hours of “solar” electricity was generated at night. That was 2.5 million euro of diesel powered photovoltaic electricity. As Lubos points out, the regulators said they ended the scam, but slightly smarter crooks would just turn off the diesel at dinner time wouldn’t they? Who was checking?
Higher feed in tariffs for solar power are a falsely high price. No one can tell a solar-powered electron from a coal-fired one, yet one artificially “sells” for more (and these are the same people who say we need a “free market”). The arbitrage position begs to be tested.
Alarmists concerned coal investors will lose money
The same Australian story notes at the end that The Climate Institute are worried about coal investors losing money. Shucks. Coal investments in the US are about $674bn a year and about $5.7bn in Australia. Coal is in an unsustainable bubble they say, “of climate denial, indifference or dreaming.”
Being the great investors they are The Climate Institute warns “It is increasingly clear there will be a lot of wasted investments or stranded assets,…”
But I suspect coal investors probably know something about their competition from The Famed And Glorious Renewables Revolution.
Speaking of which, Scott-the-trader wrote to me yesterday to point out that in the wind-favoured-electricity-market of South Australia the wind was stilled and electricity spot prices were up: “Pool prices at $200/Mwh compared to the rest of the NEM at $60/Mwh.” (NEM means National Electricity Market.) He went on, “5 minute pool price price in SA has been as high as $12000/Mwh this morning.” I wondered, how much power the turbines were making? He replied, “…the next 5 minute snapshot after the one attached was for a net draw by wind from the system of 1Mw.”
“Installed capacity of wind in SA >1220Mw. ”
Running at minus 0.1% capacity then*.
Electricity spot prices across Eastern Australia Monday 29-April-2013
A few hours later things had improved (slightly) “Combined wind output totalled across Vic and SA is right at this moment 52Mw from the installed capacity of 2107Mw”
But hey. It’s only one day, right?
UPDATE: Commenters were asking about the screen, and if that pricing information is available on the web publicly. It’s not. But Scott points to the goovernment AEMO site (Australian Energy Operator), and the Wind-Farm Performance site where data is available for yesterday, and on each wind-farm individually. We can see that yesterday national wind-generated-electricity was running a bit less than 10% of capacity.
* UPDATE #2: John Hultquist points out that a “draw” on the system means it’s a negative. Scott confirms. The wind towers are using electricity trying to “hunt” for the right wind direction. The word “minus” added to that sentence.
We use cookies to ensure that we give you the best experience on our website. If you continue to use this site we will assume that you are happy with it.Ok
 Paul Syvret seems to be hoping no one will notice that he doesn’t even try to respond to arguments about wind turbines. His technique to avoid debate is to decree that some other people were wrong once on a different topic. They used a rapid fire technique called a Gish Gallop, so therefore, thusly and henceforth anyone with a rapid fire technique can be dismissed with a handy wave of The Gish. It’s just another label in Syvret’s all-purpose excuse-list for not having a grown up conversation.


 To get certification this meaningless takes time:


Recent Comments