Medieval “climate change” was filled with heatwaves, droughts, and crop failures
One thousand years ago, “rivers ran dry under the protracted heat, the fish were left dry in heaps and putrefied in a few hours.” Men and animals venturing in the sun in the summer of 1022 fell down dying.”
It was so hot in 1132 that the rivers ran dry and “the ground was baked to the hardness of stone”. Around 1200 at the Battle of Bela “there were more victims made by the sun than by weapons”. In 1303 and 1304, the Seine, the Loire, the Rhine, and the Danube could all be crossed with dry feet, and they dried up again in 1538-1541. In 1393 and 1394 the crops were “scorched up” and “great numbers of animals fell dead”. In 1625 in Scotland, it was so hot “meat could be cooked merely by exposing it to the Sun.”
And so it goes — history that was known in the 1800’s appears to be disappearing, leaving us with a generation of snowflakes who think they are the only humans who ever faced hot weather. They with their air-conditioned bedrooms, mobile phones and filtered water.
In 879, agricultural laborers, who must have been as tough as nails, were struck down after “just a few minutes in the sun”.
Thanks to Tony Heller at RealClimateScience who has a resource page: “1500 Years of Heatwaves”
Gaillard’s Medical Journal – Google Books
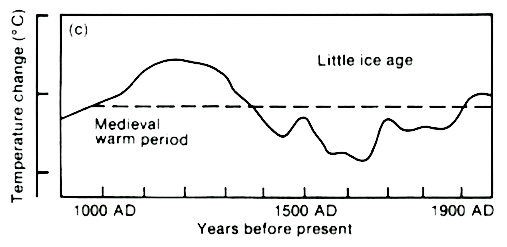
The Medieval Warm Period was a global phenomenon, see the graphs, the pollen, the sea sediments and tree rings. And the IPCC knew it in 1990 too.
1990 IPCC FAR Report, Medieval Warm Period.
They’ve been rubbing out the Medieval Warm Period ever since. Even though Hubert Lamb did the graph in 1982, scores of different proxies have gone on to support it on every continent. References at the link above plus at the tag Medieval Warm Period.
h/t also Paul Homewood at Notalotofpeopleknowthat
Text copied below:
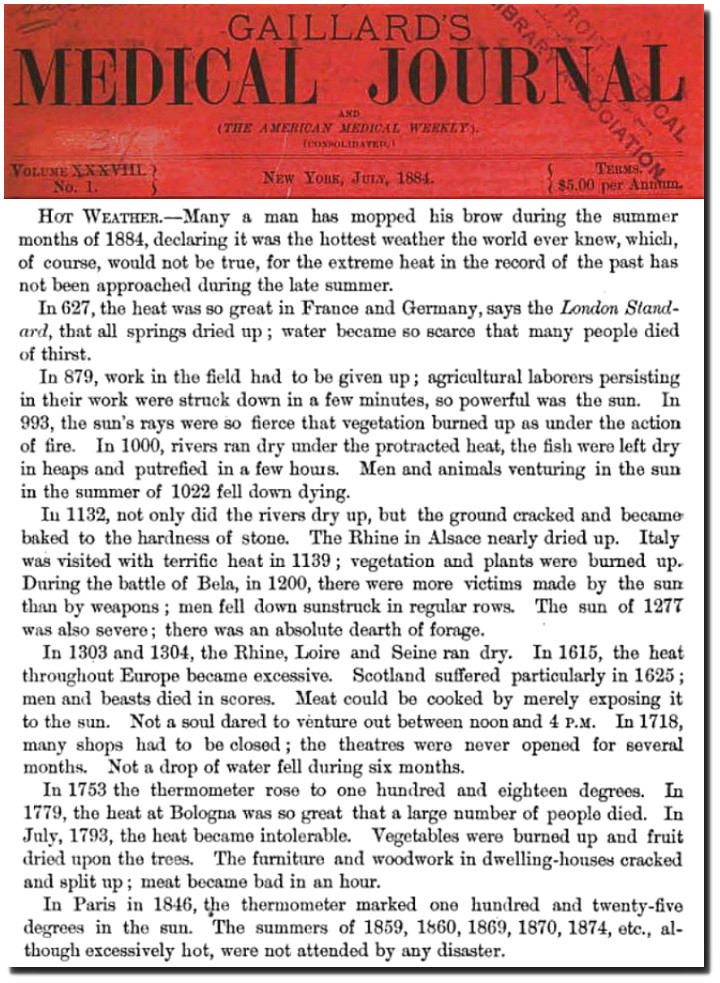
“Hot Weather.—Many a man has mopped his brow during the summer months of 1884, declaring it was the hottest weather the world ever knew, which, of course, would not be true, for the extreme heat in the record of the past has not been approached during the late summer.
In 627, the heat was so great in France and Germany, says the London Standard, that all springs dried up; water became so scarce that many people died of thirst.
In 879, work in the field had to be given up; agricultural laborers persisting in their work were struck down in a few minutes, so powerful was the sun. In 993, the sun’s rays were so fierce that vegetation burned up as under the action of fire. In 1000, rivers ran dry under the protracted heat, the fish were left dry in heaps and putrefied in a few hours. Men and animals venturing in the sun in the summer of 1022 fell down dying.
In 1132, not only did the rivers dry up, but the ground cracked and became baked to the hardness of stone. The Rhine in Alsace nearly dried up. Italy was visited with terrific heat in 1189; vegetation and plants were burned up. During the battle of Bela, in 1200, there were more victims made by the sun than by weapons ; men fell down sunstruck in regular rows. The sun of 1277 was also severe; there was an absolute dearth of forage.
In 1303 and 1304, the Rhine, Loire and Seine ran dry. In 1615, the heat throughout Europe became excessive. Scotland suffered particularly in 1625 ; men and beasts died in scores. Meat could be cooked by merely exposing it to the sun. Not a soul dared to venture out between noon and 4 p.m. In 1718, many shops had to be closed; the theatres were never opened for several months. Not a drop of water fell during six months.
In 1753 the thermometer rose to one hundred and eighteen degrees. In 1779, the heat at Bologna was so great that a large number of people died. In July, 1793, the heat became intolerable. Vegetables were burned up and fruit dried upon the trees. The furniture and woodwork in dwelling-houses cracked and split up; meat became bad in an hour.
In Paris in 1846, the thermometer marked one hundred and twenty-five degrees in the sun. The summers of 1859, 1860, 1869, 1870, 1874, etc., although excessively hot, were not attended by any disaster.”


It’s already started as Jo mentioned, but history will continue to be rewritten to completely remove any last vestiges of these “inconvenient facts”.
In fact, Michael Mann already did that (1) in his infamous and fraudulent “hockey stick” graph, the basis of virtually all Western climate policy.
Ref (1): https://www.theunion.com/opinion/norm-sauer-mann-s-hockey-stick-a-documented-hoax/article_5e9bee14-1468-59aa-90d9-6d1e82f584cf.html
570
Mann’s fraudulent “hockey stick” graph may one day be considered the most destructive act in the history of Western Civilisation, even more so than two world wars, because at least those eventually ended and life got back to normal.
The financial cost of WW2 for all major participating nations was over US$4 trillion (ref 1) in today’s dollars.
We are talking about spending vastly more money in building windmills, solar panels and Big Batteries.
McKinsey (ref 2) says (I think it’s for the world but it might just be the US):
Incidentally McKinsey is a Leftist-oriented company so these figures are likely to be less than reality.
Ref 1: https://historyandheritage.cityofparramatta.nsw.gov.au/research-topics/world-war-two/world-war-two-financial-cost
Ref 2:
https://www.mckinsey.com/featured-insights/sustainable-inclusive-growth/chart-of-the-day/the-cost-will-not-be-net-zero
And
https://www.mckinsey.com/capabilities/sustainability/our-insights/the-economic-transformation-what-would-change-in-the-net-zero-transition
330
I believe the UK spent a million pounds a day just for ammunition in WW1,so 4 trillion is possible just for the USA.
120
yes, war is very profitable for some people,
but they wouldn’t have a hand in deliberately creating conflict.
140
Yes, perish the thought that the US Military Industrial Complex stoked up the post-Soviet Russia as a bogeyman to keep the flow of taxpayers cash coming instead of helping them move forward. Far from me to suggest that promoting a war in Ukraine has been very useful to the US MIC as demand to restock and upgrade flows in.
40
The UK spent £12 trillion equivalent in both the first and second world war. No one repaid us except Norway. To this day the EU refuse to defend themselves with almost all spending well under the Nato suggested average.
Germany was forgiven its debts whilst the UK has only just stopped paying the US for the money they loaned us during the war.
100
And as a result of both World Wars, human technology advanced steadily. Whereas now, with Nut Job Zero mankind is going backwards and wasting Trillions in doing so.
40
Truth is breaking out all over! Panic ensues! NOT!
https://www.youtube.com/watch?v=7vUODDWjjY8&t=1s
130
Excellent video by Paul Joseph Watson.
120
Agreed.
I love his no BS approach.
90
Further on, Neil Oliver’s take on the weather map fearmongering:
https://notalotofpeopleknowthat.wordpress.com/2023/07/23/neil-oliver-weather-maps-are-among-the-most-blatant-forms-of-fearmongering-deployed-so-far/
180
Neil is good but his monologue needs graphic support to emphasise his many points.
30
The modern climate change activists have no knowledge of history if their current mantra is to be believed. As this powerful article reveals, there has always been extremes in weather. I have always stated, weather is cyclic and now is no different than the past. In the last 100 years or so the one thing that has saved lives is the availability of reasonable priced electricity. Now that is seriously under threat as globalists pull the strings to destroy western economies and leave vulnerable people exposed like in the medieval past. Net zero may have a far more sinister plan behind it that we are ever likely to be told.
360
The current ploy in the MSM is to admit that hot conditions and freak weather occurred in the past but now insist that these events are happening more often owing to ‘climate change’, and that we must ‘alter our way of life’ to prevent climate change happening.
220
Should have just left it at that.
280
I lived in Southern coastal Spain for 4 years near Cadiz, Puerto de Santa Maria. Every year, without fail, during July/August, we endured Levante, the scirocco winds coming from Northern Africa / Morocco. Thousands of tons of sand were blown into Spain. The temperatures were some 40-45 C. The sand was like talcum powder and invaded everything for weeks. Wet towels under the doors couldn’t stop the powder from getting inside closed luggage. The heat, wind, and sand, were relentless. The locals said “this is normal and has been for recorded memory”. AGW has nothing to do with this. It is simply Weather, and has been, for Centuries.
210
Dave
I have been writing on Historical climate matters for some 15 years. You can give facts, figures and observations on the past until you are blue in the face but our rulers have no interest in history whilst activists just ignore it.
90
That’s because they’re not interested in the truth.
It’s a political issue underpinned by the persistent publication of organized lies, for the purpose of attaining power, control and money.
Large profits are made. Scarce national resources are misallocated. The world’s poor are exploited. The environment is destroyed by the very people who purport to be its protectors.
60
Most people are unaware just how sparse the modern instrumental temperature record is.
At the link is a view of the Global Historical Climatology Network (GHCN)-Daily stations as a function of time from https://journals.ametsoc.org/view/journals/atot/29/7/jtech-d-11-00103_1.xml
For much of the modern period until around 1950 there was no instrumental data for much of the world but as Tony Heller has pointed out, they simply it up for places like Africa and South America.
https://journals.ametsoc.org/view/journals/atot/29/7/images/full-jtech-d-11-00103_1-f1.jpg
171
Correction: the word “make” should appear after “simply”.
100
Watkin Tench at Port Jackson. (Sydney).
“December 27th 1790. Wind NNW; it felt like the blast of a heated oven, and in proportion as it increased the heat was found to be more intense, the sky hazy, the sun gleaming through at intervals.
At 9 a.m. 85 degrees At noon 104 Half past twelve 107 1/2 From one p.m. until 20 minutes past two 108 1/2”.
“At 20 minutes past two 109 At Sunset 89 At 11 p.m. 78 1/2
[By a large Thermometer made by Ramsden, and graduated on Fahrenheit’s scale.]
December 28th.
At 8 a.m. 86 10 a.m. 93 11 a.m. 101 At noon 103 1/2 Half an hour past noon 104 1/2 At one p.m. 102 At 5 p.m. 73 At sunset 69 1/2
[At a quarter past one, it stood at only 89 degrees, having, from a sudden shift of wind, fallen 13 degrees in 15 minutes.]”
………
“But even this heat was judged to be far exceeded in the latter end of the following February, when the north-west wind again set in, and blew with great violence for three days. At Sydney, it fell short by one degree of what I have just recorded: but at Rose Hill, it was allowed, by every person, to surpass all that they had before felt, either there or in any other part of the world. Unluckily they had no thermometer to ascertain its precise height. It must, however, have been intense, from the effects it produced. An immense flight of bats driven before the wind, covered all the trees around the settlement, whence they every moment dropped dead or in a dying state, unable longer to endure the burning state of the atmosphere. Nor did the ‘perroquettes’, though tropical birds, bear it better. The ground was strewn with them in the same condition as the bats.”
Were I asked the cause of this intolerable heat, I should not hesitate to pronounce that it was occasioned by the wind blowing over immense deserts, which, I doubt not, exist in a north-west direction from Port Jackson, and not from fires kindled by the natives. This remark I feel necessary, as there were methods used by some persons in the colony, both for estimating the degree of heat and for ascertaining the cause of its production, which I deem equally unfair and unphilosophical. The thermometer, whence my observations were constantly made, was hung in the open air in a southern aspect, never reached by the rays of the sun, at the distance of several feet above the ground.
My other remarks on the climate will be short. It is changeable beyond any other I ever heard of; but no phenomena sufficiently accurate to reckon upon, are found to indicate the approach of alteration. Indeed, for the first eighteen months that we lived in the country, changes were supposed to take place more commonly at the quartering of the moon than at other times. But lunar empire later lost its credit.”
Excerpts From
A Complete Account of the Settlement at Port Jackson
Watkin Tench
This material may be protected by copyright.
Apologies for the cut and paste, but it is marvellous stuff. I highly recommend Watkin Tench’s two books which can be downloaded free at gutenberg.org
150
A similar situation was recorded by Captain Charles Sturt in 1844.
Captain Charles Sturt – Heatwaves Central Australia October 1844
“The wind, which had been blowing all the morning from the NE, increased to a heavy gale, and I shall never forget its withering effect. I sought shelter behind a large gum tree, but the blasts of heat were so terrific that I wondered the very grass did not take fire.
At noon I took a thermometer graded to 127 F, out of my box and observed that the mercury was up to 125 F, Thinking it had been unduly influenced, I put it in the fork of a tree close to me, sheltered alike from the wind and the sun. I went to examine it about an hour afterwards, and I found the mercury had risen to the top of the instrument and had burst the bulb, a circumstance that I believe no traveler has ever before had to record.
I cannot find language to convey to the reader’s mind an idea of the intense an oppressive nature of the heat that prevailed”.
NB 127 F = 53.00 C which may have been exceeded on that day, possibly an Australian record.
50
The World Weather Attribution people who are the last word on this, the ‘experts’, or is it high priests, have now decreed.
https://www.bbc.co.uk/news/science-environment-66289489.amp
After every bit of hot weather, they just issue identikit assessments. ‘virtually impossible without climate change…. doomed unless we cut emissions’.
https://www.worldweatherattribution.org/analysis/heatwave/
As far as I’m aware North Africa has been there a long time and it is always crazy hot in summer. It only takes a minor perturbation for that air to travel to Europe. Sometimes, inevitably, it will happen more often than others, and history shows that.
Yes it’s been hot in parts of Europe, the far south mostly, but if it wasn’t for widespread/organised arson, it really wouldn’t be that newsworthy or memorable.
200
Grim >”The World Weather Attribution people who are the last word on this, the ‘experts’, or is it high priests, have now decreed”
Yes, Simon responded to my comment in previous Open Threads re Jet Stream Dynamics and Extreme Heat Waves from a 2017 paper with a link to World Weather Attribution.
My comments on attribution were this:
Simon replied with a link to WWA – Extreme heat in North America, Europe and China in July 2023 made much more likely by climate change
My response to that next.
100
Simon/WWA >”Extreme heat in North America, Europe and China in July 2023 made much more likely by climate change”
My reply in Open Threads previous:
Study says nothing whatsoever about the change from meridional to wavy jet streams so no actual attribution of the heat waves.
And obviously if they don’t address the jet streams they cannot make an attribution for the CHANGE from meridional to wavy – that driver is what is causing the heat waves and the intensity of them in the first instance.
They are so far out of the loop there is no point to the exercise but I note this:
Without the change in jet streams these events would be non-existent. And see Jo’s next post – “European heatwaves: Soldiers died in the heat in 1160, Rivers ran dry in 1303, animals fell dead in 1393”
What was the driver back then before “human induced climate change” ?
# # #
So here we are now with Jo’s post of events far worse than present occurring 100s of years ago – where’s Simon and the World Weather Attribution people on this ?
150
>”Study says nothing whatsoever about the change from meridional to wavy jet streams so no actual attribution of the heat wave”
I’ve been using the wrong term “meridional” – why didn’t someone call me out?
Should be ZONAL – not meridional.
Meridional, wavy, or meandering are all the same event.
00
>”Nothing about a solar source for meridianal to wavy jet stream”
Essay: Solar cycle wave frequency linked to jet stream changes
By Francis Tucker Manns, PhD
https://wattsupwiththat.com/2018/09/28/essay-solar-cycle-wave-frequency-linked-to-jet-stream-changes/
[Excerpt – see Figures]
NASA says, as we enter the solar minimum, our wispy atmosphere shrinks. NASA has learned to juggle satellites that drop into lower orbits during the solar cycle. Lower down in our atmosphere the sun drives our winds and the most important winds of all, that rule all the others, are the jet streams that power around the planet at well over 160 kilometres an hour.
When the atmosphere contracts, the jets start to meander. The meandering happens because there is a space problem; the same jet stream is jammed into less volume within a shrunken atmosphere; hence the jet streams kink. The cloud levels are slightly but measurably lower as well.
The meanders with ridges and troughs (similar to those of a great river like the Mississippi but far more vast) typically carry the weather fronts with them with low pressure and a high pressure zones: a ridge and a trough. The jet streams maintain their velocity as in a solar maximum, but wander farther north and farther south taking colder air south and hotter air north. The meanders are called Rossby waves. Hence, wide temperature variations occur; most of North America had two temperature swings in May from the teens to the high twenties and back again. Kinking of the jet stream causes extreme weather. As the wandering is slow, the storms behave like broken lawn sprinklers. Under certain conditions, a normal weather front can cause dangerous flooding because, although the jet stream is moving rapidly (consistent with its name) the lateral course of the jet stream meander wanders slowly from west to east and occasionally stalls.
The result is like a broken water sprinkler dumping rain or snow in one spot, a region out of equilibrium with local conditions on the ground. The result is flooding or a numbingly serious blizzard. Today the Gulf Coast is swamped by tropical storm Cindy caught in a slowly moving jet stream.
We are witness to the climate change we have been taught to fear, and it is not anthropogenic; it is extraterrestrial.
70
I left school in 1960. In 1952 the world’s first jet airliner, the British Dr Havilland Comet, was released, but later withdrawn because of crashes indicating design flaws in the new technology. When it was brought back into service, part of the solution was to go slower to reduce stress. So when the Boeing 707 was released with the benefit of new technology it was a significantly faster aircraft.
But I remember a newspaper report in the later 1950s that a Comet had set a new record for the time to get from Darwin to Sydney. It had the benefit of a 200 miles per hour tailwind. The “Jet Stream”.
10
BBC/WWA from Grim >“Europe and US heatwaves near ‘impossible’ without climate change”
This is actually true on the face of it.
Of course there’s been a change of some sort in the climate – that’s a no-brainer.
But then what is the attribution for the cause of change?
Being “made worse” is NOT attribution – that doesn’t address the drivers.
And of course the events are “near ‘impossible'” without some sort of change.
But what caused the change in the first instance?
Obviously, given Jo’s post, these events are not unprecedented and have occurred long before human attribution can be made.
All across this climate change issue are cases of missattribution.
50
‘But what caused the change in the first instance?’
The zealots cannot say a build up in CO2 is creating meandering jet streams in both hemispheres.
It might have begun with a quiet sun, but that is pure speculation.
30
I wasna there, then, neither was Gramps. So we all don’t know. Heavens above, half the folk who recorded that data, didn’t even know of another Half of the world…
Point I’m making is that a heck of a lot of the MSM and the wallies protesting / screeching and their flock of sheeple have NO EARTHLY IDEA what they’re actually talking about! Wouldn’t know the difference between 30 or 40C, 15 or 20C, and so on,… simply they live in a cocooned world of City life and escape to the Hotter climes for holidays HOTTER CLIMES !! Hoh! and look what that link shows. AND THEN we have the matter of the COLD NIGHTS. Living up here ( N Scotland) if your Red Button was in permanent use, you’d never have guessed that the world was overheating. Less Artic ice this year, the MSM proudly proclaims, must be getting warmer then… so where does this Summer Cold wind come from, Hot ice ??
100
Some relevant Tony Heller talks.
https://youtu.be/4Qmfaqejwas
(NASA altering historic climate data)
https://youtu.be/JPOG41pFxTE
The Climate Crisis of 1896
https://youtu.be/fuv9hwIAmq4
Are Government Temperature Graphs Correct?
60
As we know, sea levels have fallen over the last seven thousand years and there is currently no sign of a reversal of that trend.
Certainly the ocean levels have been very stable for a long while now. The ice ain’t melting.
Polar ice accumulation is reflected in falling see levels; i.e. it’s cool out there.
Conversely, stable oceans tell us that world temperatures are stable and are, on average, the lowest for seven thousand years.
The Earth is a big place and we must accept variations as currently seen.
Of interest.
https://joannenova.com.au/2012/10/australian-sea-levels-have-been-falling-for-7000-years/
110
Crying foul over current heat waves is only possible when the past has been ignored , or covered up.
To pretend that a “system” like the Earth can be absolutely and completely stable and gentle to humans is ignoring or hiding reality.
Sea levels are essentially a world thermometer. Sea levels rise: the world is warming, and vice versa.
Some past discussion.
KinkyKeith
October 15, 2012 at 5:26 am
To Geologists this “drop in sea levels” is not a secret, it is a well known part of the sea level history that took place after the last ice age ended.
It has been carefully given the deep six and buried out of sight by the AGW mafia.
Here in Newcastle, Geologists point to the beautiful rock platforms that are to be seen in the coastline from Newcastle to Redhead.
These were cut by wave action dragging rocks , pebbles and sand back and forth form several thousand years before the latest drop of about 1.2 metres.
The cries of “we’ll be swamped” by the Warmer crew deliberately and arrogantly ignore input from specialists
in geology just as they have done with the specialist input from physicists, chemists, biologists and
engineers to name a few groups whose specific knowledge of the CO2 – Warming claim has been “Inconvenient”.
Against this background of sea level movement the claims of the catastrophists look rather stupid or perhaps
more accurately, highly manipulative.
The CAGW theme has created great wealth and financial advantage for believers and manipulators of this
“scheme” but has set almost a billion people in Europe and the English speaking world onto a path of tax
slavery, wasted research effort and outright theft of public funds.
History will not be kind to the Global Warming movement as the cost in chasing this monster into a dark,
blind alley has been enormous.
It is not over yet until the leaders have been tried, convicted and publicly held up to the ridicule they deserve.
KK
Look at the bigger picture.
200
??.. kk, i was so suprised at your blatent false statement that i initially looked for the “sarc” flag and the follow up punch line. …
..but it appears that you actually do ignor real data such as the often quoted Sydney Fort Dennison sea level records , which are regarded as one of the most reliable and conservative sources, where a steady trend of 0.6-1.3 mm per year has been recorded.
https://tidesandcurrents.noaa.gov/sltrends/trends/680-140.png
Whilst this trend/rate may well be insignificant in reality, i fail to see how you can ignor such solid data. ?
10
A minimum, let me repeat that, a minimum of 4.2 metres sea level drop in the last six thousand years in an oscillating trend down to current levels.
You are obviously unaware of the actual experienced rates when things start to move.
For the first 11,000 years after the last ice age ended the sea level rise was in the order of 100 ‘m per year.
After the max out about 7 or 8 thousand years ago, the fall averaged 0.7 ‘m per year, but while that might seem small , there’s more to that than meats the eye.
Yours in science
KK
20
Correction.
That 100 ‘m should have been checked. B autocorrect ###.
Supposed to be 10 mm per year over 11,000 years.
10
Check 2.
0.7 mm per year average, this is despite the ups and downs. There were peaks starting at 4.2 metres, then down and returning to 2.4 metres, oscillating down to 1.2 metres, then home to where we are now.
Three separate high points indicating cooling and rewarming cycles.
20
Chad, looks like KK has lots of self proclaimed sciency words as data to back up his assertion.
33
Just tell us when we need to don the lifejackets.
I’m becoming immune to irrelevant fear porn, and I was so hoping for a vaxxine for that.
10
Data for sea levels at Fort Denison.
http://www.bom.gov.au/ntc/IDO70000/IDO70000_60370_SLD.shtml
Mth Year Gaps Good Minimum Maximum Mean St Devn
6 1914 125 595 0.070 1.930 0.971 0.403
6 2023 0 720 0.246 2.033 1.123 0.398
I’ll let you work it out but not a great change in sea level on this data.
00
Nobody said the increase was great or rapid.. just a steady trend up.
But somebody did say “sea levels have fallen….and there was no sign of any reversal of that trend”…
Maybe they should “fact check” before posting, rather than after ?
00
So let me guess.
Unfortunate person gets hit by EV.
No longer gets tested for COVID as possible COD (old narrative).
New narrative …
after lying in direct Sun on asphalt in July (January in Oz), health official pulls out thermometer.
COD: Extreme Heat/Climate Change.*
*(As we know, cold is good and does not cause Climate Death.)
210
Extra bonus if they can be claimed to have died of both covid and climate change.
They are desperately trying to make the connection because think of the extra “research” funding.
Example:
That’s certainly open-ended enough to ensure decades of taxpayer-supplied research funding.
121
One of the problems the pro-science, pro-reason people are up against with warmists is that the dumbing-down of the education system is so profound, as is the influence of post-modernism upon warmists, that facts and truth simply no longer matter to them. Post-modernism teaches that there is no such thing as objective truth, truth is whatever people believe it to be, etc..
As we have seen recently, they are quite prepared to openly lie or misrepresent data such as reporting ground temperatures in Europe rather than air temperatures as is appropriate, to emphasis higher temperatures in Europe.
And, of course, anyone who dares question the Official Narrative is subject to censorship, sacking/firing, defunding, deplatforming and slander and libel. The Left in general cannot tolerate alternative opinions, as is consistent with their totalitarian ideology.
202
Humans have experienced record flourishing since the start of the Industrial Revolution and the use of fossil fuels.
Since the appearance of modern Humans about 200 K + years ago their life expectancy was under 30 years ( OWI Data ) or under 40 years according to the UN Data.
This changed after the use of fossil fuels and more modern use of better health care and more scientific knowledge based upon more R & D etc.
But by 1950 the average life expectancy was still about 45.5 years for the 2.5 billion people on Earth.
Since 1950 we’ve seen a very rapid increase in population and life expectancy today for the 8 + billion people is 73 years and very few people suffer from hunger and child mortality is at record lows today compared to 70 years ago.
BTW deaths from fires and burns today are much lower than earlier decades and Aussies have one of the lowest percentages compared to other countries. See OWI Data I’ve linked to before.
But we live in the safest, wealthiest period (since 1950 = 0.1% of our time on Earth) in Human history although we now have 5.5 billion more people at risk since 1950.
130
Remember this?
Warning! Centuries-old HUNGER STONES emerge from dry riverbeds in drought-stricken Europe – Sunken ships, lost villages too
https://strangesounds.org/2022/08/horrifying-centuries-old-hunger-stones-emerge-from-dry-riverbeds-in-drought-stricken-europe.html
90
so much for ‘unprecedented’
70
With over 250 major agricultural regions, a one-in-thousand-year event happens every 4 years on average somewhere in the world in such a place. Every two years for either heat or flooding.
Randomly, rather than exactly every two years and many at the same time so there shouldn’t be a news story correctly describing an event as one in a thousand years. Of course, these events aren’t anywhere near as rare.
The modern media make it feel like these events are happening next door but you can’t just poke your head out the window and see climate change.
100
>”In 1625 in Scotland, it was so hot “meat could be cooked merely by exposing it to the Sun.”
So if it overcooked, was it made worse by human induced climate change?
70
Her are the OWI Data numbers of people who’ve died from fires + burns in the world since 1990 and some selected countries and regions.
We’ve seen a drop in numbers even though the World population has increased by about 2.7 billion over the last 33 years. THINK.
I’ve chosen Australia and Greece, Nth America, Europe etc.
Australian population has increased from 17.1 million in 1990 to 26 million today. And Greece has had a small increase in their pop since 1990.
https://ourworldindata.org/grapher/deaths-from-fires-and-burns?tab=chart&facet=none&country=AUS~OWID_WRL~North+America+%28WB%29~European+Region+%28WHO%29~GRC~GBR
10
Yes, but a large proportion of that change can be attributed to IMMIGRATION over those 30+ years !
10
On a previous occasion (largely from Extraordinary Popular Delusions and the Madness of Crowds, an early study of crowd psychology by Scottish journalist Charles Mackay).
Johannes Stöffler, a respected German mathematician and astrologer, predicted that a great flood would cover the world on February 25, 1524, when all of the known planets would be in alignment under Pisces, a water sign. Hundreds of pamphlets announcing the coming flood were issued and set in motion a general panic.
A still more singular instance of the faith in predictions occurred in London in the year 1524. The city swarmed at that time with fortune-tellers and astrologers. In June 1523, several of them predicting that the 1st day of February, 1524, there would be a great flood.
It was reiterated with the utmost confidence month after month, until so much alarm was excited. At least twenty thousand persons quitted the doomed city.
Bolton, the prior of St. Bartholomew’s, was so alarmed that he erected, at very great expense, a sort of fortress at Harrow-on-the-Hill, which he stocked with provisions for two months. The flood was meant to start in London and move east through Europe by February 24. Boat builders became rich as landowners and nobles prepared emergency arks for their own survival. River banks across Europe were dotted with new boats laden with all the food and water they could safely carry.
Of the various known arks to be built, the most ambitious was by a German count named von Iggleheim who constructed a luxury, three-story ark for his friends and family. Crowds had gathered, mostly out of curiosity, when the rain started. While it wasn’t a particularly impressive rainstorm, it was enough to panic the crowd. Hundreds were killed in the stampede that followed and then they turned their attention to von Iggleheim’s ark and the other ships nearby. When von Iggleheim refused to allow any of them aboard, he was dragged off his ship and stoned to death by the crowd.
Weather wise, the year 1524 was actually dryer than usual in Europe.
120
It’s important to keep the terror going.
And the Australian Government is probably the world’s most fanatical follower of the anthropogenic global warming fraud and globalism.
Nine News Australia just tweeted:
121
Your PM is over here at the moment for talks with the Loser Govt – surely 9News warned him of the CCCCCC chaos unfolding, ie. state highways closed due to snow blocking roads and/or cars on fire, sinkholes opening in city streets, frigid gale-force winds and ski areas on-hold due to BLIZZARD conditions… It’s July in NZ after all.
100
What PM? We have no leader although we have someone who “identifies” as such.
100
In my northern hemisphere home town, the forecast high today is 18C. Better stay put.
110
We know far more about the Medieval Warming Period now than we did in 1982. It probably hasn’t been this warm in 125,000 years. This can’t be proved conclusively but it is likely. https://theconversation.com/is-it-really-hotter-now-than-any-time-in-100-000-years-210126
134
The Conversation is not a scientific reference. It is a propaganda platform originally established by Government and those who seek Government (i.e. taxpayer) funding and content is:
https://theconversation.com/au/who-we-are
It’s main purpose seems to be to propagate journalist-crafted scare stories to keep Government (taxpayer) funding flowing to special interest and “scientific” “research” groups and other rent-seekers.
290
David >”to propagate journalist-crafted scare stories”
In Simon’s defense (probably a first for me), the author wasn’t a journalist:
Also cites his paper D.S. Kaufman and N.P. McKay, 2022 (see #17.3 below).
Even so, he doesn’t miss the chance to propagate political activism.
80
No, it’s a forum for researchers to publicise their work. The technical note discussed in the article is:
Kaufman, D. S. and McKay, N. P.: Technical Note: Past and future warming – direct comparison on multi-century timescales, Clim. Past, 18, 911–917, https://doi.org/10.5194/cp-18-911-2022, 2022.
https://cp.copernicus.org/articles/18/911/2022/
315
‘Human-caused global warming is now exceeding the warmest multi-century period of the Holocene and thereby the envelope of temperatures under which agriculturally based society has flourished (Steffen et al., 2018).’
So its going to be the same as the Holocene Climate Optimum?
40
Simon, quoting ” The Conversation” might get you to an all-time recored of red thumbs today.
141
Simon >Darrell Kaufman – “Is it really hotter now than any time in 100,000 years?”
You presented this article in Monday Open Threads here.
There were five serious responses to it – me and Gee Aye – that you never responded to.
You >”It probably hasn’t been this warm in 125,000 years. This can’t be proved conclusively but it is likely.”
Darrell Kaufman:
Cringe indeed.
He then goes on – “This is a new climate state”
Except there’s a problem with that – a graphic that lies.
Figure: Earth’s average temperature has exceeded 1 degree Celsius (1.8 F) above the preindustrial baseline. This new climate state will very likely persist for centuries as the warmest period in more than 100,000 years. The chart shows different reconstructions of temperature over time, with measured temperatures since 1850 and a projection to 2300 based on an intermediate emissions scenario. D.S. Kaufman and N.P. McKay, 2022, and published datasets, Author provided
https://images.theconversation.com/files/538649/original/file-20230721-21-as2db8.png?ixlib=rb-1.1.0&q=30&auto=format&w=600&h=256&fit=crop&dpr=2
This is another case of high frequency data appended to low frequency data.
150
Is that ground temperature, air temperature, air temperature from a licenced proper sized Stevenson screen, or what.
90
>”This is another case of high frequency data appended to low frequency data.”
To labour the point, in case it’s missed, what I’m alluding to here is scientific fraud:
Kaufman and McKay concatenate disparate datasets – proxy & thermometer.
This was “Mike’s Nature trick to hide the decline”.
Also occurs in SLR papers – relative tide-guages & absolute satellites.
Rather than constraining themselves by scientific ethics, climate scientists are proliferating rampant scientific fraud as a normal Mode of Operation (MO).
40
“Nor in truth am I accustomed to approve of that which we hear from the Pythagoreans who, if what they were claiming was in dispute when they were asked why it would be such a way, have been accustomed to respond ‘he said it himself’; indeed, ‘he himself’ was Pythagoras. To such an extent was an opinion already determined that even without reason the authority was effectual.”
-Cicero, On the Nature of the Gods.
80
Simon >”It probably hasn’t been this warm in 125,000 years. This can’t be proved conclusively but it is likely.”
“Likely”, “suggests”, “probably”, “not much more” – that’s a lot of latitude.
Kaufman:
Okay – “1.5 C (2.7 F) above preindustrial levels”
What EXACTLY is that value in absolute terms – Celsius or Kelvin ?
Where is that published ?
Where does it apply on the globe i.e. what latitudinal bands ?
Tropics is obviously far higher than that level and poles obviously far lower.
60
as is “How we estimate past temperature”
“estimate” meaning: “an approximate calculation or judgement of the value, number, quantity, or extent of something” (OED)
70
I notice the message is that ‘temps have risen 1* from pre-industrial times’. We could also say temps have risen 1* from the little ice age.
Thank Christ!
60
Kaufman >“1.5 C (2.7 F) above preindustrial levels”
This is the “limit” the activists prattle on about but haven’t a clue where it originated or how to apply it in any meaningful way.
It is a political figure, nothing scientific, “plucked out of thin air”:
Climategate 2.0: Jones says 2-degree C limit ‘plucked out of thin air’
https://junkscience.com/2011/11/climategate-2-0-jones-says-2o-limit-plucked-out-of-thin-air/
Phil Jones knew it was flawed from the outset (i.e. how do you apply it?):
In the absence of published values I calculated them myself:
Anomaly “Limit”: 0.77 C above 1981-2010 baseline
Absolute “Limit” = 14.8 C
At this point it gets silly because the “limit” is breached regularly (at least twice a year) but temporarily. At current trends it will take decades to reach that level on a sustained basis.
Meanwhile, the activists like Kaufman above just throw their political “limit” around in complete ignorance and under the assumption that everyone else is as ignorant as they are – we are not.
Even Phil Jones was not that ignorant.
40
>”This is the [1.5 C] “limit” the activists prattle on about but haven’t a clue where it originated or how to apply it in any meaningful way”
When it is applied:
Northern Mid 35 39 Mean: 14.4 C (287.534 K) 0.4 C under
Global Mean: 14.4 C (287.549 K) 0.4 C under
Southern Mid -35 -43 Mean: 14.5 C (287.701 K) 0.3 C under
Northern Polar 60 90 Mean: -8.8 C (264.317 K) 24 C under
Tropics -20 20 Mean: 25.7 C (298.843 K) 11 C over
Southern Polar -60 -90 Mean: -18.7 (254.419 K) 34 C under
35N – 39N and 35S – 43S and thereabouts are the only 2 bands where the Global Mean and global “limit” actually means anything and can be applied. It makes no sense at the high latitudes or tropics (Phil Jones knew that from the outset).
30
>”This is the [1.5 C] “limit” the activists prattle on about but haven’t a clue where it originated or how to apply it in any meaningful way.”
And yet they double down and triple down in increasingly bizarre ways, like this:
‘No one wants to be right about this’: climate scientists’ horror and exasperation as global predictions play out
https://www.theguardian.com/commentisfree/2023/jul/25/northern-hemisphere-heatwaves-europe-greece-italy-wildfires-extreme-weather-climate-experts
Bill Hare, physicist and climate scientist and chief executive of Climate Analytics:
That’s some weapons grade chutzpah – ripe for future reference.
Horrified Bill might try applying his 1.2 C limit to current anomalies. Works out to 0.47 from the baseline here:
GFS 2m-T
http://www.karstenhaustein.com/reanalysis/gfs0p5/GFS_anomaly_timeseries_global.html
That’s where we’ve been living for most of the last decade – who knew?
Also, those observations do NOT comport with Bill’s climate models.
40
“This can’t be proved conclusively but it is likely.”
Oh ok, that’s close enough.
80
2+2 = approximately 5
can’t proved conclusively,
but it is likely
00
Should have just left it at that.
90
https://i.imgflip.com/57w732.gif
10
Aussies Aren’t Engaging with the 43C (110F) Climate Crisis
Essay by Eric Worrall
In Australia we call a 110F top temperature a warm Summer day – so when alarmists tell us these temperatures are a climate crisis, it leaves us Aussies a bit perplexed.
Consider, for a moment, how many words your eyes tend to skip over when you read – if you still do – articles about the catastrophe we are, right now, in the midst of – My list would look something like this: floods; fire; record temperatures; ice melting; mass extinction; bleached coral; 1.5 degrees; 2 degrees; IPCC report; drought; heatwave; tipping point.
There are more, but I’d like you to keep reading.
Please read the following web link for details –
https://wattsupwiththat.com/2023/07/24/smh-aussies-arent-responding-to-the-43c-110f-climate-crisis/
80
Don’t they know it’s summer and Greece isn’t all that far from North Africa and the Sahara Desert.
100
“Floods; fire; record temperatures; ice melting; mass extinction; bleached coral; 1.5 degrees; 2 degrees; IPCC report; drought; heatwave; tipping point” Sometimes we get all those within one summer in Australia. Floods, Fire, Record temperatures, bleached coral, drought, heatwaves are self explanatory to anyone who has lived in this country for at least a year. Ice melting – yep, in my esky. Mass extinction – when all of suburbia cram into the local beach on Australia Day. Tipping point – when my beer is upended trying to take a crowd catch at the cricket. 1.5:2 degrees – I only need to drive 50km north ( in Southern Vic ) to get that temperature difference. Sometimes the other way if its a northerly. IPCC report – who gives a whatsit.
40
BTW here’s the death rates from fires and burns since 1990 for the World, China, NZ, Nth America, Europe, Greece, Australia etc.
Note Aussies have the lowest today although we had a spike in 2009 and Greece deaths are also low, but suffered 2 spikes since 1990.
https://owidm.wmcloud.org/grapher/fire-death-rates?tab=chart&country=OWID_WRL~CHN~NZL~North+America+%28WB%29~AUS~GRC~European+Region+%28WHO%29
31
If you don’t immediately rush out and trade in your current polluter on an EV and renounce all hydrocarbon usage, you are contributing to all this climate mayhem taking place right now.
Better get cracking.
50
At http://tallbloke.wordpress.com/ website July 2 2023 there is an article Sunspot Counts Hits 21-Year High.
Why has none of the experts mentioned this?
70
New Chum, sunspots below but first this at Tallblokes:
Research links climate change to ‘lazier’ jet stream, leading to extreme weather
https://tallbloke.wordpress.com/2023/07/17/research-links-climate-change-to-lazier-jet-stream-leading-to-extreme-weather/
Something I’ve been beating brows with here.
Sunspots spike a lot so don’t read too much into any one number. Current number is 137 which is back down where the last cycle was at end of 2011:
Daily and monthly sunspot number (last 13 years)
https://sidc.be/SILSO/dayssnplot
Neither of these cycles are sustaining levels of SC23 (despite Spaceweather’s hype):
https://tallbloke.wordpress.com/2023/07/06/sunspot-counts-hit-21-year-high/
30
By various channels I have been listening to Tony Heller for years. Every time there’s some climate emergency that is widely reported as being disastrous and “unprecedented”, generally speaking Tony Heller ( or Steve Goddard as he was once also known on Twitter) will publish some historical articles completely debunking these claims. One of those who was kicked off Twitter during COVID, but now back again. He wanted to stay on Twitter/Youtube etc, because then he felt he was talking to the opposite side. He was reluctant to migrate to Parler/GAB/Telegraph/Substack etc because he realised we would be talking to the already converted rebels. By conversing on Twitter, he thinks he has a chance of converting some ” normies” to at least doubters.
90
null hypothesis is it’s natural.
but anti-science global warning inverts the null hypothesis (prove it’s not gonna be catastrophic!)
70
I know this probably doesn’t interest too many here but I just want to link to some of the coldest countries death rates from burns and fires again.
Note Australia’s rate is lower than all of these countries, although we are considered a hot country and suffer from very bad bushfires etc.
https://owidm.wmcloud.org/grapher/fire-death-rates?tab=chart&country=OWID_WRL~NZL~AUS~NOR~Scotland~ISL~FIN~DEU~England~DNK~CAN
90
That’s actually very interesting Nev, worth looking at.
60
[…] Jo Nova writes: […]
10
Did anyone here debunk this yet?
“This lack of spatiotemporal coherence indicates that preindustrial forcing was not sufficient to produce globally synchronous extreme temperatures at multidecadal and centennial timescales. By contrast, we find that the warmest period of the past two millennia occurred during the twentieth century for more than 98 per cent of the globe. This provides strong evidence that anthropogenic global warming is not only unparalleled in terms of absolute temperatures5, but also unprecedented in spatial consistency within the context of the past 2,000 years”
17
It was pre-debunked before it was even published. They don’t mention most of the multiproxy studies that show the MWP was real. No citations for Loehle et al, and Ljundvist and Christiansen. They ignore the 6000 boreholes drilled on every continent. They cite junk papers like Gergis who is still pretending to know the entire temperature of Australia in 1000AD from trees in Tasmania, NZ, plus one stand on the mainland in Victoria. Why do we even need thermometers today in Port Hedland and Broome, just look at a tree ring near Hobart eh? This unfunded blogger does a better lit review than they do.
They use the old hockeystick trick of using exaggerated and adjusted thermometer data (Hadcrut) in the modern warming era to compare to proxy data. Why not use the same proxies all the way through? Did we run out of trees, sediments, stalagmites, corals and clam shells?
101
Nope, they state from the outset their criteria for reliable data and stick to it. They don’t publish hand-drawn, made up scaleless graphs from the north of England and pretend they are global.
02
Still can’t read my blog posts? Hurts too much I suppose. Hubert Lambs graph was drawn from his intimate knowledge of proxies, and the links I provide that you won’t read, show how Lamb was right.
From the post above, like Kyrptonite to the religious acolytes: “The Medieval Warm Period was a global phenomenon, see the graphs, the pollen, the sea sediments and tree rings. And the IPCC knew it in 1990 too.”
Follow the links. Christiansen and Ljundquist used 120 proxies. 6,000 boreholes were drilled on every continent bar antarctica, and we have the ice cores and Southern Hemisphere proxies to show it was global.
30
Did you or them, ever prove such claims were factual and true?
Claims aren’t facts. Have a go at it. The hottest temps on record in US were in 1936. Disprove that.
https://www.wunderground.com/blog/weatherhistorian/the-great-heat-wave-of-1936-hottest-summer-in-us-on-record.html
10
Is possibly the worst argument ever.
01
I see the problem.
A publication available for $5.00 per annum would not have real reporters and editors. They would just have to make stuff up. Now, media spends millions to get real facts for the readers.
{invoking Poe’s Law}
60
ah hah hah hah, ah hah hah hah
80
something to look forward to when we get CO2 down to the medievil levels of 3 part per ten thousound.? Now I know why they want to reduce CO2
70
Temperature maps must look red,
Reports must have climate-change dread,
As media masters,
Push carbon disasters,
Means unbiased reporting is dead.
150
There is also a false data figure
what tosh
18
So,not only has it happened before (including getting so hot granite melted and people hid in caves etc in various locations around the world, it is also long promised to happen again and by the sound of it perhaps even worse than before. As per Rev chapter 16 and with particular attention to versed 8 and 9? That said, I suspect even at that soon coming future time many will still not believe “it is the sun, stupid” but instead continue to blame alleged “big oil” and not having enough windmills and “big batteries” …
50
The comments above and Jo’s piece are focussed on the temperatures in Italy, Greece and Spain. To put some other facts on record I’ve been in SW France since early June staying about 125Km from the Spanish border. The temperature yesterday was 26C and today is forecast to be 29C. The highest temperature since I’ve been here was 31C. The temperatures in the UK and Scandinavia have been slightly less.
In this instance the agonising by the MSM is wildly overdone \
110
Really interesting to know from someone who is there. Thanks Ian. So the media hype is surprising even you?
There must be many people thinking the same as you are in Europe?
90
Ian, I live here about 10 km from the Spanish border on the east side, near the Med and I haven’t met anyone in the village that thinks the temperature is out of the normal, in fact it has been hotter according to the oldest resident – he’s 92 years old and I agree with him and I’ve only been here 30 years.
90
No, it’s real, the planet is burning and oceans are boiling.
Run around screaming and panicking and waving signs.
Hurry, there’s only 100 million years left!*
(* subject to government monthly variations)
Like a hot tub: Water temperatures off Florida soar over 100 degrees, stunning experts
On Monday, as much of the country stewed in bubbling heat, a boiling milestone was hit — a buoy in Florida registered a jaw-dropping 101.1 degrees Fahrenheit (43.3C) water temperature.
This was on the heels of the same buoy in Manatee Bay registering 100.2 degrees on Sunday. For perspective, the average hot tub temperature ranges between 100-102 degrees.
While the readings would’ve been considered a possible outlier or sensor error, surrounding buoys recorded similarly high temperatures, with 99.3F at Murray Key and 98.4F at Johnson Key.
Another reason why these water temperature readings are being taken seriously is the fact that experts have been tracking the exceptionally warm water temperature readings that have ranged from 92-97 degrees since early July.
The water temperatures recorded Sunday and Monday would challenge the record for hottest sea surface temperature in the world. While official world water temperature records aren’t kept, a 99.7 degree temperature recorded in Kuwait Bay is considered the world record at this time. Due to factors like proximity to land and the silty nature of the water, the temperatures recorded off Florida would have to go through an extensive verification process.
According to the National Oceanic and Atmospheric Administration (NOAA), ocean warming since 1991 doubles the size of the marine heat wave forecasted for September 2023.
According to the experimental forecast issued in June, 50 percent of the global oceans could experience heat wave conditions by September 2023.
https://www.msn.com/en-us/weather/topstories/like-a-hot-tub-water-temperatures-off-florida-soar-over-100-degrees-stunning-experts/ar-AA1el7oc
Quick – get Fig leaf to safety. 😁
The 2024 climate lockdowns are coming! Oh hang on, that bit’s real. 😎
10
Hansen did say – “The oceans will begin to boil….”
The Runaway Greenhouse Effect – James Hansen
https://www.youtube.com/watch?v=ACHLayfA6_4
More like runaway nutcase effect.
40
6.4-Sigma Event: Antarctic Sea Ice Hits Lowest Point Since Official Records Began
2023 has gone from bad to worse for Earth’s southern ocean.
In February, climate researchers announced that Antarctica’s sea ice had hit its lowest summer level since satellite records began 45 years ago.
A few months later, in June, during what should be a ‘winter growth phase’, floating sea ice around Antarctica was still struggling to recover.
A time series of sea ice in the southern ocean, put together by climate researchers at the US National Oceanic and Atmospheric Administration, shows July’s coverage is well below where it should be.
Compared to the extent of winter sea ice before 2010, the ocean is now missing about 2.6 million square kilometers of ice – almost four times the size of Texas.
“So it’s five standard deviations beyond the mean. Which means that if nothing had changed, we’d expect to see a winter like this about once every 7.5 million years.”
https://www.abc.net.au/news/2023-07-24/antarctic-sea-ice-levels-nosedive-five-sigma-event/102635204
We’re all doomed to drown!!! 😄
00
Trigger Warning – Michael Mann interview on CBS mornings two days ago.
https://www.cbsnews.com/video/us-will-continue-to-get-warmer-weather-will-become-more-extreme-climate-scientist-warns/
BTW he is pushing a new book.
So the Penn Center is mightier than the sword.
Beware the Jetstream changes.
20
Wonder what the odds makers think of Mann’s claims.
I’d take 7 to 2 that Mann is as wrong as he’s been his entire career.
Nothing he’s ever claimed will happen has ever happened. So he’s a zero .
00
https://www.nytimes.com/1974/10/08/archives/tired-birds-given-a-lift-over-alps-scarcity-of-insects.html
From 1974
More at the link
Too cold for the insects so the birds’ food was in short supply.
20
Speaking of New Speak ….
apparently Net Zero is not enough.
ABSOLUTE ZERO is our new goal.
Being mostly carbon, I’’m getting nervous.
10
1540 has heliocentric analogues in the major heatwave years of 1361, 1757 (Paris), 1936 (US), 2006 (Europe and southwest US)
https://docs.google.com/document/d/e/2PACX-1vQemMt_PNwwBKNOS7GSP7gbWDmcDBJ80UJzkqDIQ75_Sctjn89VoM5MIYHQWHkpn88cMQXkKjXznM-u/pub
10
May I suggest the official theme song for the Cult of Calamitous Climate,be Oh Susanna?
The sheer wilful ignorance required of these cult members is beyond rational contemplation.
Heads so empty need to be used as drums.
On the bright side..If a person buys Catastrophic Anthropogenic Global Warming,they will buy anything..
You owe it to civil society to part these creatures from their wealth,so that they may have much less leisure to impose themselves and their idiotic ideology upon the rest of us.
Take advantage of these foolish fanatics..It is your civic duty.
00