Children won’t know what a cyclone is
Hurricane activity, after human emissions and CO2 levels reach highest ever recorded, is now close to lowest ever recorded.
Based on a trend starting in 2019 major hurricanes may disappear entirely by 2035. What if Net Zero means “no cyclones”?
h/t ClimateDepot and NotalotofPeopleKnowthat
Spot the effect of Chinese coal plants on global hurricane frequency.
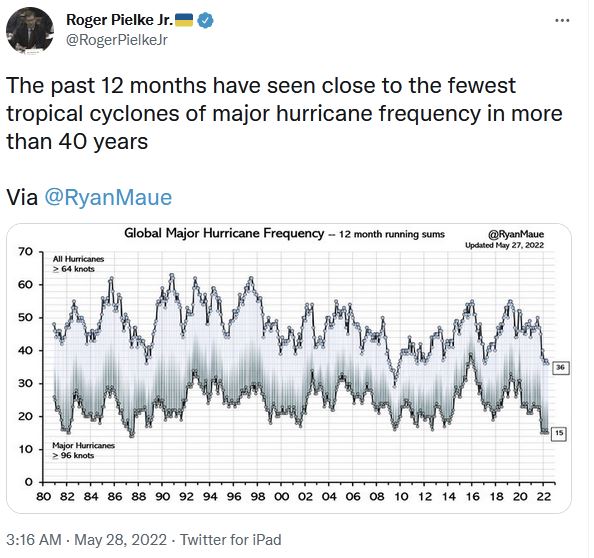
If the situation were flipped, try to imagine that the media would not write headlines like “Hurricanes near highest level ever recorded” and “Signs of Climate change seen in near record hurricane season”, or “Worst Cyclone season for thirty years!
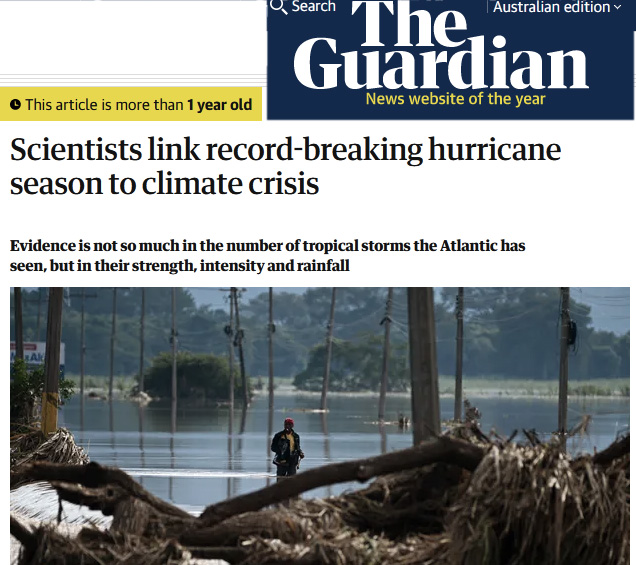
Here’s The Guardian a year ago. But it could have been Forbes, The New York Times, the Washington Post. All of them..
It’s just one more Redpill moment to share with friends.


What you have is the triumph of symbolism over substance, of dogmatism over reality. Maajid Nawaz explains it well!
https://www.youtube.com/watch?v=-Ef1q75tsdY
171
Very good.
30
Wow… so relevant at #1
110
Very relevant, its all about dogma, mantra, ideology… Which is exactly what the AGW meme is.
This funnels directly into the climate glitterati claims of extreme weather, which just isn’t happening !
That is exactly what this whole thread is really all about.
90
Perhaps this trend is more evidence suggesting that the world is really cooling?
Remember, our Sun is a VARIABLE star.
Here is a related video from Tony Heller entitled “Hurricanes Don’t Lie – But Climate Scientists Do”. https://youtu.be/YyGAGYfjHR4 Australia gets a mention.
A cooler world without inexpensive, reliable electricity, internal combustion motor vehicles, no agricultural fertilisers, no anaesthesia for child birth, no plastics, no natural gas, no meat, no long distance travel, no free speech, confused personal identities, no private ownership, smaller houses etc.; all things the Left want for non-Elitists, will be a very miserable place in which to live.
211
No. It highlights that the climate would not be constant from year to year even if humans never existed. Attributing anything to a short term trend is folly.
21
Hi David,
I had an associate who came to the conclusion 10 years ago that anything ‘eco’ was miserable.. he was agnostic.
Misery however is a matter of faith – or rather the lack of it.
I tell you that if we have a great enlightenment of Bible reading misery will depart in the blessings of freedom and arguments that come. BUT if all about us have no faith in God at all they will be miserable, whether with nice things or without. They are already so miserable they want all to be miserable with them. We defeat the misery of tyranny by the joy of hope. Shed hope all over! Throw off their way of thinking! Let the so called miserable elites have no power over your mind!
31
If we look at the Guardian headline in a truly scientific manner then it’s necessary to break it down into its components.
First there’s an assertion of truth and undeniability in the use of the term “Scientists”: nobody may question a scientist and you definitely can’t question a panel of them.
The Big G then goes on to the core frightener, the “record-breaking Hurricane season”; they’re on a winner here, nobody wants their home demolished by one of those.
We are then led to the core of the article, “Climate Change”.
Scientific analysis of the headline could perhaps lead to a few questions which challenge the purpose of the article and ask what forces are behind the attempt to link our fears to the scourge of “Climate Catastrophism”.
It may well be that The Big Green G has a mission statement devised for it by their financial backers and controlling Elites.
We need to ask why is the G pumping public fear of Climate Change, surely it’s not about control of the taxpayers and their Money?
KK
160
the Aussie Bureau of Meteorology has a plot of yearly “severe” and “non severe” cyclones since 1970 here:
http://www.bom.gov.au/cyclone/tropical-cyclone-knowledge-centre/history/climatology/
Make what you will of the babble below the figure, it just seems like there is ongoing work to change definitions because….”climate change”… but perhaps I am overthinking it.
50
See my reply below.
20
Maybe I’m wrong but I’m sure that cyclone categories have changed. A cyclone 1 category use to be 95-120 mph wind speed (gusts higher) but lately I have seen Cat 1 at 63-88kmph. Were we originally using the Saffir-Simpson and now use the Australian Tropical Cyclone Intensity Scale?
100
Additionally, increases in storm surges and extreme sea-levels are very likely to occur in association with tropical cyclones under future climate change. This change is independent of changes in tropical cyclone intensity and is directly related to increases in global mean sea-level due to global warming.
Gee, I suppose they had to find a (false) negative amongst the good news!
30
James Murphy and Ian George , if you truncate the BoM Australian cyclone series to the year 1979 allowing for the Bureau of Meteorology’s stated caveats of storm classification alterations and more accurate satellite coverage – or sophistry if you prefer – the same result is observable : a distinct decrease in severe and non severe cyclones .It makes no difference .The question abides, however, as to why the BoM has not acknowledged the trendline is the same whether chronology is plotted from 1970 or 1979 in the accompanying text…..When Bill Shorten was shown the declining trendline Australian cyclone chart by Andrew Bolt in a 2019 interview , he scoffed and replied he had his ‘own graphics ‘. Shorten and the Labor Party either have a low regard for the cyclone data compiled by Australia’s premier meteorological agency or they know the truth that as the world has warmed northern Australian cyclonic activity has decreased .
One more thing Jo if you happen to read this : examine Ryan Maues Global Hurricane Frequency series and consider the correlation of hurricane activity peaks with with historic El Nino events – including El Nino split years For example : 1983; 1986; 1991 ; 1997-98 ;2016 ]
20
Thanks, Hamish.
Another complication to the redefining of cyclone categories has been the use of satellites to measure wind speed. Going back, cyclone speed was measured by land or ship based anemometers. Naturally, there is a discrepancy between the land based anemometer readings and the Doppler. For instance, the satellite measured Cyclone Debbie as a Cat 4/5 but the highest land-based measure was only 132kmph at Middle Percy Island.
By changing cyclone intensity definition and using Doppler, the BoM still haven’t managed to show an increase in cyclone activity (at least in landfall activity).
I’m a bit of a novice in this, so any thoughts/corrections would be welcome.
10
I am a novice too . Certainly no expert .If you want to understand what fates befall the honest hurricane experts and meteorologists reflect on what happened to Bill Gray when he crossed Al Gore .
One can pick any juncture in the BoM cyclone series up to 1980 and the declining trendline is the same. The wind velocity power of a cyclone can be calculated by the recorded damage it inflicts on trees , landfall storm surge deposits and oxygen 18 isotopic residues in coastal cave sedimentary strata. The journal Nature Communications published a paleo-tempest research paper in 2014 that revealed current northern Australian cyclone activity is the WEAKEST phase over the past 500 – 1500 years. In plain language and thinking logically, this means northern Australian cyclones were more frequent and destructive during the Little Ice Age and the Late Antiquity Cold Period than the modern warming era. Interestingly the BoM satellite data corroborates this research : cyclones were more prolific in the 1970s and 1980’s when temperatures were cooler than the warmer 21st century. Roger Pielke’s extended Atlantic – Western Pacific hurricane [ the Atlantic and Western Pacific basins account for approximately 70% of global hurricanes ] chronology dating back to 1945 clearly shows hurricane activity was more severe before 1970.
20
In 1971, Cyclone Althea hit Townsville as a Cat 3 – winds were recorded at 196kmph. Under the new cyclone classification it would rate as a Cat 4/5. I need to look into the data to see if this cyclone has been upgraded, as well as earlier cyclones, to fit the new category or not as it compromises the whole data set.
00
Strange isn’t it. I questioned the cyclone deficiency on this site just last week.
This subject I believe was another of Tim Flannery, “the big Mammary” and his ilk’s doomsday propaganda!
We were to blown away by almost daily cyclones, but even the ABC couldn’t stir the global warming gods to adhere to the narrative.
So far this year I think the closest hurricane was about 1000km off shore. The media half heartedly report on some large swells that resulted much to the delight of our surfing addicts. “Fortunately” they were able to report on the rain that would never fill our dams again???😱😱😱. Something is not adding up!!😂😂
110
I can only find three landfall cyclones (Aust) for the past cyclone season (2021-2022).
Cyclone Seth – Cat 2 but winds 110kmph (Qld, NT)
Cyclone Tiffany – Cat 2 but winds only 95kmph. (Qld, NT, WA)
Cyclone Anika – Cat 2 but winds only 95kmph. (NT/WA)
All these would have been rated as Cat 1 in the past.
All the other cyclones did not make landfall in Aust. Highly unusual in a La Nina period.
60
They can still play word games like headlining with “Worst Year for Cyclones in 60 Years!!” – but secretly meaning if you’re a cyclone, you got very little work over the year.
20
Referring to the quotes below, it looks like they are giving themselves plenty of opportunities to change the downward trend into an upward one. And they haven’t even got around to “homogenising” the data yet…
Their fake modeling with the invalidated models shows an expected increase in “higher intensity stotms”. Expect them to change the raw data to conform with their fake global warming “models”.
40
That was meant to be a reply to James at #4 above.
10
This is pretty standard BOM code speak, it can be deciphered quite simply.
1, The time series of analysed tropical cyclone activity in the Australian region (south of the equator; 90-160°E) show that the total number of cyclones appears to have decreased. However, there was a change to the definition for tropical cyclones in 1978 which led to some systems which would previously have been classified as tropical cyclones instead being considered sub-tropical systems
This translates to cyclones have decreased since 1978
2, The number of severe tropical cyclones is dominated by variability with periods of lower and higher frequencies of occurrence. There is less confidence in the earlier intensity data with continuous satellite coverage commencing in 1979.
This translates to natural variability dictates frequency of severe cyclones and as such will vary with intensity over time, ergo the decrease we are now seeing could be due to natural variability. We dont have confidence in the pre sat data which is why we only look as far back as 1978.
3, There is substantial evidence from theory and model experiments that the large-scale environment in which tropical cyclones form and evolve is changing as a result of global warming. Projected changes in the number and intensity of tropical cyclones are subject to the sources of uncertainty inherent in climate change projections. There remains uncertainty in the future change in tropical cyclone frequency (the number of tropical cyclones in a given period) projected by climate models, with a general tendency for models to project fewer tropical cyclones in the Australia region in the future climate and a greater proportion of the high intensity storms (stronger wind speeds and heavier rainfall).
Translation, There is non empirical (model) evidence to suggest AGW will cause more severe cyclones but because reality does not match our model fantasy world we have no idea what is coming next.
50
‘However, there was a change to the definition for tropical cyclones in 1978 which led to some systems which would previously have been classified as tropical cyclones instead being considered sub-tropical systems’.
Is there any actual proof of this as my limited research shows that it was the other way around – under the new definition intensity levels dropped so a Cat 1 cyclone wind speeds were 63-88kmph where as before it was around 95-120kmph.
And the use of the satellite Doppler system to measure a cyclone will make a cyclone seem more intense than the normal land- based wind measurements.
00
And the line I love is
WTF – since when are theory and model experiments evidence
70
A tropical cyclone just hit Mexico.
https://reliefweb.int/report/mexico/mexico-tropical-cyclone-agatha-update-gdcas-government-oaxaca-smn-media-echo-daily-flash-1-june-2022
10
Interestingly, Mexico is at the “in-between” zone of where a rotating tropical storm is called either a hurricane or typhoon, or a cyclone. Some are calling it a hurricane, others a cyclone.
40
“It’s just one more Redpill moment to share with friends.”
Nope, won’t work in my world.
Somethings happened to the culture.
There is reality and Narrative Reality.
Those that believe Trump ‘colluded’ with Russia, and the laptop was Russian propaganda.
There are those that believe that Trump said things, and when shown proof that he did not, say ‘well he meant to say it’.
There are those that believe Jan. 6th was’ insurrection’, and burning cities was ‘peaceful protest’.
Those that believe men get pregnant … and then call the other side anti-science.
I’m talking about 99% of neighbors and friends, all with post college level educations.
Trump and ‘pandemic’ drove them mad.
The discourse phase has passed.
140
It’s a characteristic of the beliefs of the Left that there is no such thing as objective reality. Reality is whatever you “believe” it is. This was particularly highlighted in Matt Walsh’s latest documentary called “What is a woman”, but I plan to say more about that in the next open thread.
70
It’s not a secret that needs to be disclosed David …. this has been around for decades in sociology ….. it’s your standard post-modernism….
30
Agree entirely. No remaining family or friends with any insight. Much more isolated existence, though not entirely unhappy with that.
Add to the above “Covid vaccines are safe and effective”, “Lockdowns kept us safe”, and a “Welcome to Country” ceremony for every minor event.
70
Doc T,
how, or why, do you think you avoided becoming one of THEM? 🙂
(You know what I mean by THEM, right?)
Did you think vax was ok then have a revelatory moment?
Or do you you’re just one of 20% or so of folk immune to mass hysteria, according that Belgian guy the studies mass formation.
He says it has nothing to do with intelligence or education level.
I’m on the opposite end of that curve from you, but was suspect of the Demic from get go.
20
Does a decrease in hurricanes and cyclones have implications for a drought of wind in general?
If so, what happens with all those weather-dependent windmills?
What could possibly go wrong relying on the weather for your electricity?
I guess that’s why our ancestors rapidly abandoned weather-dependent power sources such as windmills and sails as soon as the reliable steam engine was developed.
101
Actually when it was possible they abandoned wind mills earlier. Brittany has big tide ranges, up to 14 metres.**
In the seventeenth Century tide mills were installed, capturing high tides and releasing them at lower tide time. The hours they worked changed but the main point was that they WORKED RELIABLY twice a day.
**It is a bit discerning to see boats sitting on the mud and wondering why they were inside a breakwater, and come back a few hours later to see them all afloat and the breakwater covered by the sea.
60
Also to add that in the Aussie region the only year with NO SEVERE cyclones was 2015 to 2016 season.
And definitely a LOWER trend for all cyclones for 50 years in our region. WAKE UP.
As Andrew Bolt has pointed out repeatedly over the decades and again this last week….. “there’s no climate crisis BUT we do have an ENERGY CRISIS”.
http://www.bom.gov.au/cyclone/climatology/trends.shtml
70
The graph illustrates that severe cyclones are not increasing, so their argument that TC will become more severe in the future looks doubtful.
20
The Left / anti-energy lobby have a bizarre belief that the climate is static and unchanging.
When has it ever been that way, even in recorded history, roughly the last 5000 years?
50
Wasn’t there a report from NOAA recently that admitted they were wrong about CO2 causing more hurricanes?
20
Depends on what you term as air pollution but here is the report .
https://research.noaa.gov/article/ArtMID/587/ArticleID/2874/Study-Reducing-human-caused-air-pollution-in-North-America-and-Europe-brings-surprising-result-more-hurricanes
30
‘ … increased greenhouse gases will become a more significant influence on tropical cyclones. The projection is for fewer numbers of tropical cyclones, but those that occur are likely to be more intense.’
That is the general argument, but it is flat out wrong. Blaming Chinese pollution for the lack of hurricanes is cute, yet fails to explain why tropical cyclone numbers are also down.
50
As TDef used to say, they couldn’t even get a single prediction right even by chance.
50
AGAIN here’s the REAL WORLD data for deaths from natural disasters since 1900.
The high point was 1920 ( population then just 1.8 billion) and a huge drop today and the big killers in early decades were droughts and floods.
Today we have 7.9 bn people YET extreme weather deaths have dropped by 95% and 2021 was under 7,000 deaths according to Lomborg’s expert team.
Here’s the graph of the data since 1900 and that huge drop in deaths is close to a modern miracle. Yet we still have stupid, delusional donkeys telling us we have a climate crisis?
https://ourworldindata.org/grapher/decadal-deaths-disasters-type?country=~OWID_WRL
50
Not much of an “existential crisis” in that data…
20
So all those climate change alarmists Nostradumases got it completely 180° WRONG. For years they’ve been preaching more storms, less rain less snow, but the exact opposite is happening. Because of the likes of Flannery ,Mann , Bob Brown and all the other alarmists, they influenced the Western government’s to unreliable renewables. Now we in the gullible West find ourselves with sky-rocketing power prices and our energy generation falling over a cliff. They all should be held to account for the damage they helped to create. Sue them all for damages, every alarmists NGO and political activists.
80
As Thomas Sowell said:
70
Here’s another graphical way to check natural disasters deaths since 1900 to 2020.
You’ll note that the last decade 2010 to 2020 deaths were very low and 2021 ( not shown here) could be the lowest global death count on record. Will we ever WAKE UP?
https://ourworldindata.org/explorers/natural-disasters?facet=none&hideControls=true&Disaster+Type=All+disasters&Impact=Deaths&Timespan=Annual&Per+capita=false&country=~OWID_WRL
40
There is plenty of evidence from the Newspapers of the day that show that tornados in the Tornado States of the USA were much worse in the 1930s than they have been this Century. A simple web browser search would enlighten all those Climate Alarmists who are shouting – “The sky is falling in – Panic, panic, panic”. Will they open their eyes and minds?. No chance’
70
‘During La Niña years, the east to west trade winds blowing across the equatorial Pacific strengthen. These effectively push rain systems westwards and raise the chance of flooding, and also lift relative sea level in the western Pacific. Such years also tend to have more cyclones than usual.’ (BoM)
That is not happening, La Nina like conditions produce less severe cyclones.
50
LISTEN
In the Southern Hemisphere Cyclones only form in two regions.
FIRST: The Coral Sea
SECOND: THE Northern Indian Ocean.
In both cyclones form and travel towards Australia. Why because of land mass proximity, ocean currents and winds.
Key it water temperature.
Cyclones only form when surface water temperatures reach and exceed 27.5 degrees. t
Cyclones dissipate when water temp and/or land temp falls below this temp.
Clear?
Currently, and for the ,east three years the coral sea temp has not reach this temp. NB the far north west Coral sea around East Papua is an exception.NB minor cyclones have formed there and travelled Across the tip of Cape York and dissipated in the Gulf.
The reason the Coral Sea has cooled is because The Sub Equatorial Current running Into it from South America has cooled. The reason the Sub Equatorial Current has cooled is because the Humbolt Current running into from The Southern Ocean and up the West Coast of South America has cooled.
The Southern Ocean hasn’t cooled BUT Antarctic (the continent) and the Southern Ocean Currents flowing into the Humbolt current have ALL moved Eastward and are now closer to the Humbolt and South America, PlUS Antarctica its Expanding.
Something much more complex is occurring in both the Southern Indian and Northern Indian Oceans and here is too confimed to give a description of the factors causing the cooling in this ocean.
40
You’ve missed something rather important.
Cyclones are sun storms. They are ccreated by the solar wind at the top of the atmosphere.
The sun is snoozing —it’s in a low energy state — so it’s solar wind doesn’t have sufficient energy to create lots of cyclones.
(low vorticity).
It’s also why it’s not making heaps of spots.
40
Ah sophocles, ye live!
2021/22 was a let-down for cyclones in these parts – Gisborne & the East Cape aside. Am now up in the Far North enjoying the mythical ‘winterless north’ – so far so good – trade winds interspersed with cool SW changes then back to semi-tropical trades. This season’s cyclones were either still-born or never fully developed, thanks to CCC™ and/or CO2.
Long live La Niña!
20
Hi Greg.I’m preparing to dodge tornadoes … I have family in Taranaki and they’re already nervous. Taranaki is just a bit north of Levin — not quite walking distance.
I’ve always been here, and I’m laughing at all the rubbish being flung around. It’s amusing. La Nina will be a fixture over the rest of this decade as the climate slides down into the GSM.
Mr. Kenelly: You forgot Fiji and Kiribat … cyclones form there, too.
I’m glad you’ve never invited me sailing …
I’ve commented on cyclonic storms in previous entries of the blog — up to 2019 or so. Jo keeps all the older blog articles archived, so look through the archives for what I’ve posted on cyclones. I can’t be bothered doing it all again.
Go to suspicious observers and download the references list for their Weatherman’s Guide to the Sun 3rd Ed, and look through it. Paul Prikryl is a reasearcher and you can get at some of his writings to learn from them.
20
Sophocles and Greg.
Wrong.
The Earths thermostat are the polar regions and the currents of cool water flowing from them into the great ocean currents distribute cooler waters into the oceans surface and affect their temps.
That is mostly where weather comes from.
I have no formal education but I am a solo ocean mariner. I make my on forecasts from data supplied from the the US Military Satellites. I have extensive experience in understanding the weather and its influences. I can say my predicitions, on which my life may depend, are ALWAYs far better than any of the better educated fool climate scientists and weather forecasters.
50
Here we see a collision between cold waters and a heat engine, the Western Pacific Warm Pool.
https://earth.nullschool.net/#current/ocean/surface/currents/overlay=sea_surface_temp_anomaly/orthographic=-206.87,-4.66,2120/loc=154.219,-4.906
10
‘ … Humbolt Current running into from The Southern Ocean and up the West Coast of South America has cooled.’
During El Nino the upwelling from the Southern Ocean is disrupted, so when the waters are cool it means the system is working ok.
Its also worth noting that the ‘upwelling is produced due to the displacement of the subtropical center of high pressure during the summer where cold, nutrient-rich waters are brought to the surface and they drive the system’s incredible productivity.’
…. and these days its called the Peruvian Current.
10
But the kids don’t get taught to search for data and to interpret it any more, they get indoctrinated to copy Greta Thunberg and lecture big corporations about their “unethical” funding of fossil fuel energy sources. All the while recording themselves on their iPhone using said energy…stupid fools…
51
Here’s a list of the 10 deadliest tornadoes to hit the USA since 1900. BTW their population in 1900 was about 76 million, in 1950 about 151 mil, in 2000 about 281 mil and 2010 about 308 mil.
Yet today the only deadly tornado was in 2011 and much deadlier tornadoes in the earlier years when their population was smaller. So therefore a huge drop in deaths per million over the last 50 or more years.
Note this is data from NOAA.
https://mynorthwest.com/3277727/list-of-deadliest-tornadoes-in-us-since-1900/
List of deadliest tornadoes in US since 1900
Dec 10, 2021, 8:10 PM | Updated: Dec 11, 2021, 10:59 am
Share
BY ASSOCIATED PRESS
A list of the 10 deadliest tornadoes in the United States since 1900:
— 695 deaths. March 18, 1925, in Missouri, Illinois and Indiana.
— 216 deaths. April 5, 1936, in Tupelo, Mississippi.
— 203 deaths. April 6, 1936, in Gainesville, Georgia.
— 181 deaths. April 9, 1947, in Woodward, Oklahoma.
— 158 deaths. May 22, 2011, in Joplin, Missouri.
— 143 deaths. April 24, 1908, in Amite, Louisiana, and Purvis, Mississippi.
— 116 deaths. June 8, 1953, in Flint, Michigan.
— 114 deaths. May 11, 1953 in Waco, Texas.
— 114 deaths. May 18, 1902 in Goliad, Texas.
— 103 deaths. March 23, 1913, in Omaha, Nebraska.
_____
Source: National Oceanic and Atmospheric Administration
60
Gee, it almost looks like people in the olden days lived in poorly built houses and did not get warnings about approaching storms.
112
Data is an anathema to you, isn’t it GA.
60
It’s water, not failed building structures that causes most fatalities in hurricanes and tropical storms in the US.
https://weather.com/safety/hurricane/news/us-deaths-hurricanes-tropical-storms-nhc-study
40
The data above are tornadoes not tropical storms. Maybe you meant this to be nested directly under the main article?
18
Tropical cyclone energy also low.
Absolutely zero evidence of any human influence.
https://climatlas.com/tropical/global_running_ace.png
30
The Sun was a lot stronger in them thar “olden” days than it is today. The sun spots the sun is making this cycle are just damp squibs … if that. If you have access to the sun’s remote control, then it could be fun 😀
00
Quite the passive aggressive aren’t you ‘Gee Aye’ ?….. The United States tornado count exhibits a decreasing trend [ As the does the tornado fatality register ] So too the BoM Australian cyclone series and the global major hurricane frequency dataset …..
Where is the evidence for this escalating ‘climate emergency ‘ ? Much like George Orwell’s ‘Comrade Ogilvy in 1984 no such crisis exists but it would necessary to invent it Have you learned more about what it means to be Woke ?
20
ga is being very “unlucky” with its posts lately.
Finding this forum is not its “safe space” 😉
20
I hereby predict that all predictions, including those for Climate Change, but excepting my prediction, are fraught with danger and gross exaggeration/error.
50
Volcanic eruptions ruled out for decreasing TC activity.
‘Finally, there is no robust and consistent reduction in recent TC activity following recent volcanic eruptions in a large set of synthetic TCs downscaled from these simulations. Taken together, these results show that in recent eruptions volcanic aerosols did not reduce global TC activity.’ (Camargo et al 2019)
40
but… models
29
Yep, even climate models can’t find a link ! 😉
40
Eliminating the excuses for a reduction in TC, there isn’t much out there.
The general argument is that there will be fewer tropical cyclones in a warmer world, but they will be more severe. Do you think that is reasonable?
30
Oh no! What can we do to save the cyclones? I don’t want my grandchildren to grow up never knowing what a cyclone is like.
51
I feel left out.
Yes, have been in strong winds.. but never a cyclone 🙁
40
If you live on the Australian East coast, the next time you see an EAST COAST LOW form off Hervey Bay, Coffs Harbour or the Ilawara (Just Sth of Sydney, travel there and you’ll experience the sustained winds, wind gusts and horizontal rains of cyclonic conditions. The Lows are cyclonic in nature.
10
Grew up in southern Sydney (Cronulla/Sutherland).. know exactly what you mean 🙂
Never got caught in one of them , though.
10
LOL. Go to the Philippines, Japan, Hong Kong, Taiwan or the Chinese coastal regions and experience a Typhoon. Not too sure whether they are decreasing in frequency/intensity or not but they keep happening.
00
Wasn’t it that dolt Trenberth that said..
” “Trends in human-influenced environmental changes are now evident in hurricane regions.” “
LOL !! How did that work out for him 🙂
30 year ( climate period 😉 ) downward trend since 1992
60
All the hurricane experts have been saying for decades that there’s no evidence that global warming will make cyclones/ hurricanes worse. Like Roger Pielke Jr, probably the most reliable expert in the field. All the actual real world data actually indicates this. The problem lies with the IPCC. Because their personnel believed cyclones/hurricanes will get worse mostly because climate models predicted it. Here’s’s the circular logic which is almost as scary as a cyclone. IPCC personnel believed cyclones would intensify because models programmed by people who believe they’ll intensify, told them so. One of those personnel being our own David Karoly, who is still employed at CSIRO-or at least he was, up until a few years ago. He co-authored one of the 2007 IPCC chapters where the conclusions didn’t quite exactly match the data. Caused quite a storm – excuse the pun. So, the “fact” hurricanes (cyclones) will get worse, will still get a run. Those lovely Teal ladies probably all believe that to be the case, I’m sure.
41
Risk Assessment Solomon Islands, organised by Australian Aid, see a rosy future.
‘The proportion of the population affected by future tropical cyclone risk is projected to decrease compared to the current climate.
‘Maximum wind speeds produced by tropical cyclones in the Solomon Islands are projected to decrease slightly in the future climate.’
20
I’m pretty sure the Philippines recently got knocked out fairly savagely by a typhoon. Or was that CGI?
30
” the Philippines recently got knocked out fairly savagely by a typhoon . Or was that CGI “?
That one typhoon struck one Pacific island archipelago in one year is meaningless outside the hipster-sphere . The Japan Meteorological Agency has catalogued Western Pacific typhoons since the 1950’s and the trendline is downwards. In the case of super typhoons – indeterminate . Do you appreciate historical perspective and understand the implications of a downward trend Zane ? https://notalotofpeopleknowthat.wordpress.com/2022/01/05/western-pacific-typhoon-trends/
10
I thought the climate wars were over but I guess there is no end to the fanaticism of the climate change deniers.
The premise seems to be: Cyclones have decreased, therefore climate change is a hoax.
Let me try basic logic: The premise may be true, but the conclusion does not follow.
Furthermore it requires you to ignore all the evidence of floods, droughts, heatwaves and fires from places all over the world.
Thankfully your deluded influence on Australian politics is now finished. Enjoy your right-wing News Corpse information bubble.
04
Lovely to hear from you John. Stick around, you will get a surprise. The premise is that long term trends matter and the models are wrong on nearly all of them. You must have missed this post a few days ago. Here’s the list:
Everyone who has met a skeptic knows climate models can’t predict the climate on a local, regional, or continental scale, they don’t know why global warming slowed for years, they get the core assumptions wrong – the hot spot is still missing, (that’s the only fingerprint they said mattered, right up until they couldn’t find it). They can’t explain the pause, the cause or the long term historic climate movements either. Measurements of satellites, cloud cover changes, 3,000 ocean buoys, 6,000 boreholes, a thousand tide gauges, and 28 million weather balloons looking at temperature or humidity can’t find the warming that the models predict. In the oceans, the warming isn’t statistically significant, sea-levels started rising too early, aren’t rising fast enough, aren’t accelerating, nor are warming anywhere near as much as they predicted. Antarctica was supposed to be warming faster than almost anywhere but they were totally wrong. The vast Southern Ocean is cooling not warming. The only part of Antarctica that’s warming sits on top of a volcano chain they prefer not to tell you about.
Some scientists are also behaving very badly: hiding data, declines, history, adjustments and methods. But thousands of other scientists are protesting all over the internet.
Twenty years ago the climate modelers mocked some skeptics for talking about “every cold weekend” and said only 30 year trends mattered. Now that the 30 year trends are nothing like what the models predicted they claim every bushfire and hot weekend is climate change. And we mock them mercilessly while we quote the long term trends they fail on.
I used to believe in catastrophic man-made global warming too. I should have noticed that “climate denier” was just namecalling.
60
How is Maue’s hurricane frequency chart a manifestation of climate change denier fanaticism John Perkins ?
Your assertion ” the premise seems to be : cyclones have decreased therefore climate change is a hoax ” is a ridiculous Straw Man and you have not followed with any ‘basic logic ‘ .No one that I know of has made any such ‘conclusion ” that climate change is a hoax [ which indeed it is not ] based on the updated global hurricane index. You invented it
10
No friend, the climate wars are, not over.
They haven’t started yet.
They’ll start when grids collapse, and energy prices go so high, food becomes unaffordable, and the average person realizes the Green ‘cheap’ energy agenda was a lie and they don’t like bug salad.
They will own nothing, be hungry, and not happy.
Then you might get to the war stage.
You ain’t seen fanaticism yet.
May your bubble protect you.
20
LOL.. we all know who the delusional brain-washed twerp is.
There is actually very little trend in global floods, fires (downwards trend, btw) or anything else.
There is absolutely no evidence of any human CO2 caused “climate emergency” except in fake IPCC models.
Reality is that climate is pretty much normal, if not somewhat benign, and well within natural variability.
…. albeit, very much on the cool side compared to the last 10,000 years
20
“climate change deniers”
There are no climate change deniers here.
Please tell us what we “deny” that you can produce real scientific proof for. (that means you actually have to produce that proof)
First you will need to define what the word “scientific” means.
[wee edit. – LVA]
20
Interesting words from one Nassim Taleb:
“It suffices for an intransigent minority –a certain type of intransigent minorities –to reach a minutely small level, say three or four percent of the total population, for the entire population to have to submit to their preferences. Further, an optical illusion comes with the dominance of the minority: a naive observer would be under the impression that the choices and preferences are those of the majority.”
30
So 3 or 4 percent make 100% of the noise and drown out the 96 to 97 percent? That sounds about it these days…………
20
The tail that wags the dog, what’s new?
The green/teal element can bully their way far beyond what is justified by their actual numbers in proportion to the whole population.
00
CO2 warming can be excluded !
https://notrickszone.com/2022/06/02/royal-society-scientific-method-application-shows-the-perception-co2-causes-global-warming-can-be-excluded/
40
This is an interesting thread.
I have a high opinion RP Jr. and his Dad.
The contrast between RP Jr., one of the Obama Scientists hit list victims, and the Guardian, is an example of the very serious fissure in western culture.
(I think it was the only father/son team on the hit list.)
The reduction of Cat 1 standards is revealing.
Like the redefining of ‘vaccine’.
20
From 1978 to 1986 I ran tourist boats in the Whitsunday Islands. We had 5 cyclones through the area in those 8 years.
Cyclones were so regular we expected to get one each year. So much so that each year we marked the varying channel through the mile wide mud flat to guide our boats into a chosen mangrove creek at high tide to shelter them in the creek.
Not so regular today.
20
It’s all cause and effect. Yes, there is a slight global warming going on at present (otherwise known as the MODERN WARMING PERIOD). And yes, this means that glaciers are warming etc etc. But these phenonema happen no matter what the cause is, and it certainly isn’t the level of CO2 in the atmosphere.
00
[…] https://joannenova.com.au/2022/06/where-have-all-the-cyclones-gone-global-hurricanes-quietest- in-last-30-years/ […]
00
[…] https://joannenova.com.au/2022/06/where-have-all-the-cyclones-gone-global-hurricanes-quietest- in-last-30-years/ […]
00
[…] https://joannenova.com.au/2022/06/where-have-all-the-cyclones-gone-global-hurricanes-quietest- in-last-30-years/ […]
00