It’s the usual apocalyptic headline, hyped from a press release smoked out of a Nature paper, which was pumped from a climate model:
“Climate change already causing storm levels only expected in 2080”
An Israeli study published on Thursday found that climate change is already causing a “considerable intensification” of winter storms in the Southern Hemisphere to a level not anticipated until 2080.
It’s bleak I tell you:
“New data reveals climate change might be more rapid than predicted”
In the new study, Chemke and his team compared climate model simulations with current storm observations. Their discovery was bleak: It became clear that storm intensification over recent decades has already reached levels projected to occur in the year 2080.
Yet again we see true mastery of confirmation bias at work: When the climate models underestimate things it means doom is coming faster. When they overestimate things, it means the equipment is faulty. What would 28 million radiosondes know?
There must be 1,000 permutations of climatoid factors that could be measured across regions of the Earth, but Lo — there has been an intensification of Winter Mid-Latitude Storms in the Southern Hemisphere! Not summer storms, spring storms, or Atlantic Storms or Atlantic Tropical Autumn storms, or Pacific Eastern high latitude Westward events (as far as we know) but roll the dice, some of them will turn up snake-eyes too! (Where is my grant?)
As far as I can see, this is a good example of Neolithic tea-reading type science — equivalent to studying the trails of the scribbly-bark beetle and forecasting that the Blinking Star will eat Neptune before the next full moon.
These are short term trends within the noise envelope, but good enough for a Nature paper, and a press release:
What if there was, say, a natural 60 year trend in there? Who would know?
…
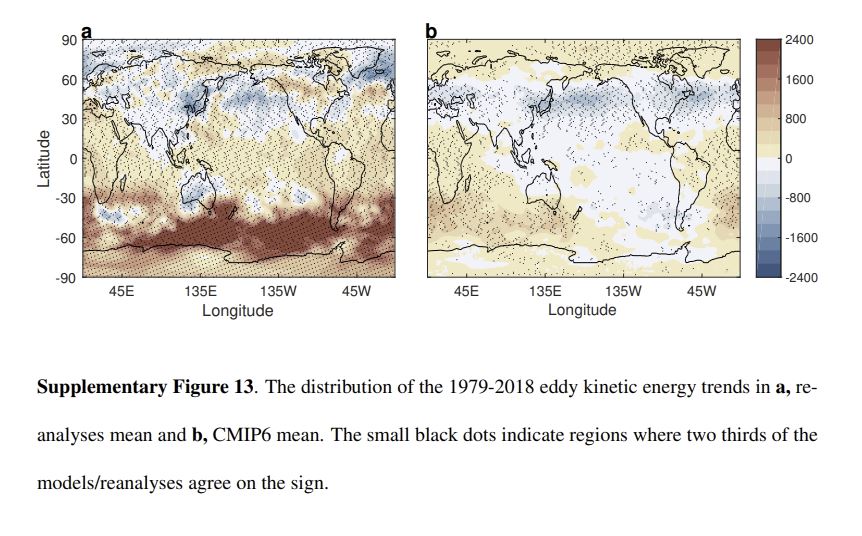
I notice in the Supplementary section the captivating graph below. Part A, apparently, is the observed trend, and Part B the modeled trend, which don’t look too similar to me. The caption has the immortal words:“The small black dots indicate regions where two thirds of the models/reanalyses agree on the sign.” On The Sign! Unless I’m reading that wrongly, they’re excited about the dot points where two out of three models guessed whether the trend was up or down. It’s that bad. In most of the Pacific apparently nearly 70% of models looked at “climate change” and couldn’t even guess the direction right.
Indeed, the models are so wrong in the Pacific, perhaps it’s significant?
Click to enlarge.
Phys-Org gushes like David Attenborough was let loose in “software biology”:
About 30 massive, intricate computer networks serve the scientists who stand at the forefront of climate change research. Each network runs a software program comprised of millions of lines of code. These programs are computational models that combine the myriads of physical, chemical and biological phenomena that together form the climate of our planet.
What is Truth but “millions of lines of code” eh? What could possibly go wrong (apart from things like the G.F.C.)?
We’re there at 2080 already!
In the new study, Chemke and his team compared climate model simulations with current storm observations. Their discovery was bleak: It became clear that storm intensification over recent decades has already reached levels projected to occur in the year 2080.
Spot the bias anyone? We studied this part of the world because it showed what we wanted to find?
“We chose to focus on the Southern Hemisphere because the intensification registered there has been stronger than in the Northern Hemisphere,” Chemke says. “We didn’t examine the Northern Hemisphere, but it seems that the intensification of storms in this hemisphere is slower compared to that in the Southern Hemisphere.
If any taxpayer funds were harmed in this report, we want them all back. This is non-stop agitprop:
Chemke, Ming and Yuval’s study has two immediate, considerable implications. First, it shows that not only climate projections for the coming decades are graver than previous assessments, but it also suggests that human activity might have a greater impact on the Southern Hemisphere than previously estimated. This means that rapid and decisive intervention is required in order to halt the climate damage in this region. Second, a correction of the bias in climate models is in order, so that these can provide a more accurate climate projection in the future.
It’s new low in scientific spin. Modelers don’t usually just lie straight out like this:
Could the climate models be inaccurately predicting other important phenomena? “The models are doing a very good job at forecasting nearly all the parameters,” Chemke says. “We’ve discovered one parameter for which the sensitivity of the models needs to be adjusted. Changes in temperature, precipitation, sea ice, and summer storm patterns, for example, are all being simulated accurately.”
For what it’s worth, Rei Chemke only finished his BSc in 2012, and his PhD is all “climate science”. It’s more a case of Kool Aid over-exposure for a young guy that has probably never met a skeptic.
Everyone who has met a skeptic knows climate models can’t predict the climate on a local, regional, or continental scale, they don’t know why global warming slowed for years, they get the core assumptions wrong – the hot spot is still missing, (that’s the only fingerprint they said mattered, right up until they couldn’t find it). They can’t explain the pause, the cause or the long term historic climate movements either. Measurements of satellites, cloud cover changes, 3,000 ocean buoys, 6,000 boreholes, a thousand tide gauges, and 28 million weather balloons looking at temperature or humidity can’t find the warming that the models predict. In the oceans, the warming isn’t statistically significant, sea-levels started rising too early, aren’t rising fast enough, aren’t accelerating, nor are warming anywhere near as much as they predicted. Antarctica was supposed to be warming faster than almost anywhere but they were totally wrong. The vast Southern Ocean is cooling not warming. The only part of Antarctica that’s warming sits on top of a volcano chain they prefer not to tell you about.
Some scientists are also behaving very badly: hiding data, declines, history, adjustments and methods. But thousands of other scientists are protesting all over the internet.
REFERENCES
Chemke, et al, (2022) The intensification of winter mid-latitude storm tracks in the Southern Hemisphere, Nature Climate Change (2022)
PDF Preview copy on ResearchGate


Those living in Low lying Teal areas in Sydney and Melbourne have obviously recognised the dire danger that they are in from the climate crisis and wisely voted accordingly.
Here is my offer. Your property is now worthless due to the climate apocalypse. I will generously offer to buy it from you at 1% of its last known price. I have made the same offer to Obama following the purchase of his beach front property a couple of years ago.
I only have so much much money so get in quick before your neighbours or former US Presidents take up my offer.
After all Chemke is a top grade scientist and you know time is running out
530
The doomsters say doom is running 60 years early, and it has taken 60 years for the radical left to ruin the USA down to breaking point. What chance civil war by Christmas?
170
by Christmas?
My money would be on ten days after the November USA elections
10
politicians should be tested for scientific literacy (including evaluation of such claims) before being allowed to run on, or make policy based on, purported scientific claims.
190
Don’t tell me the science wasn’t settled?
130
You cheap skate rip-off merchant … I’m offering a much more respectable two and a half percent!
110
Feel like your being scammed?
Try a new government of politicians who all have that same perspective.
The Mainstream Media never fabricate or have deceptive reporting…
The New York Post has declared Prime Minister Trudeau of Canada was scammed by the Mainstream Media’s perception of Native Community genocide that didn’t occur.
Oh, oh…
You mean months of the Canadian Flag at half-mast and imposing a new day of government holiday was done by deceptive media reporting?
300
Not deceptive reporting.
Not even Fake News.
Just Raw Fiction!
10
“Climate change already causing storm levels only expected in 2080” so climate models don’t work..
420
You nailed it!
30
Millions line of code? Then it must be correct .. no room for bugs of any kind.
The first application of computers in the Club of Rome (today the Club of Davos) was the infamous The Limits to Growth, 1972. We must all be dead already..
350
Your phone, PC, smart TV, and modern car are also running millions of lines of code.
429
Validated and used on a daily basis.
Climate models have been anti-validated against all known real data.
Sorry you are incapable of comprehending the difference.
412
Weather models are also validated on a daily basis. The same system of equations are used in both weather and climate models, it’s just that the scales are different.
https://nas-sites.org/climate-change/climatemodeling/index.php
Climate models are regularly validated and they stand up pretty well. https://www.realclimate.org/index.php/climate-model-projections-compared-to-observations/
Hansen’s 1981 model has been pretty accurate, especially given he had less computing available than you have currently on your phone no no insight has to what future emissions were going to be.
227
Climate models are NOT VALIDATED. The data is adjusted/fabricated to match the models ie the antithesis of “science”
Your link is from the model garbage group, using climate garbage. Fox guarding the hen-house. Not real.
Those temperature fabrications bear absolutely zero resemblance to reality.
The only one of Hansen’s projections remotely near reality is the “zero increase in CO2” projection.
Weather models only “work” 4 or 5 days out if they are lucky.
They are totally useless after that, and provably so.
You really have fallen for the big AGW scam/con, haven’t you.
Your total lack of comprehension of science, leads to utter gullibility.
230
Latest balloon data shows that surface fabrication are total nonsense.
https://notrickszone.com/wp-content/uploads/2022/05/Northern-Hemisphere-and-Tropics-temperatures-nearly-flat-since-1998-Madonna-2022.jpg
Data matches UAH very well, validates UAH ,
INVALIDATES GISS and its clones.
190
That’s an own goal. Your chart shows a statistically significant warming trend. A little more investigation confirms that RHARM shows warming trends of 0.39 K/decade at 300 hPa in the Northern Hemisphere and of 0.25 K/decade in the tropics. https://agupubs.onlinelibrary.wiley.com/doi/full/10.1029/2021JD035220
You have just shown that the troposphere is actually warming faster than the surface, which means that UAH is surely flawed.
111
“which means that UAH is surely flawed”
WRONG.
The Authors have advised that their values match UAH very well.. almost identical.. You fail again.
There is absolutely zero evidence of human caused warming in the whole balloon data set.
UAH is far below the fabrication of climate games.
80
NASA themselves verify that UAH matches Balloon data very well
notice how much different from the surface fake fabrications they are
and how much different from climate computer games.
80
Well, that’s interesting. Your screen shot shows UAH with a larger warming trend than RSS. What version of UAH is that? What’s your source? One again, your chart shows that the troposphere is warming at rates nearly unprecedented in paleo-climate history.
05
Well, that’s interesting, our screen shot shows UAH with a faster warming trend than RSS. What version of UAH is that? What’s your source? Once again, your chart shows that the troposphere is warming at rates nearly unprecedented in paleo-climate history.
04
Your ignorance astounds even me. You really need to start paying more attention.
Look at the date… This is before RSS went anti-science and started using climate models to “adjust” their values, thus making themselves mostly irrelevant to scientific discussion.
40
“Once again, your chart shows that the troposphere is warming at rates nearly unprecedented in paleo-climate history.”
More complete gibberish and unsubstantiated nonsense from Simon.
Troposphere did not warm at all between 2000 and 2015.. rate = zero
Only warming was from a non-human caused El Nino.
30
No warming from 1980-1995 either..
How can zero warming be “unprecedented”.
30
Simon >”RHARM shows warming trends of 0.39 K/decade at 300 hPa in the Northern Hemisphere and of 0.25 K/decade in the tropics”
Just two major problems from Madonna et al (2021):
The New Radiosounding HARMonization (RHARM) Data Set …
https://agupubs.onlinelibrary.wiley.com/doi/full/10.1029/2021JD035220
Figure 8
Upper tropospheric interannual variations of 300 hPa temperature for the period 1979–2018 for Integrated Global Radiosonde Archive (black), Radiosounding HARMonization (red), and ERA5 reanalysis (blue) in the Northern Hemisphere and in the tropics. Anomalies are shown in the panels a and c, ….
https://agupubs.onlinelibrary.wiley.com/cms/asset/b2668cc6-1372-4e97-a948-735d94bf7025/jgrd57550-fig-0008-m.jpg
The NH 300 hPa (a) warming occurred 1979 – 2000. 2000 – 2018 is essentially no change. A linear trend over 1979 – 2018 does not capture the inflexion at 2000 and is therefore not representative of the data.
Similarly Tropics 300 hPa (c). The graph is essentially no change 1978 – mid 2015. The 1998 El Nino is central so doesn’t skew the linear trend. But the data at the end of the series, including the 2016 El Nino spike DOES skew the linear trend.
In other words, just 2.5 years 2015.5 – 2018 determines the linear trend for the entire 39 yr series.
10
“The same system of equations are used in both weather and climate models, it’s just that the scales are different.“. That means that the climate models are actually weather models, being run on a scale that the weather models’ code was never intended for, and which can clearly never work. The reason is very straightforward: the weather models’ code cannot give reasonable forecasts beyond about 5 days. NB. That’s not a criticism of the weather models, it is a simple statement of fact. The weather models have improved enormously over recent decades, and IMHO do a brilliant job. But they physically can’t see enough of what is coming in order to forecast beyond about 5 days.
For a climate model to have any chance of working, it must NOT use weather model equations, it must use climate equations, and those are very very different indeed. For starters, it can’t work on the tiny time slices (typically about 20 minutes) that the current crop of climate models use. A proper climate model needs to work on much larger scales of time and space. Without a major restructuring, the current crop of climate models can never work. There is no sign of any of them being restructured, so the way they are going they will never work. There are some climate models out there, with suitable structures, but AFAIK the IPCC has never referred to them. One example is Marcia Wyatt’s: https://www.wyattonearth.net/.
160
Climate is the mean of weather. I can’t tell you whether your coin toss is going to be heads to tails but I can tell you, on average, that 50% of the time it will be heads. Unless, your coin is biased, in which case I adjust my model.
18
LOL.. Simon has just told us that climate models are no better than a coin toss.. !
Thanks, but we already knew that.
61
What they need to do is make up some more
modelscomputer games,.. make the “model ensemble” ever wider ranging, so some of it shows the coming cooling.
That way they will be able to say one of their models is correct. 😉
As it is, the very huge range proves what a complete and utter failure those climate models are, when not even one of them comes close to REALITY.
130
Simon _ Do you have any faith in the IPCC. Here is a quote for you :
Climate models deal with a coupled non-linear chaotic system, and therefore long term prediction of future climate states is not possible. 2001 UN IPCC AR3 report P774 https://www.ipcc.ch/ipccreports/tar/wg1/501.htm
Explain that!
170
Simon >”Climate models are regularly validated and they stand up pretty well”
RSS begs to differ:
Fig. 2. Tropical (30S to 30N) Mean TLT Anomaly plotted as a function of time. The black line is the time series for the RSS V4.0 MSU/AMSU atmosperhic temperature dataset. The yellow band is the 5% to 95% range of output from CMIP-5 climate simulations.
https://images.remss.com/figures/climate/RSS_Model_TS_compare_trop30v4.png
From: Climate Analysis
https://www.remss.com/research/climate/
Over 1979 – 2019 the only time, except for mid 1990s, the observations enter the middle of the yellow model band is El Nino spikes i.e. natural variation – not CO2-forced warming. The rest of the time they are at the bottom of the yellow band and once natural variation spikes are smoothed out by 5yr moving average to compare apples-to-apples (models don’t do ENSO) there’s no warming at all this century.
Given CMIP6 models are warmer than CMIP5 the situation is now even worse for the models. If they can’t model tropical TLT in the early 21st century then it’s time to give up on any mid to late century forecasts
60
Simon >”Climate models are regularly validated and they stand up pretty well”
Not so. The UKMO “Decadal Forecast” is a serial failure 2012, 13, 14, 15, 16, 17, 18, 19 unless they catch a lucky break with El Nino. Which is natural variation. And climate models don’t do ENSO/natural variation.
Just the last 5 are comical:
Decadal forecast
https://www.metoffice.gov.uk/research/climate/seasonal-to-decadal/long-range/decadal-fc/index
2015
2016
2017
2018
2019
Notice how, as the El Nino passes through the observations, the observations return to normal but the model forecast persists with radical warming up into the top of the green CMIP5 band.
Since the El Nino their forecast is wrong year after year after year. And they get a chance to get it right every year but no.
But the UKMO carries on regardless.
80
>”Just the last 5 are comical”
Make it 6 – missed 2020
Probably the most comical of all.
30
MET-Office update: There is no update.
Posted: February 5, 2019 by tallbloke
https://tallbloke.wordpress.com/2019/02/05/met-office-update-there-is-no-update/
In the meantime, here’s how the 2016-2021 forecast (in blue) is doing compared to the latest data (red trace).
https://tallbloke.files.wordpress.com/2019/02/met-o-2016-2021-detail.png
Met Office Decadal Forecasts Running Hot
FEBRUARY 11, 2019
By Paul Homewood
https://notalotofpeopleknowthat.wordpress.com/2019/02/11/met-office-decadal-forecasts-running-hot/
Clown show is a compliment.
30
Simon >”Climate models are regularly validated and they stand up pretty well”
Depends on how you define “validated”. UKMO’s decadal forecast doesn’t stand up too well, even by their own admission:
Decadal forecast
https://www.metoffice.gov.uk/research/climate/seasonal-to-decadal/long-range/decadal-fc/decadal-forecast-2020
Verification of previous forecast
Figure 4: Observed (A) and issued forecast (B) of surface temperature differences (°C) relative to 1981-2010 for the 5-year period November 2015 to October 2020. Forecasts consist of 10 ensemble members starting from November 2015. The stippling shows where the observations lie outside of the 5-95% confidence interval of the forecast ensemble.
There are vast swathes of stippling in Figure 4 the net effect of which is a wildly off forecast. Upthread at #4.1.1.1.2 there’s an updated plot showing the same 2016 forecast against observations, again here:
[H]ere’s how the 2016-2021 forecast (in blue) is doing compared to the latest data (red trace).
https://tallbloke.files.wordpress.com/2019/02/met-o-2016-2021-detail.png
Contrary to the UKMO’s assertion – “the observations generally lie within the forecast uncertainty range” – the observations are actually OUTSIDE the forecast uncertainty range.
That is NOT validation or verification.
40
The uncertainty bars are 95%. Therefore 5% of the time the observation will be outside the error limits. It’s actually a bit more complicated than that because temperature time series are auto-correlated but you get the picture.
15
And aren’t those bars HUGE
And real temperature are way below them.
Thanks for showing us just how USELESS climate models are.
You are using words when you obviously don’t have the vaguest clue of their meaning.
30
Simon >”The uncertainty bars are 95%. Therefore 5% of the time the observation will be outside the error limits”
Except there’s way more stippling than 5% of the earth’s surface in that forecast.
But that is only ONE of the UKMO’s annual “decadal” forecasts. It was wildly out as Roger Tattersall (Tallbloke) demonstrates upthread.
Then the UKMO went back next year and attempted another forecast – wildly wrong again.
Then the UKMO went back next year and attempted another forecast – wildly wrong again.
And so on – the definition of insanity by Einstein.
00
Do you guys ever read what you post? From the RSS page https://www.remss.com/research/climate/
Over the past 35 years, the troposphere has warmed significantly. The global average temperature has risen at an average rate of about 0.18 degrees Kelvin per decade (0.32 degrees F per decade).
Climate models cannot explain this warming if human-caused increases in greenhouse gases are not included as input to the model simulation.
The spatial pattern of warming is consistent with human-induced warming. See Santer et al 2008, 2009, 2011, and 2012 for more about the detection and attribution of human induced changes in atmospheric temperature using MSU/AMSU data.
15
There is no such thing as “human CO2 induced warming
It exists only in models.
The very slight but highly beneficial temperature rise since the coldest period in 10,000 years is easily explained by oceans cycles, the sun, and a reduced cloud cover over the tropics
None of these are built into the climate computer games.
None of these has anything remotely to do with human causation.
There is absolutely ZERO need to make up imaginary causes like atmospheric CO2, which is all that Santer did..
The attribution studies are a complete anti-science farce. !
They basically assumed it was nothing else but CO2, built that into the models, then pretended they has produced proof.
Its basic scientific idiocy…
… but enough to fool the scientifically ignorant and gullible, so it seems.
50
Simon >[RSS quote]:
Don’t be fooled by inappropriate linear trends on fluctuating data. That RSS linear trend in no way represents the trajectory of the data.
Fact remains, RSS Fig. 2. Tropical (30S to 30N) Mean TLT Anomaly is dominated by EL Nino events (natural variation). Here again:
https://images.remss.com/figures/climate/RSS_Model_TS_compare_trop30v4.png
Natural variation (ENSO) must be removed from observations before comparing to climate models which are perpetually ENSO-neutral (Mean samples 60 or 12 below).
RSS LT (different series) warmed a LOT LESS than 0.18K/decade once ENSO is filtered out by 5yr smoothing 2000 – 2014 (about 0.025K/dec):
https://www.woodfortrees.org/plot/rss/from:2000/to:2022/mean:60
An obvious 0.3K regime shift 2014 – 2018
https://www.woodfortrees.org/plot/rss/from:2001/to:2022/mean:60
5yr smoothing doesn’t capture the 2015 – 2022 period but 12 month smoothing does:
https://www.woodfortrees.org/plot/rss/from:2010/to:2022/mean:12
The regime shift is returning back to the 2014 level which effectively no change this century.
RSS Figure 2 TLT (different series) would, when similarly smoothed for ENSO, make a mockery of the yellow model band.
00
>”Natural variation (ENSO) must be removed from observations before comparing to climate models which are perpetually ENSO-neutral”
In other words, the RSS graph of ENSO-included observations vs climate models is scientifically fraudulent (by deception or misrepresentation).
That’s this graph:
RSS TLT ENSO-included vs ENSO-excluded models
https://images.remss.com/figures/climate/RSS_Model_TS_compare_trop30v4.png
That is not a like-for-like comparison.
00
>”Climate models cannot explain this warming if human-caused increases in greenhouse gases are not included as input to the model simulation”
But when CO2 forcing is included the perpetually ENSO-excluded/cyclicity-excluded models overshoot (way too warm) observations where ENSO and cyclicity is similarly excluded.
Reasons:
1) Their solar forcing is junk.
2) Their CO2 forcing is superfluous.
3) They are unable to comprehend like-for-like models-vs-observations comparisons in respect to ENSO and cyclicity.
4) Along with ENSO, The models are also perpetually cyclicity neutral. The quasi 60 yr oscillation must first be removed from observations before comparing to models. That’s this exercise:
‘Application of the singular spectrum analysis technique to study the recent hiatus on the global surface temperature record’
Diego Macias, Adolf Stips, Elisa Garcia-Gorriz
https://pubmed.ncbi.nlm.nih.gov/25208060/
But you knew that.
10
Simon >”Weather models are also validated on a daily basis”
Or not. Rather more nuanced than that. The forecast-observation deviations can be significant even over 6 hours. GFS is run every 6 hours with a moving 168 hours (7 days) forecast.
See:
1. What is the current model setup?
…
2. How meaningful is the model verification?
FAQs
http://www.karstenhaustein.com/reanalysis/info.php#verification
The model is constrained up to the red line observations which advance every 6 hours. So every 6 hours the forecast is overridden by observations and the deviation shown in the bottom panel here:
NCEP Global Forecast System and Reanalysis [Plots]
http://www.karstenhaustein.com/climate
Late May there was a 0.35C deviation in the NH series over a 6 hour forecast.
If you watch the process over a day or two it’s clear 7 days is too far out to forecast. This has been especially evident since mid May.
Also, note there is now zero warming in the Southern Hemisphere from the 1981 – 2010 reference period.
60
By my observation, weather models are INVALIDATED on a daily basis. Despite efforts to predict a few days in advance, they are inevitably wrong.
Any climate model that shows the NINO 4 region exceeding 30C is WRONG. They all do that so they are all WRONG. It is physically impossible for open ocean water to exceed 32C with the present atmospheric mass because the sky goes perpetually dark and they all tend to regulate to a limit of 30C once cyclic deep convection sets in. Observable every day of every year:
https://www.tropicaltidbits.com/analysis/ocean/cdas-sflux_sst_global_1.png
Weather models simply extrapolate from the present to a future state. They do not incorporate the fundamental physics of the atmosphere and the oceans. That is why they are useless at predicting future climate. Climate models can produce atmospheric water from nothing. They show tropical oceans exceeding 30C. They somehow get heat energy into 2000m deep oceans in a matter of decades. All this is non-physical claptrap.
70
Including the ones?
3℃ warming by 2020?
The Seychelles to run out of drinking water by 2009?
The Seychelles and other oceanic islands to be underwater by 2018?
Lower Manhattan (including lower Wall Street) to be submerged by 2018? I would agree that Wall Street may well be sinking.
I can’t find any claim by him that the Arctic would be ice free in summer by 2013 (although his buddy Al Gore predicted just that).
30
One of the reasons Climate models have any creditability. Is because the engineering computer models that predated them are so good. The fact that those engineering models are based on centuries of validated real world data, seem to be lost on a lot of people. It’s ‘engineering computer models work, all computer models most work’. This car is made in China – But it looks just like a Merc so it must be just as good.
210
All that bloatware.
All those computer programs have a couple of things in common. They typically open a file folder, display the contents, allow you to select a file, open the file, read the file, edit the file and close the file, etc.
AND everyone of those programs uses it’s own copy of the file handling libraries. Imagine if instead of using one copy each, they instead used a SINGLE copy from the computer’s main library store instead. Think of all that code that could be reduced on you computer.
Also, how often is the code updated, once per program, do they all get updated at once, do some get forgotten, maybe allowing a virus entrance point that was fixed by others but not all?
It’s not just the file opening, it’s the mouse/pointer device, the fonts, etc, etc.
Millions of lines of code equals bloatware. I think the current crop of software writers would fail dismally with a 1MB 80386 based computer, yet strangely I recall running DOS as the operating system and AutoCAD version 10 on it. 1MB now wouldn’t open the opening graphic. This isn’t progress, it’s bloatware. Sure a lot of improvements have been implemented but not proportional to the file size.
230
You’re dead right! I see no improvement in my life since Windows XP, AND I had to buy two new computers to run faster and handle more bloatware in the meantime.
Just like cars, they solved the necessary problems as the industry matured years ago, and now its just useless bells and whistles to make people buy new models all the time.
Back when the whole Mac operating system took up 17Meg…
160
Simon,
I know nothing about a modern car or a smart TV but do know that my phone and PC often go into “do loops” and over-flows on a daily basis.
That’s unlike the Zippo lighters that “worked every time.”
Climate models have the reverse slogan.
And that, I think, was your point.
70
John, minor correction: Zippo’s slogan since 1932 has been “It works or we fix it free”. The warranty is indefinite and even applies to 50 year old or more lighters.
https://www.zippo.com/pages/repairs-windproof-lighter
60
Reminds me of the story where a couple of missionaries were captured by the cannibals and placed in the cooking pot.
The head missionary said to his off-sider “don’t worry- I will get us out of this predicament”, then produced his Zippo, held it up for the tribal chief to see, then clicked it, and it came alight.
The chief then immediately released them.
The head missionary said to his off-sider “see, I told you this technology would free us”.
The Chief then said “no no, it is the only time we have ever seen one work first pop”.
50
I’m a two time looser when it comes to computer and tv code. One of my computer’s code can’t react to rising temperature and tell the fan to start and instead only kicks in when it decides it is just too hot and closes the whole thing down.
Then there is that other illiterate in the lounge room our wide screen smart tv. You can do the search/channel set up but then progressively over the next few days the tv starts duplicating them onto other different channel numbers eg you have the original channel 9 on channel 9 but a duplicate shows up on channel 352. When we click on any Channel 7 offering we get it for around 15 seconds then the tv switches to channel 1056 Gold Coast channel 7 (the tv manual says you can store up to 1000 channels but we seem to have been given a bonus 56?) and you have to reselect the actual channel 7 number on the remote to continue viewing.
Being a “smart” tv it is internet connected and so gets software upgrades periodically and clearly one of these (after the warranty ran out) is not up to scratch. Don’t watch that much tv and given its affliction we regard it like an elderly relative with alzheimer.
As far as the computer is concerned yes I realise something else like the fan itself might be the fault not the code which heightens the potential that when it comes to global weather maybe something else or a combination of something elses might be the REAL cause. Anyway having a pedestal fan blowing on the computer to keep it cool is a cheaper alternative ($59) to calling in Geeks to You or a repair shop. Besides during summer the additional cool is great but my hands do suffer during winter. Oh and I have gotten used to the noise of the fan and the desk has never been as dust free as it is now.
80
my microwave has a strange bug where if you enter a cooking time of 1minute and 20 seconds, it actually runs for 2 minutes (120 seconds). Enter 1 minute 30 seconds, or 1 minute 10 seconds, and all is ok.
00
Yep and they bug out endlessly needing a reboot
20
And they crash often enough, too.
00
The following was written ten years ago so the CoR model is now 50 years old and still failed to predict anything.
https://www.aei.org/carpe-diem/40-years-later-time-has-not-been-kind-to-the-limits-to-growth/
SEE LINK FOR REST
Incidentally, a criticism of the World3 systems dynamics model used by CoR was published:
Cole, H. S. D.; Freeman, Christopher (1973). Models of Doom: A Critique of the Limits to Growth. Vhps Rizzoli. ISBN 0876639058.
60
So, this all means it will get so warm and tropical worldwide that the dinosaurs are coming back, right?
121
>”So, this all means it will get so warm and tropical worldwide…”
One of the “multiple lines of evidence”. Here’s another:
Colour It Red!
https://notalotofpeopleknowthat.wordpress.com/2022/05/27/colour-it-red/
110
Red is the new black
60
Awesome! looking forward to the dinosaurs, Yabba Dabba Doooooooooooooooooooooooooooooo
30
Back in the day the journal Nature was an outstanding journal of scientific excellence and there is no way they would have published something like this.
Like everything else, it has been infiltrated by the Left and dumbed-down and turned into an instrument of propaganda in accordance with Rudy Dutschke’s 1967 plan of der lange Marsch durch die Institutionen (the long march through the institutions).
Scientific American has gone the same way, as has the equivalent journal to Nature on the other side of the pond Science.
260
It’s not the Nature journal, it’s Nature Climate Science and is dedicated to more esoteric climate science research. This is just one paper looking at one specific small question. I’m not sure why Jo picked on this one, presumably because it affects Australia’s climate. The reason why there has been an energy increase is a moot point, and whether it is permanent or decadal in nature. This paper is attempting to answer that question. I thought the prevailing thinking was because Antarctica is not warming that quickly as it is insulated by circum-polar winds and increasing levels of ozone. The increase in temperature differential is causing the increase in energy. Science advances one small step at a time.
422
“Science advances one small step at a time.”
1. This is definitely NOT science. It is low-level computer games.
2. This is NOT an advance of any sort whatsoever. It is a step back in time to Ouija boards and ancient entrail readings.
282
Add energy to a chaotic system and this is what you get.
This post is saying that there has not been any extra energy added, even though some of the links say otherwise
116
No one is adding energy, except the SUN.
161
What about energy created by a natural dynamism?
13
Are you talking about the earth’s natural dynamo that generates the magnetic field?
I’m not sure how that couples into the atmosphere to drive climate.
What is the mechanism?
90
energy “created”?
how so !
100
Peter Fitzroy says: “This post is saying that there has not been any extra energy added”
Go on Peter. Quote me. Find where I said that. IF you can’t — what you’ll find instead is your own religious confirmation bias. Apparently, you need to see things that aren’t there. It’s called “cognitive dissonance”.
Your apology is accepted.
140
Jo Nova,
I do apologise, and you are right I did read into the post what I wanted to see.
So if I could rewrite my comment I would say
While there is warming, the models are not as accurate as they could be.
However, when you add energy to a chaotic system and this is what you get.
20
Thanks Peter.
Now you say: “However, when you add energy to a chaotic system and this is what you get.”
Specifically what do you get? Was that mid latitude storms of the southern hemisphere, and which paper exactly, predicted that would happen? Which models got that right?
And since the others didn’t, can we toss them out now, and just stick the models that did “get what you get”.
10
“when you add energy”
CO2 does not add energy.
Tell us how your “when you add energy” works.
The Sun has added a lot of energy over the last several decades…
And the clouds have let a lot more of that energy into the tropical oceans.
10
The dynamo might be staring us in the face.
https://www.abeqas.com/a-southern-annular-ocean-dynamo/
10
Its going to be hard proving CO2 is directly implicated, we should be looking at zonal flows.
20
If it’s 60years early the energy hasn’t been added
60
It is not Nature Climate Science either but Nature Climate Change. (Remember, what is promoted as “climate change” is not science but propaganda.)
In any case it is all under the same auspices of Nature and Nature Publishing Group.
A minor point.
170
“Nature Climate Science and is dedicated to more esoteric climate science research”
When it comes to science…. it is basically the equivalent of MAD magazine.
Although I assume you prefer Cosmopolitan or Vogue….. or maybe even Rolling Stone.
160
Mad magazine was good. Nearly as good as Li’l Abner.
Different branch of science, but.
10
‘The reason why there has been an energy increase is a moot point …’
The Southern Annular Mode might be implicated.
20
“Science advances one small step at a time.”
except climate science, which took one giant leap (not for mankind) by reversing the onus of proof such that instead of having to prove their hypothesis (the proponent must prove their claim), it is up to others to prove the hypothesis false (the claim of the proponent is assumed to be true).
See Prof. Dr. Horst-Joachim Lüdecke, german-physicist-sees-dangerous-return-to-medieval-scholasticism-climate-models-have-failed-conclusively
130
Just fishing.
During the LIA ‘summer climate and atmospheric circulation over New Zealand was driven by increased frequency of weak El Niño-Modoki in the tropical Pacific and negative Southern Annular Mode activity.’ (Lorrey et al 3013)
40
The winds are getting stronger and picking up the waves. In this article they suggest global warming is in the frame, energy created by a sharper atmospheric gradient.
https://www.science.org/content/article/ocean-s-tallest-waves-are-getting-taller
10
Simon says:
Don’t you warmists/Leftists claim that “The science is settled”?
What is there left to advance?
130
They walk around with both feet in their mouthy gobs ! Its quite funny to watch.
60
leaving all those brown snail trails in their wake.
40
What passes for scientific “models” these days is not what used to be meant by models.
Back in the day, scientific models had to be validated by real world data and extensively tested to ensure they were an accurate representation of the system being modelled. Once validated, they had to be further tested to ensure they had an accurate predictive capability.
Today, climate “models” are made without reference to real world data (which is often extensively altered and cherry picked, look how Australia’s BoM deleted data from before 1910 and “homogenised* the rest) and no testing or validation. If the results are wrong, the real world data is simply altered to match the “predictions” of the models.
People on the rational side of the fence should not dishonor the efforts of genuine modellers who put great effort and have great pride in creating realistic and validated computer simulations of real world situations.
We should not call the numerical fantasies of propagandists who make “simulations” that generate series of desired scary scenarios “models”.
There used to be an adage taught to computer programmers and modellers called Garbage In Garbage Our. Obviously that is no longer taught in the indoctrination centres now known as “schools” and “universities”.
210
I guess with climate “models” it’s not Garbage in Garbage Out but Garbage In Trillions Out” because the “models” lead directly to Government policy decisions which lead directly to more expensive and unreliable energy which makes trillions of dollars for those who profit from it and costs the consumers and taxpayers trillions.
100
e.g. Bloomberg
The video is https://www.youtube.com/watch?v=IwvGlF9_fpw (may not last).
40
Outstanding video Graeme No.3. Thanks for sharing.
40
There is only one thing we can do now, PANIC, PAY MORE TAX, STOP ALL MINING, STOP ALL FARMING, STOP HAVING CHILDREN, STOP GENERATING ELECTRICITY…….stop living?
By the way here in Queensland who had the temerity to stop cyclones. We are supposed to be having at least a dozen cyclones from hell every year & we only get a hint of a cyclone every other year. Could whoever has caused this please concentrate on stopping Green politicians instead. I’d prefer a cyclone or cyclone or two!
190
PANIC STOP GENERATING ELECTRICITY
The Day the Electricity Died
Imagine one of your kids freezing to death in your home. Eleven-year-old Cristian Pineda’s mother found her son dead during the Texas blackout in February 2021. Or you have a power outage for three days, losing a couple of hundred dollars worth of food because your refrigerator didn’t work, as Michelle Jones did last summer. The food she had just bought to feed herself, her daughter, and her granddaughter spoiled without electricity.
This is likely to become all too common in the future.
Why?
My years as a Wisconsin state senator and in Gov. Scott Walker’s administration gave me some insights. My senate district included a coal plant, a natural gas plant, two nuclear plants, a biogas plant, biodigesters, wind towers, and many miles of Lake Michigan shoreline—and since then it has added a solar plant. Here are some lessons I’ve learned.
First, we need to understand a little bit about how electric grids work. They cannot store electricity without a battery. Batteries are scarce and expensive. Electric demand must be met with electricity generation, always. If supply cannot keep up with demand, the utility will shut down electricity for some or many.
For nearly a week, Texas utilities were unable to meet demand. They shut down the electric grid. Five million people lost power, and from 250 to 700 died. If an electric grid breaks, all the people it serves will be without electricity for weeks or months.
Nonetheless, Progressives favor energy policies that will make grid failures more frequent, widespread, and prolonged. They want to close coal plants without enough full-time power ready to take their place. They seem unconcerned about reliability. They want coal plants torn down even if we have to keep paying them—like selling your car to get a newer one while you still owe lots on the first.
What do they all have in common? Increasing their reliance on solar and wind and closing coal plants. A dirty green secret is that coal is full-time power and wind and solar are not. Electric grids must have full-time, on-demand power all the time—plus some—or blackouts are guaranteed.
Another dirty secret: wind and solar produce little or no energy 70% of the time. This means that to replace 1,000 MW of coal, it will take 3,500 MW of wind turbines’ “nameplate capacity,” or 5,000 MW of solar’s. That’s about 1,200 3 MW wind turbines or 13 million solar panels, in either case occupying nearly 40 square miles.
About 240 coal plants in the United States deliver about 22% of our electricity. About71,000 wind towers produce about 9% of our electricity on a part-time, when-the-wind-blows, basis. We are adding about 3,000 wind turbines a year, in the whole country. If wind didn’t have the part-time problem, those 3,000 could replace 2.5 coal plants a year. At that rate, it would take 96 years to replace them all.
Progressives have been demanding that we close coal plants faster than 2.5 a year. If we want our electric grid to serve us full time, we need to reject this policy. We also need to stop everything they do to make coal and natural gas more expensive because that will raise our electric rates even faster.
220
America’s Summer of Rolling Blackouts
Green energy policies are making the nation’s electric-power grid increasingly unstable.
By The WSJ Editorial Board
Summer is around the corner, and we suggest you prepare by buying an emergency generator, if you can find one in stock. Last week the North American Electric Reliability Corporation (NERC) warned that two-thirds of the U.S. could experience blackouts this summer. Welcome to the “green energy transition.”
We’ve been warning for years that climate policies would make the grid more vulnerable to vacillations in supply and demand. And here we are. Some of the mainstream press are belatedly catching on that blackouts are coming, but they still don’t grasp the real problem: The forced transition to green energy is distorting energy markets and destabilizing the grid.
Progressives blame the grid problems on climate change. There’s no doubt that drought in the western U.S. is a contributing factor. NERC’s report notes that hydropower generators in the western U.S. are running at lower levels, and output from thermal (i.e., nuclear and fossil fuel) generators that use the Missouri River for cooling may be affected this summer.
But the U.S. has experienced bad droughts in the past. The problem now is the loss of baseload generators that can provide reliable power 24/7. Solar and wind are rapidly increasing, but they’re as erratic as the weather and can’t be commanded to ramp up when electricity demand surges.
One problem is that subsidies enable wind and solar generators to turn a profit even when the supply of electricity exceeds demand.
Coal and nuclear plants, on the other hand, can’t make money running only some of the time, so many have shut down. Natural-gas-fired plants can help pick up the slack, but there aren’t enough of them to back up all of the renewables coming onto the grid.
130
If you look at the worlds demographic, we have stopped having children
60
Probably because all the men are now women 😄
80
How do you know that… are you a biologist ?
10
I like that “Pagan Climate Model”.
On the previous thread MP has found a situation that is perfectly set up to be “modelled”.
https://joannenova.com.au/2022/05/who-chief-wants-to-run-the-world-for-china-biden-boris-albanese-is-ok-with-that-but-africa-puts-the-brakes-on/#comment-2552026
There is the possibility of definite end data despite the deaths from individual of causes being uncertain: real model.
As I’ve said before, there’s only one real climate model, and the others are junk.
KK
100
‘inshallah’ is a universal phrase in the Arab world. Climate change is starting to take on the same role in the west.
We no longer have ‘acts of God’ it’s now ‘Climate change’
160
Galileo: if a hypothesis disagrees with observations, then the hypothesis is wrong.
climate science: if a hypothesis disagrees with observations, then the observations are wrong
230
You mean the guy that was sentenced to house arrest (lockdown) for heresy until death?
Funny how what’s old is new again.
110
..but 97% of scientists agreed the world was flat and he denied the science. Nothing new at all!
120
Sorry to be “that guy”, but it wasn’t a flat earth, rather a belief that everything revolved around the earth. It’s somewhat understandable too, based on what they knew, or, maybe more to the point, based on what they didn’t know about physics until around that time. People who think humans have affected the climate with CO2 cant and shouldn’t be given the same benefit of the doubt though.
10
I think that was a Richard Feynman quote, but it’s unlikely he was anywhere near the first.
20
What they predicted was drought … it’s in the Third Assessment Report (TAR) and also we had Tim Flannery running around pushing the state governments to build desalination plants … because they rain would not fill our dams.
Remember it was only two years ago they were solemnly telling us that every bushfire is caused by climate change.
https://joannenova.com.au/2020/01/the-hotter-drier-climate-change-myth-the-rain-in-australia-is-the-same/
Now … when it rains hard, that’s also climate change.
190
The claim of anthropogenic climate change is the perfect scam. Whatever happens, or does not happen, is blamed upon it.
The people who profit from the fraud, and their useful idiot supporters, cannot lose.
150
Here we go the Melbourne desalination plant … has it ever been used?
https://joannenova.com.au/2012/12/most-useless-flagrant-flop-of-government-muffog-2012-finalist-victorian-desal/
And the Perth Ghost Town prediction … did it happen?
https://joannenova.com.au/2018/01/perth-plan-to-become-ghost-town-delayed-with-average-rain-and-dams-highest-in-8-years/
Make sure their stupid never gets forgotten, because it’s only by making them live up to past screwups that we can defuse the next wave of whack predictions.
110
Even if no water is used, Vicdanistani taxpayers throw away $1.8 million per day on the plant for the next 27 years.
The water is occasionally ordered so the government can “prove” they didn’t waste the money but as I understand it the water has an unacceptable high level of boron in it, a cumulative poison, so the water produced is just dumped into the sea.
From Wikipedia.
From the Socialist Morning Herald:
SEE LINK FOR REST
90
lol.
Every 1st of April the Minister for Water puts on the official ceremonial clown nose and fools hat, then proudly walks a few doors down the street, to formally take a dump on Victorian taxpayers and declare the pocket-stuffing festivities open.
50
Victoriastan has been running the desalination plant for a long time now. As well as having an above average rain fall year in 2021, the truely free water from the sky is replaced with a gas fired CO2 producing desalination plant because Dick tator Dan said we need it to run.
Take any thing that works and give it to government to stuff up, add cost and then tell the populace its for their own good.
70
Unfortunately they own most of the media and those who “believe” don’t view the media they don’t own.
Anything can be disappeared. 1984, 1984,1984…………..
90
Doomer Storms of 2080 are here 60 years early — sayth short cherry-picked storm data from pagan climate-model
History Repeating Itself
Australia Becoming Unlivable–BBC
From NOT A LOT OF PEOPLE KNOW THAT
By Paul Homewood
This may come as news to the Aussies!
then
Perhaps somebody should have told their 19th ancestors!
THE CLIMATE OF AUSTRALIA.
A correspondent of the Grafton Observer Tue 13 Oct 1868 writes to that journal as follows:—
” From observations made by those who have had the best opportunities of forming a correct opinion, there is little doubt that Australia is subject to long periods during which dry seasons prevail, and again, intervals of some years, in which there is a prevalence of floods; and it may prove of interest to some of your readers to have before them a record of the observations made since the colony was first established, which bear upon this subject.
” I therefore append at foot, an account of all the recorded floods and droughts which have taken place since the colony was established. It must be borne in mind that these observations are of necessity confined to those districts which were settled at the various periods, and will not, until lately, refer to any part north of the Hunter or Port Macquarie.
” This table was for the most part prepared by Dr.Jevons, and I extracted it from a document in the Sydney Observatory.
“The theory of alternate long period or prevailing wet or dry seasons may be confirmed in the mind of any one who will observe the numerous small swamps in which there is a growth of gum trees, which must have required a period of at least fifteen years, during which there was no standing water on the ground, and after they had attained their present growth, a succession of hot seasons has left sufficient water on the ground to kill them. “It is, of course, impossible to predict that any particular year will be wet or dry, but we may reasonably conclude that there is every probability of a greater number of dry seasons than floods during the next fifteen or twenty years, and those whose interests are likely to be affected either way, will, in my opinion, be acting prudently, by taking precautions rather against droughts than floods.
” I am, Sir, yours, &c.,
” THOMAS CARTER.
“Grafton, October 3rd.
DRY period.
1789 . Drought
1791 . Drought
1797 . Drought
WET PERIOD.
1799 . Flood
1800 . Flood
1801 . Flood
1805 . Flood
1806 . Flood
1808 . Flood
1809 . Flood
1810 . Flood
1811 . Do, slight drought
1812 . Flood
1814 . Severe drought
1815 . Severe drought
1816. Flood
1817 . Flood
1818 . Slight drought
1819 . Flood
1820 . Flood
1821 . Flood
DRY PERIOD.
1823 . Slight drought
1824. Slight drought
1826 . Flood
1827. Do., severe drought
1828 . Severe drought
1829 . Severe drought
1830 . Flood
1831 . Flood
1832 . Flood
1835 . Slight drought
1836. Slight drought
1837. Extreme drought
1838 . Extreme drought
1839 . Extreme drought
1840 . Flood
1841 . Slight drought
WET PERIOD.
1842 . Flood
1843 .. Flood
1844 . Flood
1845 . Drought
1846. Flood
1847. Flood
1848. Flood
1849 .Drought
1850 .Flood—drought
1851. Flood
1852. Flood
1853 . Flood
1856. Flood
1857. Do., slight drought
1859 . Flood
1861 . Flood
1862 . Flood
1863 . Flood
https://trove.nla.gov.au/newspaper/article/60828173
THE CLIMATE OF AUSTRALIA. – Empire (Sydney, NSW : 1850 – 1875) – 13 Oct 1868
A correspondent of the Grafton Observer writes to that journal as follows:- “From observations made by those who have had the best opportunities of forming a correct opinion, …
https://www.ses.nsw.gov.au/news/all-news/2017/reflecting-on-the-record-1867-hawkesbury-nepean-flood/
210
“Australia Becoming Unlivable–BBC”
that would explain the record immigration levels, then /sarc.
180
““Australia Becoming Unlivable–BBC””
We just have to tell all the boat people that, as their influx increases over the next several months.
“No, No.. go home, Australia is becoming unlivable, very last place you want to be.”
160
“Australia Becoming Unlivable“
Yes, but it is not because of the climate…
…it is because of the dumb politics, regulations, restrictions, costs, nanny state, etc etc
..IE,…. Just crap leadership !
30
Remember when the Left were anti-Establishment?
Now the Left ARE the Establishment.
140
They have always just wanted to rule.
70
I remember when the most highly talked-about models only strutted along catwalks in slinky dresses 😀. Times have changed.
110
catwalk models and climate models have about an equal chance of predicting the climate (= to random chance).
100
Naomi Campbell certainly raised some temperatures 😀.
100
Willis Eschenbach has checked the data and found SFA to worry about and certainly ZERO emergency or dopey Biden’s EXISTENTIAL threat.
Look up the GLOBAL data for the last 100 years and deaths from EXTREME WEATHER events have DROPPED by 95%.
And less than 2 billion Humans in 1922 and 7.9 billion today.THINK. When will these clueless, delusional, fantasists WAKE UP?
Of course cyclones in the Aussie region have had a lower trend in the last 50+ years. See BOM data.
https://wattsupwiththat.com/2021/04/25/wheres-the-emergency/
150
Thanks for that link, Neville. I have saved it for compulsory reading by my grandchildren.
30
If you wanted to find a place to claim something, you’d look for a place where there are very few real live observers.
Anyone want to provide the number of humans per square hectare in this region?
“Trust me I’m the authority, I know and you can’t prove me wrong.”
120
‘ … decisive intervention is required in order to halt the climate damage in this region.’
Climate change has become regional, much amusement.
40
Real climate change is actually regonal and seasonal. The biggest changes over the last 500 years is increasing solar input in boreal springs and reducing solar input in boreal autumns. The reverse for austral spring and autumns.
30
Climate change is hemispheric, the LIA started in the north and its effect down south was moderated. Taking in the bigger picture, bipolar see saws appear to be a natural part of the system.
00
Well, seeing the Northern Hemisphere causes all the global warming problems their data shows that storms should be increasing world-wide, but human actions are stopping it from happening in the North. We need MORE of what people are causing down here!
People will write any sh*t to get published, its the major problem of our time. They should have chucked their proposition up on here and weathered the arguments first.
70
Just more support for the fact that climate models are wrong.
It does not go into why the models are wrong.
So let me answer that. They do not not model how energy input to Earth’s climate system is actually controlled. The process of deep convection limits open ocean surfaces to 30C. It is as simple as that.
40
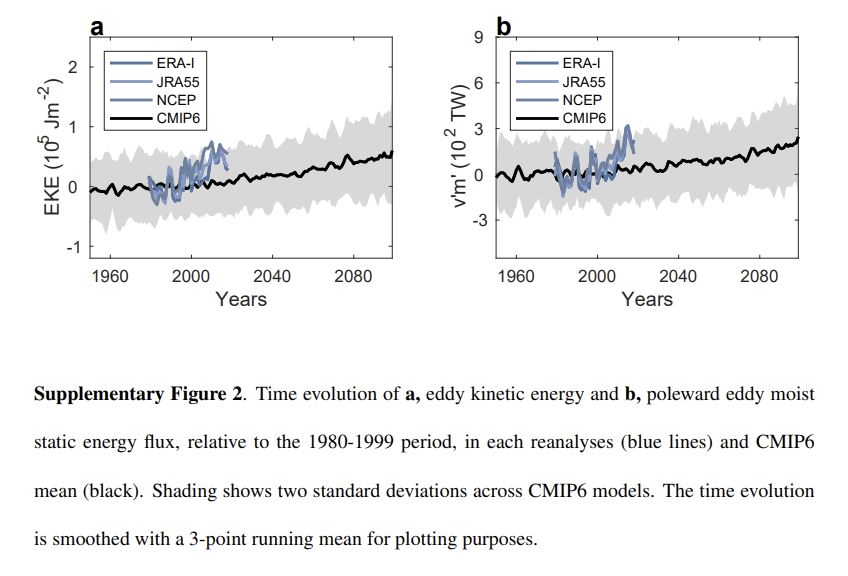
To put the poleward change in energy flux, currently sitting around 100TW, in perspective, that is 0.08% of the solar power reaching Earth.
Antarctic is a cold place and would be much colder in winter unless there was not substantial heat transported over the ice mass by air currents.
30
Another number for perspective, the current increase in poleward power flow in moisture is 0.25% of the solar power consumed in evaporating water globally – say 39PW.
Yet another, the 100TW increase in poleward power flow is just 2.5% of the latent heat power transfer from oceans to all land.
The Antarctic land mass is not warming but the Southern Ocean has warmed as the net evaporation has reduced due to reducing solar input to the Southern Hemisphere. That means more moisture converges from ocean to much colder ice sheet. If climate models were useful, they would demonstrate this long-term trend.
10
Possibly O/T but The Green Agenda’s Role In Global Inflation–Ben Pile on https://notalotofpeopleknowthat.wordpress.com/2022/05/28/the-green-agendas-role-in-global-inflation-ben-pile-2/
The video is https://www.youtube.com/watch?v=IwvGlF9_fpw (may not last).
Covers the generation of Climate Change hysteria.
40
If only they would model how wind and solar can power the planet.
Over the last 3 days cross the AEMO grid, wind has delivered just 4% of demand, 960 MW on average from a nameplate capacity of 8,600 MW. How many more windmills will it take to deliver 50% of demand?
80
Isn’t 960/8,600 = 11%?
30
Brian, you misread, I think.. the 4% is of “demand”, not wind capacity.
30
The guaranteed output of any wind turbine or any number of wind turbines is ZERO. The more turbines you have, the lower the occurrence of ZERO output but it remains the guaranteed output for any number.
So the answer to your question is 1/0 = infinity.
The same answer applies to solar panels in any longitudinal band less than 180 degrees wide.
21
Tabloid Science.
Anything for attention.
It appears modern academia perpetuates childhood.
50
Google and the Bureau of Meteorology seem to have completely different weather forecasts. One wonders whether they are simply throwing darts at a chart. Google claims clairvoyance weatherwise for 10 days into the future. The BOM’s crystal ball only stretches to 7. Google is predicting 9 out of 10 days of showers with max temperatures down to 10 degrees for the Geelong Victoria region. The BOM however thinks it will reach at least 12 Centigrade on those chilly gray days ahead. Who to trust? I simply want to know on which day I can plan to mow my lawn. And the supercomputers and satellites and scientific experts are not really being much help.
Long term climate models? He who pays the piper calls the tune!
60
Perth temp history was discussed on an earlier thread.
Scroll down to History&forecast/Current week…Select All
https://www.wolframalpha.com/input?i=Perth+Australia+temperature+
https://imgbox.com/zaWkhknL
20
In the eighties I gave up computer programming because of the limits of computer memory. But as regards computer models. I see that only those that use Kepler’s laws of planetary motion, can end up correct.
I wrote this for the Mensa Magazine a few years ago:
Astronomers from William Herschel onwards had known about correlation’s between Climate Change and Sun Spot numbers, this was followed by more accurate correlation’s with Solar Cycle Length and then finally, the Hale Magnetic Solar Cycle. By 2018 it had been established that these correlation’s are caused by the speed of the centre of the Sun relative to the centre of mass or barycentre of the Solar System, which determines the length of the solar cycles, or more importantly the 22 year, Hale Magnetic Solar Cycle. This in turn is caused by the orbits and masses of the Planets, short Hale Magnetic Solar Cycles have higher Solar Magnetic activity due to the increase in the speed of plasma within the Sun. Between 1913 and 1996, only one of eight Solar Cycles was longer than the mean Solar Cycle length of 11.04 years, the last of these was the shortest Solar Cycle for more than 200 years, the strength of the Suns magnetic field more than doubled, the cosmic ray flux fell by 11 percent and there was a 8.6 percent reduction in clouds.
Orbital resonance calculations: https://tallbloke.wordpress.com/2021/10/30/orbital-resonance-and-the-celestial-origins-of-earths-climatic-changes-why-phi/
Forecast: This is a 100 year forecast of sunspot cycles, checked by a backward hindcast computer run, which predicts a cooling up to 2050: https://lweb.cfa.harvard.edu/~wsoon/myownPapers-d/VelascoHerreraSoonLegates21-April17-AdvSpaceRes-preprintOnline.pdf
The key is the backward hindcast computer run. But in the media I have only heard it mentioned once by Peter Lilly a British politician who is also a scientist, and I have only heard of its use with Kepler’s laws of planetary motion. So if a Computer Model cannot be checked by a backward hindcast computer run. Then its what Donald Trump calls, a “Hoax”, or what Jo calls, confirmation bias at work.
I call it a taxpayer funded pseudo-scientific religion, using complexity and alarmism, to impress the inferior environ-mental morons, who fund them.
100
Paul C:
I turned on my TV about 45 minutes ago and found a program on the ABC “The Great Awakening” I think. It should still be going but I warn that the few minutes I bothered to watch were pure (if B.S. is pure) alarmism.
Things I heard
1. Clear evidence of global warming as the level of CO2 rose after 1950. (no mention of the Northern Hemisphere cooling until the 70’s)
2.Clear evidence of disappearing Arctic ice (which must have thrown off its camouflage in the last 10 years) since Al Gore et al. claimed it would be ice free in the next few years (2013, or 2014, or 2015 then 2018).
3.More bad/disastrous weather happening (just a statement with, as I’m sure readers ( except simon & PF) would know is evidence free).
4.Loss of Antarctic ice wouldn’t directly raise sea levels when it melted (the only thing no-one could disagree with) BUT they buttress the land glaciers so the disappearance of the floating ice will lead to faster glacier ice movement into the sea. I cannot understand how a weight of floating ice with a near frictionless base could impede 10 or more times ice from a glacier.
I have changed my mind about the ABC, if this garbage is what they broadcast then the sooner they stop being privileged and untouchable CR*P spreaders the better.
50
What is it that causes so many people to embrace almost any alarmism? Do they never stop to consider the pro’s and cons of any argument, to attempt to estimate the biases of proponents, to estimate the probabilities of a result? All people are not equally good at analysing evidence.
Why is democracy superior to other modes of government, if behind the scenes, it is the creature of a smallish clique who hire the journalists, “educators”, media who in turn greatly influence the sheeple? An earlier article by Jo expands below on the psychological aspect.
https://joannenova.com.au/2015/08/psychology-and-climate-alarm-how-fear-and-anxiety-trump-evidence/
60
I have this rather cynical view that the majority of the population don’t have any comprehension of mathematics beyond basic arithmetic. So basic risk analysis is beyond them. Yet everyday a lot of those same people use risk analysis in their everyday activities and decision making. They’ll look at option A vs B, quickly weigh up the risks and benefits and make a decision. Driving a car is a huge exercise in risk analysis!! Also, I think you need to put those risk and benefits into hard $ arguments. How much is it going to cost you if our government goes to Net Zero etc. Michael Cannon Brookes (Atlassian software IT entrepreneur bloke) let the proverbial pussy out of the pouch last week. He stated that it would cost $100 000 for each Australian household to get to Net Zero or equivalent. For him, that’s chicken feed but to most people it should be a OMG moment.
100
Nett Zero is impossible as they can’t get the materials for all those turbines and solar panels in the first place, let alone get rid of the 0.29% of World CO2 emissions in our electricity generation (while China + others raises the level by that much in 2 months or less).
Equally they can’t get the necessary materials for all those EVs everyone would have to buy – they’d run out of child slaves in the Congo first.
(and who makes Electric trucks that make sense?)
And Australian households? Assuming an average of 2 per that would mean 13 million and hence 1300 billion dollars. For 10% of that sum we could up-grade our entire coal-fired fleet and build some new ones. Cheaper, more reliable electricity with lower emissions of CO2 plant fertiliser.
30
NPCs programmed by legacy media fear porn, probably.
10
The success of Western Civilization is killing Western Civilization.
Fear is a human evolutionary survival adaptation.
For individual motivation and social bonding.
Once affluence makes everyone comfortable a psychological vacuum is created.
I personally know people for which deployment to a war zone is a chance to destress.
All the fears are clear, and action required is understood.
(All school teachers should be replaced by really nasty retired platoon sergeants. Social bonding can be rebuilt if hot for teacher is replaced by teacher is a unique SOB.)
Climate Alarmism, and all the new Alarms that types like Joe Biden and Justin Trudeau roll out weekly like a new flavor of cereal,
are just political market products designed to bond their political constituencies and fill the hole in the souls of their affluent, spoiled, unfit for survival voting blocks.
I have just described the fundamental problem of Western society.
And why Climate Alarmism is the mass equivalent of cutting, or self mutilation.
You are welcome. 🙂
40
Glad others had a look at history. The little Ice Age was a time of frightful storms that went on for over a week like the Great Storm of 1703 and the Great Hurricane of 1780. Of course there have always been storms and always will be but forecasting them… good luck. Many times the weather report is way off for the next day or week so how do they get 60 years ahead?
70
What this boils down to is – “Yes, the science is completely settled, but occasionally we get a big surprise like this one.”
50
I would like to throw in the confounding factor of the Hunga Tonga Volcano . Its already had an effect on Australia and must be included in the weather anomaly picture . Weather and climate are very complex systems and the longer the period that you look at the more the variables multiply . Deep thought is required and you won’t like the answer…
60
There is no evidence to support the idea that it impacted climate, it was explosive but of short duration.
01
I’m constantly reminded of a cartoon many years ago showing 2 meteorologists in a room full of high tech equipment looking out the window. One turns to the other and says “do you think it might rain?”
60
There are a few meteorologist cartoons here:
https://www.cartoonstock.com/directory/m/met_office.asp
30
The world has been taken over by the “Greens” who want to destroy all fossil fuel production fearing that if the tide turns, they will lose this opportunity. We are seeing the same push from Germany, the United States, Australia, Canada, and New Zealand. The AGENDA IS TO ACTUALLY DESTROY THE CAPACITY TO PRODUCE and cause so much damage that no future administration will be able to restart what they have destroyed.
https://www.armstrongeconomics.com/international-news/australia-oceania/australia-green-in-control/
This WILL play out the only way it can, and soon.
Vive la…thing.
100
Hence the urgency to destroy proper power stations as quickly as possible, usually as a media circus event with demolition explosives, rather than mothball them.
As was mentioned here the other day, in Commiefornia they are even destroying hydroelectric dams. So not are they destroying their electricity supply, they are destroying their water supply as well.
This is self-destructive insanity of the highest order.
60
Yes they have taken over but “we the people” let them do it. We had our chance here recently to protest vehemently against the climate change actions but instead “we” went the other way and effectively gave them the message to try harder to fight climate change. Stupid is as stupid does. Perhaps next time? We shall see.
00
Can one of the resident warmists please tell me one place where the installation of more unreliables has resulted in lower electricity prices, less CO2cor lower temperatures?
I keep asking but the silence is deafening.
80
Many of the “experts” that advise government are both highly overpaid and incompetent.
Here is an example. A friend of mine has a cousin who has a property near Melbournistan. He wanted to remove some trees as they were a danger to his house.
The expert “arborist” consulted by the local council denied permission because he said they were “protected native trees”. These trees were deciduous. This expert did not understand that Australia has only one temperate zone deciduous tree (Nothofagus gunnii) and that is in Tasmania plus it is a small tree that only grows in the mountains. It was obviously not what he had.
70
David – don’t forget the white and red cedars from NSW & Qld and the tropical Boab which are also native deciduous species.
As for Tassie mountains being temperate – maybe in summer 😅
40
Thanks John, I knew about those but they are tropical or subtropical and unlikely to grow near temperate Melbourne, of which only the Tasmanian tree might conceivably do so. But won’t grow there.
40
trees are objects of worship to the left,
but not quite as much as windmills,
which seem to have the status of totem poles
60
“New data reveals climate change might be more rapid than predicted”
1990: there are 10 years left to save the world
2000: there are 10 years left to save the world
2010: there are 10 years left to save the world
2020: there are 10 years left to save the world
100
DLK, I think you could add-in:
1950 (Nuke fears) there are 10 years left to save the world
1960 (Silent Spring) there are 10 years left to save the world
1970 (Climate Cooling and Peak Oil) there are 10 years left to save the world
1980 (Climate warming) there are 10 years left to save the world
https://www.foxnews.com/science/10-times-experts-predicted-the-world-would-end-by-now
It would make a great reference project if we could document and link all the silly that has never come true.
20
There are some whoppers here too:
https://en.wikipedia.org/wiki/List_of_dates_predicted_for_apocalyptic_events
https://nypost.com/2021/11/12/50-years-of-predictions-that-the-climate-apocalypse-is-nigh/
https://cei.org/blog/wrong-again-50-years-of-failed-eco-pocalyptic-predictions/
https://pjmedia.com/news-and-politics/rick-moran/2019/09/19/50-years-of-failed-global-warming-doomsday-predictions-n69007
20
I remember 2000 as the year that the Sydney Opera House would be swamped with rising water.
00
Recently on Sky News Bolt Report a guest was interviewed and explained how for years past education departments, State Government are responsible) have ignored teachers at public schools ignoring the curriculum and teaching climate change to their students. The videos, very professional presentations apparently, are supplied with notes for teachers and handouts for the students, ordered on line and supplied free of charge.
The sponsors are most of the far left organisations, WWF was one I remember.
And the time used reduces school subject teaching hours considerably yet the teachers get away with it.
10
Why are climate models so bad? And can we expect them to improve any time soon? Steven Koonin, a former senior appointee in the Department of Energy in the Obama administration, explains the problem concisely in his recent book Unsettled: What Climate Science Tells Us, What It Doesn’t and Why It Matters. The most fundamental problem with all climate models is their limited “resolution.” Climate models are surprisingly crude, as they divide up the atmosphere into 100 km x 100 km grids, which are then stacked like pancakes from the ground to the upper atmosphere. Most climate models have one million atmospheric grid squares, and as many as 100 million smaller (10 sq. km) grid squares for the ocean. The models then attempt to simulate what happens within each grid square and sum the results. It can take up to two months for the fastest supercomputers to complete a model “run” based on the data assumptions input into the model.
https://the-pipeline.org/time-to-ditch-climate-models/
Divide a dynamic environment into grids.
Snort..
A link to Steve’s 2021 lecture is here:
https://www.thegwpf.org/content/uploads/2021/11/Steve-Koonin-2021-GWPF-Lecture.pdf
50
Rational thinkers should not call these so-called “models” by that name.
They are NOT models.
They are just computer programs designed to produce “scientific looking” output to fool the ignorant classes but they do not model the real world in any manner whatsoever.
They are not validated.
They have no predictive power.
They are not science.
Their only use and purpose is political.
90
https://news.climate.columbia.edu/2010/08/26/a-beginners-guide-to-climate-models/
16
You have obviously yet to read it, or failed to comprehend it… as usual
Your link describes exactly what they are.. pseudo-science based computer games, simulations of non-reality.
The link is written at a junior high school level.. so you probably would not understand it.
—-
For your education..
CO2 is a radiative gas. It acts nothing whatever like a greenhouse.
Calling CO2 a “Greenhouse Gas” is an anti-science misnomer.
It does not “trap” energy in the atmosphere.
There is no scientific evident it causes atmospheric warming.
—-
Every point that DM has raised is completely and absolutely correct.
They are just computer programs designed to produce “scientific looking” output to fool the ignorant classes but they do not model the real world in any manner whatsoever.
They are not validated.
They have no predictive power.
They are not science.
Their only use and purpose is political.
70
🙂 🙂 🙂
50
about the author: “…Research Coordinator for the Columbia Climate Center. A graduate of Barnard College with a B.A. in French Literature and a minor in Political Science…”
in other words: you are appealing to a non-expert on a matter that can only be the subject of expert opinion.
60
As I said.. written at a junior high school level. 🙂
50
And it appears the only science involved is political.
20
I like this comment on your link though. Don’t you. 🙂
30
Isn’t it interesting that Klaus Schwabb student, Greg Hunt was responsible for:
1) Stopping Tony Abbott having an inquiry into data fraud at the Bureau of Meterology.
2) Mismanagement of COVID at the Federal level and banning safe and effective antivirals like HCQ and IVM.
Two of the most powerful weapons the globalists as represented by Schwabb and Hunt have so far used against freedom are the anthropogenic global warming fraud (1) and covid (2).
100
Poor UK
https://notalotofpeopleknowthat.wordpress.com/2022/05/29/fire-up-those-coal-plants-please/#comments
After destroying most of its coal fired power stations, Kwasi Modo wants coal to come to the rescue next winter.
Would be funny if it wasn’t all so downright idiotic !
Will Australian politicians learn anything ? .. D’OH… of course not !
50
A voter in Avalon on Sydney’s northern beaches told the Weekend Australian that climate change influenced his decision to vote for the Teal candidate. He’s a surfer and knows climate change is real because of sea life alterations in the local rock pool.
Obviously carbon dioxide is to blame. Climate action now!
Sarc.
70
Zane pinpoints the total ignorance of people who voted for Teals/Greens. I’ve asked more than a dozen people 2 basic questions: 1. Current level of CO2 in the atmosphere, 2. Australia’s contribution to greenhouse gas emissions. NOBODY answered these questions correctly. This is proof of how the general public has been brainwashed by the LIES of the ALP/UNIPCC/Green/Teal garbage
50
This link may have been here before but could somebody, anybody, show me a hockey stick in the data presented below.
https://www.youtube.com/watch?v=UJeKJ9K95YE&ab_channel=TonyHeller
http://realclimatetools.com/
If not, I do think the alarmists may have a wee credibility problem…..
10
[…] https://joannenova.com.au/2022/05/doomer-storms-of-2080-are-here-60-years-early-sayth-short- cherry-picked-storm-data-from-pagan-climate-model/ […]
00
[…] https://joannenova.com.au/2022/05/doomer-storms-of-2080-are-here-60-years-early-sayth-short- cherry-picked-storm-data-from-pagan-climate-model/ […]
00
[…] https://joannenova.com.au/2022/05/doomer-storms-of-2080-are-here-60-years-early-sayth-short- cherry-picked-storm-data-from-pagan-climate-model/ […]
00