Gladstone is half way up the coast of Queensland, and though GISS (the Goddard Institute of Space Studies) can claim it has not “adjusted” the data, it appears to have cherry picked it.
Thanks to Ken Stewart for his detailed attention. The information here and graphs come from his blog.
Here’s how you double the warming trend without “adjusting” the data.
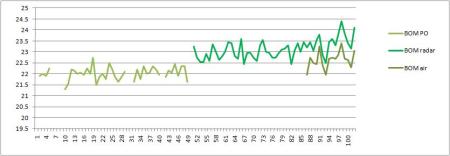
![]() Start with several different records The oldest is the BOM (Bureau of Met) Post Office. The highest is the BOM radar, which stepwise jumps up a whole degree. The last is the BOM Airport, which confirms that the Radar for some reason is 1 degree higher than the rest.
Start with several different records The oldest is the BOM (Bureau of Met) Post Office. The highest is the BOM radar, which stepwise jumps up a whole degree. The last is the BOM Airport, which confirms that the Radar for some reason is 1 degree higher than the rest.
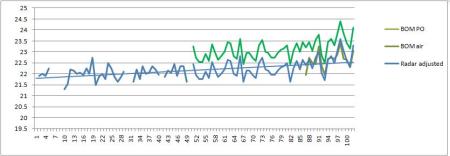
![]() You could drop the BOM Radar figures down to match the other two sets. But, if you wipe out the artificial 1 degree rise in the BOM radar, and if you combined the sets this way, Ken calculates that you only get 0.7 degrees of warming.
You could drop the BOM Radar figures down to match the other two sets. But, if you wipe out the artificial 1 degree rise in the BOM radar, and if you combined the sets this way, Ken calculates that you only get 0.7 degrees of warming.
![]() Instead of this option, you could go the goulash route and carefully selectively delete the awkward parts, ignore the recent lower data set at the airport completely, and splice the left-overs together like this and get a 1.7 degree trend: Tick that box!
Instead of this option, you could go the goulash route and carefully selectively delete the awkward parts, ignore the recent lower data set at the airport completely, and splice the left-overs together like this and get a 1.7 degree trend: Tick that box!

(NB: Assume Gladstone has a local weather cell that’s getting warmer faster than surrounding areas. )
The average trend of the 5 nearest long-record rural sites is 0.8 degrees. Nearby cities of Rockhampton and Bundaberg show adjusted trends of about 0.7 and 0.5 degrees respectively, and Maryborough, ignored by GHCN, shows a trend of 0.4 degrees.
Thus the GISS record for Gladstone is derived from cynically cherry-picked data. The resulting trend of about 1.7 degrees Celsius per Century cannot be justified. The record is false.
If you are James Hansen, it seems you’d choose the goulash. He’s the man responsible for this “trend”.
Does no one have any shame any more? Did they assume that because no one was paid to check their figures that no one would?
A big thank you to Ken, who is doing an excellent job of unpacking the Australian GHCN “trends” on his new blog.
NOTE: The scale on the bottom axis is a little unclear. Ken has noted that the data corresponds with certain years:
“The Post Office from 1909 to 1956 which is dead flat at about 22
degrees; Gladstone Radar from 1958 to 2009, which is immediately 1 degree
warmer, and the Airport from 1994 to 2009, half to 1 degree cooler than
Radar.””


Fox says they are now planning to let us peak at the data.
http://www.foxnews.com/scitech/2010/02/22/tom-karl-tried-to-suppress-data-critics-charge/?utm_source=feedburner&utm_medium=feed&utm_campaign=Feed%253A+foxnews%252Fscitech+%2528Text+-+SciTech%2529
10
It seems that whenever any of the data supporting AGW is examined, this kind of cooking is evident. It’s beyond reason that anyone can look at this and not recognize that the AGW scare has been fabricated from the start.
It’s scary how politics can have such an influence on basic science. Politics is already considered a disdainful profession and unfortunately, scientific professions are being dragged into the gutter with it.
Someday, science will identify something real, for example an impending impact event, and people will not believe it. The chicken little and boy who cried wolf stories are certainly relevant in this case. It’s too bad adults can’t learn from the stories they tell their children.
George
10
Well, the hits just keep on rolling for the IPCC, the CRU, GISS and the NCDC. The CRU altered temperature data (Harry Read Me File), GISS and Jim Hansen keep “adjusting” their numbers to show cooling in previous years and warming in recent years (exception: Hansen was caught in a Y2K error and revised his numbers downward, just once), the number of temp reporting stations continues to dwindle and the ones disappearing are at higher latitude and altitude and it seems every time the raw data is released it shows that the data has been fudged to show an exaggerated warming. Oh, and lets not forget the Bolivia effect. In essence, every land based temp data set is fraudulent, period. What is amazing and never mentioned by the useful idiots in the MSM is the fact that when only rural temp stations are used to avoid the urban heat island effect most of the alleged recent warming disappears. As Anthony Watts has shown, well over 80% of the GISS/NOAA temp stations do not meet NOAA standards and the U.S. temp data set is the “gold standard” of the world.
All the hockey sticks are broken and debunked. The Medieval warm period was, despite the best efforts of the AGW propaganda machine to convince us otherwise, global. There are hundreds of peer reviewed papers to prove that the MWP was global. Since temps were higher and CO2 levels were lower there is nothing unusual about the trivial amount of warming that has occurred since the end of the little ice age. Thank God it did warm up! The LIA was also a global event and not confined to Europe, as the AGW propaganda machine would like us to believe. THe Holocene Maximum which occurred during the bronze age was several degrees warmer than today yet CO2 levels were lower. Still, the climate cabal insists that the earth will suffer an apocalypse unless we revert to the peasant lifestyle. Try selling that to the suffering people of sub saharan Africa!
People all over the world are hurting financially because of the Great Recession. When they realize how much was squandered by these so called scientists the climate criminals will need police protection. Of course, if they are indicted and can’t make bail they will be in protective custody in whichever incarceration facility they are confined to. We need to start a pool on who will be the first to roll over and turn states evidence to avoid prosecution. I got “dibbs” on Briffa, although Jones is starting to look like a potential stool pigeon.
Well, I am going to go visit the FOX News website to see if there is another “gate” swinging open. Maybe they should roll all these gates up into one and just call it what it is, a flood gate!
10
Interesting that their technique for Darwin is quite different than their technique for Gladstone. They use whatever is required to achieve warming!
10
A review of temperature “records” is due apparently – I just love that “robust” word, ho hum
http://wattsupwiththat.com/2010/02/23/met-office-pushes-a-surface-temperature-data-do-over/
10
Tel
The only constant is the result – a generous warming and a comment like “It’s worse than we first thought”. How long do they think they can keep this up before they become a parody of themselves?
Cheers,
Speedy
10
Trouble with Gladstone is UHI, since it has been expanding in population and industry for years.
A good one to look at in Ken’s study is Willis Island, long dataset, ‘way out the other side of the Reef, far far away from the dark hand of UHI.
Willis Island
Nope, I squint as hard as I can and I still don’t see AGW tromping through the data. Because GISS did not have a convenient nearby town to ‘correct’ against they could not do what they did with Mackay sugar mill, and ‘adjust’ the data to give 1C/century of warming out of thin air.
10
Jo, Thank you very much for posting my small effort. You have a talent for taking a nerdy, wordy study and in a few words distilling its content. The years 1951-1956 of the Post office data are the crucial ones- why were they the only years of this dataset used? It’s not just sloppiness, IMO.
Bruce of Newcastle- you hit the nail on the head. In the near future I intend to analyse coastal and island data, and specifically look at the anomaly trends for the ocean grids. Funny biz there too.
Ken
10
James Hansen declared in 1981 that global warming existed. He had only his own “research” to base this on. His bias is so overwhelming he should never have been put in charge of NASA’s climate change research. Can you imagine your career chances at NASA if you didn’t come up with “research” that showed global warming. NASA/NOAA have no credibility because of the people who head them, all of them are global warming proponents for the past 20-30 years.
10
Ken,
Thank you for your diligence. Now I guess all we need to to see if this technique has been applied elsewhere?
10
Ken Stewart:
February 24th, 2010 at 3:56 pm
Ken you’re too modest. You’re effort was significant and terrific. keep up the good work. I have your site bookmarked and am referring others to it as much as I can.
p.s. A word to the wise, keep that Exxon grant money hush hush. Wouldn’t want the alarmists getting wind of it 🙂
10
Eddy #3
“Well, how many readers do you find in rural areas? Our readership is urban, so we only report on urban stations. Doh!”
All joking aside – nice summary, Eddy. 🙂
10
Rereke I’m not convinced that that statement from Eddy is correct, btw, about no warming in non-urban areas. At the risk of being pedantic Eddy do you have a source for such a claim?
10
MattB:
February 24th, 2010 at 7:11 pm
Here is one to start with Matt. From C3headlines.com
many more examples in the above link.
10
Here is some more Matt.
Researchers Find That NYC Urban Heat Island Can Be Up To 8°C Warmer Than Rural Areas.
10
MattB 13
You’re not being “Skeptical” are you??? On ya lad.
Speedy
10
Good one MattB, avoid the obvious at Gladstone with an Eddy Aruba distraction. No dont bother, the fact that you failed to mention Gladstone the first time round tells me all i needed to know.
10
@ MattB
I have lived in this town and I know its population has been reasonably stagnet over a lot of years.
http://www.bom.gov.au/jsp/ncc/cdio/weatherData/av?p_display_type=dataGraph&p_stn_num=010579&p_nccObsCode=36&p_month=13
Sorry i dont know how to link.
Z
10
@ MattB I know that was the annual maximum temp
http://www.bom.gov.au/jsp/ncc/cdio/weatherData/av?p_display_type=dataGraph&p_stn_num=010579&p_nccObsCode=38&p_month=13
So I will give you the annual min as well.
Sorry I did only eyeball it.
Z
10
I didn’t say that UHI did not exist… just that it is not the killer effect to AGW that you hope.
10
re: MattB
You are quite correct that UHI in and of itself does not disprove AGW, but it is contrary to the narrative that the entirety of the planet faces calamity based on unprecedented warming.
The satellite data actually is a less impeachable source of temperatures, although one could argue about calibrations and such.
The bigger problem for AGW is seeking to indict a trace gas which is a beneficial/essential element and the human component thereof, being a comparatively small percentage.
Rather than using AGW has the culprit, one could more rationally look at the recent Northwest Passage opening and consider that from the impact side (regardless of cause), there may be some fundamental risks related to polar warming (and not primarily for polar bears) that merit investigation.
The recent January temperature from the LT (UAH source) indicated the warmest January since the Satellite data was available. That may mean something independent of AGW related to a natural cycle. BUT…if the politicians are too busy wrecking the world economy by trying to force an irrational migration from a fossil-fuel based energy approach, then IF AGW is not the correct theory, even the Green’s optimum scenario for mitigation will have no effect, now will it?
Bottom line, risks of Climate Change could be very real, but AGW is a distraction because it fails to consider alternative (somewhat more likely) natural causes that would not necessarily be prevented by making Al Gore the worlds richest man through his Carbon investments.
Assuming for a moment that non-AGW impacts (which wouldn’t follow the linear projections of the models and wouldn’t be mitigated by migration from fossil-fuels to renewables) could be on the horizon, would it not make more sense to consider alternative causes and potential impact scenarios?
AGW is a lazy approach…essentially, there is coincidental evidence related to the increase of CO2 and Global temperatures since around 1850 (a microscopic sample of the historical record) that conveniently aligns with industrial development and the utilization of fossil fuels. AGW advocates tell us “well, it must be human activity because we can’t think of anything else to explain it”.
Skeptics/realists point to several periods where theoretically, temp’s and CO2 concentrations were much higher. Instead of scrutinizing potential alternative causes to Warming from their self-declared “climate optimum of 1850”, they get bent out of shape that others aren’t accepting their “gospel of AGW”.
Climate change is a reality of life on planet earth…there is a belief system that we must return to a “climate optimum” and CO2 concentrations which may not be relevant, desirable, or feasible. There has always been and always will be change to the earth’s climate…the more rational question, is how do these changes REGARDLESS OF SOURCE, potentially impact our existence as a species. A species self-loathing approach may “feel good”, but if it’s not accurate, then the “cure” may be worse than the illness.
My sincere hope is that the skeptics/realists will explore the true root causes of warming (particularly at the Northern Polar Region) so if there are meaningful impacts and associated mitigations that can be pursued that they can occur, within the realm of true science and meaningful/serious policy discussions with vigorous debate. These mitigations aren’t likely to change the Global Mean Temperature, or even the regional temperatures at the NP. But if we understand the actual risks of a warmer NP, then maybe some steps can be taken to address those risks.
It may not work out as well for Al Gore, but for the rest of us…might actually make a difference.
10
UHI on its own proves nothing one way or the other. But it does skew temperature records even for quite small towns. Therefore GISS claim to have accounted for it by adjusting or homogenising data for towns… except when you dig into the data you find something entirely different. Sometimes they do adjust appropriately (but even that needs checking!) but many times they increase the warming or as in Gladstone’s case cherry pick the data to show warming and then leave it as is. Possibly there’s a lower population limit in their algorithm and they haven’t bothered to check whether Gladstone’s population is still 22,000 or may have grown a tad. More than just sloppiness.
10
Further to the UHI issue, Icecap has just posted a piece from a guy called Edward Long, who looked at 48 US rural stations and 48 urban stations. The raw data shows very little warming in the rural locations, but this was adjusted upwards by NCDC. By contrast the urban temperature anomaly appears not to have been adjusted.
‘A Pending American Temperaturegate’ by Edward Long, American Thinker
He does not say why NCDC adjusted the raw data in this way, but I cannot see any reason why real AGW would not cause raw rural temperature series to rise. It doesn’t make sense to me.
10
I was checking out the temps at Broken Hill and came across some anomalies which I suppose is everywhere throughout the BOM records.
On the raw data for Broken Hill (Patton St) I noted that the annual average temp for 1914 is 25.9C.
http://www.bom.gov.au/jsp/ncc/cdio/weatherData/av?p_nccObsCode=36&p_display_type=dataFile&p_startYear=&p_stn_num=047007
Australian high-quality climate site data for the same w/station shows nothing like that.
http://www.bom.gov.au/cgi-bin/climate/hqsites/site_data.cgi?variable=maxT&area=nsw&station=047007&period=annual
So raw data shows 1914 warmer than anything this decade but does not show up on the graph. Is this what they call ‘homogeneity adjustment”?
Then check NASA GISS temp graphs for the same station.
http://data.giss.nasa.gov/cgi-bin/gistemp/gistemp_station.py?id=501946890000&data_set=1&num_neighbors=1
with
http://data.giss.nasa.gov/cgi-bin/gistemp/gistemp_station.py?id=501946890000&data_set=2&num_neighbors=1
to show the difference between locally adjusted raw data and homogeneity adjusted data.
At least it shows 1914 as Broken Hill’s highest temp. The temperature data is totally unreliable.
10
Ian George:
That’s what’s happening in many places- a warm period from say 1912 to 1930s, but it varies from place to place. Te Kowai’s was 1931. Gayndah 1897. Many places like yours around 1914-15. GISS appear to have tried to remove this earlier warming but their methods are rather crude. We need to keep digging and compare their data with the raw data every time as you have done.
10
If anyone reading is in Gladstone, can they slip out to the airport, take photos of the ‘airport’ and ‘radar’ measuring stations. I wouldn’t mind betting ‘airport’ is on grass and ‘radar’ is on a concrete building.
10
Gaz@26 (and JoNova)
In Casino, NSW, there is a manual W/S and an AWS within 300m of each other, both at the old airport. The manual is only a few metres from a tarred road and surrounded by buildings whereas the AWS is on a grassy oval with no buildings within 60 metres. The manual always records a higher temp than the AWS.
For instance the 2009 yearly max average for the manual was 27.0C and 14.4C minimum whereas the AWS was 25.9C and 13.9C respectively. This is a good example of what you are suggesting and probably a guide to the UH effect.
Ken @ 25
I have found many examples of the dumbing down of the raw data when converting to the graphs in Australian high-quality climate site data section of the BOM, especially prior to 1930. I looked at some 50 long-term weather stations and found 75% (but interestingly, not Aust capital cities) had a higher max in 1914 than 2008 but 2008 is regarded as warmer than 1914 .
When you then looked at these stations that showed a warmer temp in 1914 using the raw data, you find that they have been dumbed down by some 0.7C in the trend data. This also happens in NASA GISS between the ‘raw data’ and the ‘homogeneity adjusted’ for many stations.
The whole data set here needs to be reviewed (as is now happening in England).
10
Ian George:
“Dumbing down” I like. Have you published your findings? I’d be very interested- might save some doubling up.
10
Ken @28
Try this.
Raw data for Lismore. NSW. 1915 – 27.4C.
http://www.bom.gov.au/jsp/ncc/cdio/weatherData/av?p_nccObsCode=36&p_display_type=dataFile&p_startYear=&p_stn_num=058037
Trend map ‘adjusted’ – 26.7C
http://www.bom.gov.au/cgi-bin/climate/hqsites/site_data.cgi?variable=maxT&area=nsw&station=058037&period=annual
Notice that many of these temps have been ‘dumbed down’ for this period but not the most recent.
This happens to many rural weather stations.
10
I have found the same in WA
Marble Bar
http://www.bom.gov.au/cgi-bin/climate/hqsites/site_data.cgi?variable=maxT&area=wa&station=004020&period=annual
http://www.bom.gov.au/jsp/ncc/cdio/weatherData/av?p_display_type=dataGraph&p_stn_num=04020&p_nccObsCode=36&p_month=13
Southern Cross
http://www.bom.gov.au/jsp/ncc/cdio/weatherData/av?p_display_type=dataGraph&p_stn_num=12074&p_nccObsCode=36&p_month=13
http://www.bom.gov.au/cgi-bin/climate/hqsites/site_data.cgi?variable=maxT&area=wa&station=012074&period=annual
Kalgoorlie , Meekatharra , Geraldton have all had the 1930’s ‘blip’ reduced on the Bom’s Quality site by combining stations.
Halls Creek is a doosey
The town was moved 12 km west and 63 metres uphill in the 1940’s
http://members.westnet.com.au/rippersc/hchomog.jpg
http://members.westnet.com.au/rippersc/hcjanjulycomp.jpg
The old town was in a basin and had much lower minimums in winter, yet the Bom managed to increase the trend from ~ .3C/100 combined to 1.31c / 100 years
10
This ‘dumbing down’ of the earlier temps fits in with many stations I have checked out. It also happens with NASA data with the homogeneity adjusted figures. By the way, how do you get to the graph from the raw data page?
10
Click on the little graph icon on the top of the column.
10
Thanks so much.
10