|
|
||||
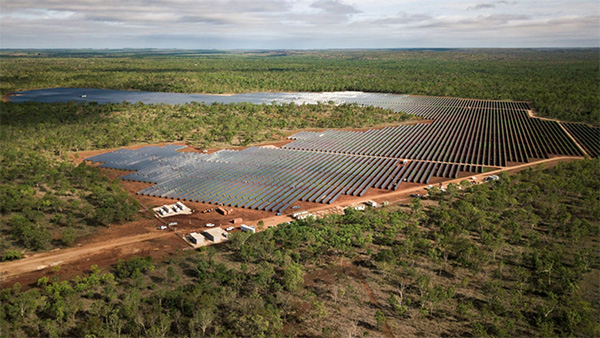
The Northern Territory is a test case for renewable energy and it’s a bonfireIn 2016, the new Labor Government waved a magic wand and commanded they would be 50% renewable by 2030. The experts said it was doable and would save $30 million a year. They gave out the permits for large solar installations, which began construction in 2019, but then suddenly changed the rules in 2020, and wouldn’t let the solar plants connect to the main Darwin-Katherine grid. Unbelievably, 64 megawatts of solar panels that cost $40 million dollars have sat, doing nothing, for four long years. “It’s just reflecting back into space, not being used to power the grid and to substitute for diesel and gas turbine production,” said local vet Peter Trembath, who leased his land to energy company Eni Australia for the solar project. “It’ll be some technical issue, but you’d reckon they would have sorted that out before Eni spent $40 million to erect it.” — Max Rowley, ABC News June 2022 It’s always the Grids fault…The reason they couldn’t be connected was that the Territory government suddenly rewrote the rules in February 2020 and insisted the solar generators had to operate like fully scheduled generators, not semi-scheduled ones. Cruelly, they would have to make accurate predictions of what they could supply 30 minutes ahead on a rolling 5 minute basis. This meant they would need their own battery backup with the equivalent of 80% of their capacity and storage that lasted 30 minutes. They’d also need “weather forecasting” ability to predict cloud cover. The solar owners, Eni, protested that this would cost them $20 million (at least!) making the project unviable. And to make things even worse, the government was saying they had to build the battery at the solar plant, and reserve it to back up their own panels, so they wouldn’t be able to build the battery in Darwin, and use it to help the grid at other times, which would defray the costs. It all seems quite bizarre. (Who would want to run a business in the Northern Territory?) Why didn’t the renewables industry protest these belated draconian conditions louder? Probably because they didn’t want to highlight the reason for the Territory government’s sudden flip. It suddenly makes sense when we look at the timing. The panic-attack about connecting solar power came just after the Alice Springs black startThe NT government didn’t appear to realize that there were risks in adding 64MW of solar power to a grid that was roughly 250MW in size until 13th October 2019 when the whole Alice Springs network serving 29,000 people collapsed due to a cloud. It was the third blackout in four years, and it must have terrified the management in Darwin, because Alice Springs didn’t have much solar, yet the system was so unstable. Only 13% of the town’s total electricity comes from solar panels, but one cloud was enough to knock that little grid over and it took over nine hours to get it restored. By December 2019, an inquiry was set up and both CEO’s of the Power and Water Corp and the Territory Generation lost their jobs. Presumably the new CEO’s were not going to risk the collapse of the larger Darwin-Katherine Grid, hence the sudden rule change in February 2020 which left the solar operators high and dry. The ABC and others insist the blackout had nothing to do with solar power, and was just due to incompetence, but all the new grid managers grabbed their electrical garlic and acted exactly like solar power was the vampire. How else do we explain that these perfect solar plants have been sitting there doing nothing for four years? So 64MW is too much for Darwin, but lets build 4,000?Clearly grids need their armour before anything so risky as a large solar plant can be connected, which is all the more poignant considering the Australian government just approved (again) the humongous SunCable plant, what will be the “largest plant in the world”, at 4GW, and it’s going to be in the Northern Territory. It’s 60 times bigger than the 4 Eni plants, but is supposedly going to send most of the green electrons to Singapore, a mere 5,000 kilometers away, which is lucky, because the whole Darwin-Katherine grid only uses 250MW at peak, so SunCable would eat it alive. The people will pay for the solar debacleThe new NT Generator Performance Standards were trying to make sure that the Territory’s consumers wouldn’t end up footing the bill for the backup and wouldn’t suffer a blackout. But the Territory Government has paid $45 million to build a battery in Darwin anyway, and looks like it will try to buy out the four idle solar plants from Eni. So the citizens will be whacked for the cost one way or the other for the magical wish-fairy thinking that renewables would be easy and cheap. As it happens the people of the NT get to vote tomorrow in the Territory elections. Lets hope there is some salvation. Though on the media apparently the major issue is not about keeping the lights on, or whether the NT is a basketcase for investors, but whether people can keep crocodiles as pets. No, seriously. (And they’re talking about the Saltwater kind which eat people, and grow to 6m and 1,000kg.)
There are only about 250,000 people living in the Northern Territory. There are two separate grids and several microgrids. All of these are perfect test cases to showcase renewable energy, as I keep saying, and none of them are managing to do it. When will we get the message? If a town of 30,000 can’t live off the sun and wind, why would anyone bet the whole nation on it? h/t CO2 Lover
August 23rd, 2024 | Tags: Big-Government, Electricity Grids, Microgrid, NT (Northern Territory), Renewable Energy, Solar Energy (PV) | Category: Australia, Big-Government, Global Warming, Renewable, Solar Power |  Print This Post | | Print This Post | |
By Jo Nova No one saw this car crash coming?EV’s represent just 0.9% of all cars on the road in Australia but plans to install fast chargers are already grinding to a crawl. Last year, Ampol was planning to build 180 EV charging bays by the end of the year. Instead it’s proved difficult to even reach half that target. Eight months after they were supposed to have 180 in action they’ve reached 92. Just throw money…A mere 3 weeks ago Ampol announced that thanks to a $100 million dollar grant from the Australian government they would install more than 200 new fast chargers at Ampol’s national network of petrol stations this year. But presumably after making a few phone calls they’ve realized it’s not going to happen. (You’d think they might have made the calls before putting out the press release? Or the Minister might have phoned a friend before tossing $100 million to the wind?) Power grid foils Ampol’s big EV charger plansBen Potter and Simon Evans, Australian Financial Review Ampol, one of the country’s largest petrol retailers, has dialled back plans to triple the number of electric vehicle chargers because of power grid limitations in a blow to government hopes of pushing motorists towards cleaner cars in big numbers by 2030. The company’s chief executive, Matt Halliday, said it would not be possible to expand the number of charging bays from 92 to 300 by the end of this year because of difficulties connecting chargers to the grid which is already struggling to cope with an influx of renewable energy generation. In March, Energy Minister Chris Bowen said the government would spend $60 million helping car dealerships install chargers on sales lots. [As] much as we spend a lot of time talking about generation, firming and transmission infrastructure, the last mile distribution grid is not really built for large-scale electrification, despite the best will that the players have to try and make it happen,” Mr Halliday added. “There are a lot of constraints that need to be worked through.” These people are not good with numbers. A fast charger needs 300 kilowatts, and if there are three car charging spaces in a row, that’s a major load that our low voltage lines simply can’t bear. In order to get the local distribution networks upgraded the wait times to connect these fast chargers can be as long as two years. Not to mention that we’re supposedly aiming to make all new cars electric in a mere five years or so, while we also try to shut down our largest coal plant. At the moment most EVs charging overnight are probably burning more fossil fuels than petrol cars do. The EV revolution in Australia (should it happen) would rampantly increase our carbon dioxide emissions. But who cares, right? It was never about CO2. It’s not like engineers haven’t been warning us this was going to happen for ten years. h/t Dave of Cooyal in Oz, and CO2 Lover
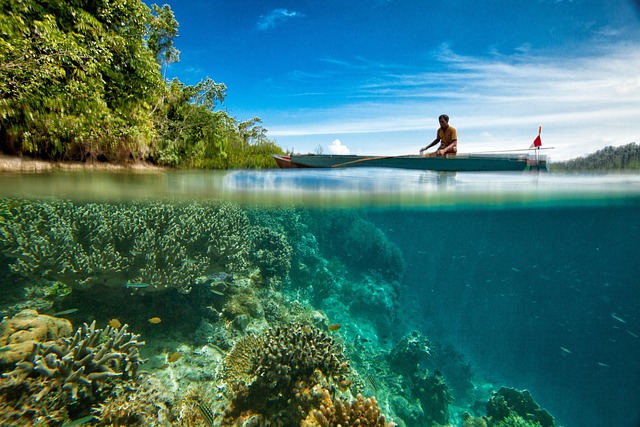
By Jo Nova For some reason our long climate proxies work for hundreds of years but always seem to stop working just before the man-made catastrophe appears. It seems to me that if a coral-tree-clam-sediment thermometer worked in 1393, it should work in 2020. It’s not like Earth has run out of trees, mud, pollen or corals. So here we are again, this time with a new Fijian coral that runs 627 years continuously from 1380 to 1997. And the experts have to slap “an instrumental record” on for the last twenty years to find the catastrophe. The actual single coral core shows the water of Fiji was the same or even slightly warmer in the Medieval warm period as it was in the 1990s. There’s no sign at all, in 600 years of this coral, that man-made carbon dioxide has had any effect at all on the water around Fiji. The new data comes from a coral core drilled in 1999, which explains why it suddenly stops. It does not explain why the world is about to end, but worried scientists waited 25 years to assess the coral core. The apocalypse is upon us, but no one can find a new big coral to study it in real time?  Click to enlarge Since the Pacific is a long way from Europe and Antarctica, we also confirm, yet again, that the Medieval Warm Period and the Little Ice Age were global events. Some force was warming the Earth 600+ years ago and the experts don’t know what it was. Then the Earth cooled, and the experts don’t know what caused that either, though the sun was suspiciously quiet, but we’re not supposed to mention that. The water around Fiji started warming in 1800AD, long before humans invented coal power or model T Fords. The experts tell us this is a “significant departure” from natural variability, and the hottest in 600 years. But it’s only when they superimpose ocean buoys and other instruments that the “record” hottest ever temperature appears like magic at the end.  Click to enlarge Despite the authors forgetting to label the instrument data in the key on the graph, the caption contains the fine print “Also shown is the most recent SST data for Fiji from ERSSTv5 (1998 to 2021) shown in (E) (black).” So the only data for the “record” spike in the last 20 years of corals, comes from thermometers (and statistical infilling) instead. Wouldn’t you know? So yet again, even though I hear there is still coral living around Fiji, the key hottest ever record part of the graph is not from that coral. I’ve been asking for years for a long proxy to show we have a crisis. One solitary proxy that assesses temperatures in 2020 as well as it did in 1703 or 1492. Does anyone know one? If corals and clams work so well as thermometers do, surely Australia, with the worlds largest living reef, ought to have hundreds of old corals we can study? You’d think if our climate scientists cared about the climate and were given, say, $440 million dollars to spend, they could have found some? But perhaps they have to leave them in drawers for 20 years so they have room to tack on the instrumental spikes at the end? And here are lots more graphs from the paper showing that CO2 has made no difference to the climate. A is the Southwest Pacific. B is the Macassar Strait, D is from Palmyra, E is the central pacific, F is the Galapagos, and none of them show anything we should spend a trillion dollars on. Paleo Hydrodynamics Data Assimilation product (PHYDA)  Fig. 2. Fiji coral composite annual Sr/Ca-SST record, WPWP model simulations and proxy reconstructions, and the SWCP SST gradient. The propaganda from Phys Org:Fijian coral reveals new 627-year record of Pacific Ocean climateAn international team of climate scientists have used a 627-year coral record from Fiji to reveal unprecedented insights into ocean temperatures and climate variability across the Pacific Ocean since 1370. It’s not even phrased as a link or association, it’s so weak it’s an “interaction”: The study published in Science Advances, co-authored by Dr. Ariaan Purich from Monash University and Professor Matthew England and Dr. Rishav Goyal from UNSW, shows how human-caused climate change is interacting with long-term patterns of climate variability in the Pacific Follow the long tenuous wandering path to “human derived” blah: The new coral record shows that the local ocean temperature was warm between 1380 and 1553, comparable to the late 20th and early 21st centuries. However, when combined with other coral records, the Pacific-wide warming observed since 1920, largely attributed to human-derived emissions, marks a significant departure from the natural variability recorded in earlier centuries. No. The coral record does NOT show this: The record also shows that present ocean temperature is the highest for the past 653 years. And there are no implications for millions of people either, other than we should stop wasting money immediately: The work provides new insights to understand how climate trends are leading to shifts in weather patterns and more extreme weather events that will have significant implications for millions of people living in the Indo-Pacific region.osystems across the vulnerable Pacific Island nations.” The money line comes next– the whole point of gouging a hole in a 600 year old coral is to advertise the renewable industry and justify trillion dollar government policy mistakes. What is a line like this doing in a press release of a scientific coral study? The study provides further motivation for the global community to keep working towards limiting warming to 1.5ºC by developing renewable energy resources at scale, to electrify the economy and phase out coal and gas. Government funded scientists have become prostitutes for Big Government. I would love to be proved wrong. But we all know that no government funded professors could dare criticize this study. Thanks to all the supporters who help fund me so I can. REFERENCEJuan P. D’Olivo et al, Coral Sr/Ca-SST reconstruction from Fiji extending to ~1370 CE reveals insights into the Interdecadal Pacific Oscillation, Science Advances (2024). DOI: 10.1126/sciadv.ado5107 J. E. Tierney, N. J. Abram, K. J. Anchukaitis, M. N. Evans, C. Giry, K. H. Kilbourne, C. P. Saenger, H. C. Wu, J. Zinke, Tropical sea surface temperatures for the past four centuries reconstructed from coral archives. Paleoceanography 30, 226–252 (2015). Oceans2K records. (PS: When Steve McIntyre dissected the Oceans2K dataset he found many of the alkenone records in it were mysteriously cooling in the last fifty years.) Image by Kanenori from Pixabay
August 21st, 2024 | Tags: Evidence, Evidence (AGW disproved), Little Ice Age, Medieval Warm Period, Pacific Ocean | Category: Evidence, Global Warming, Marine, Marine Life | Print This Post | |
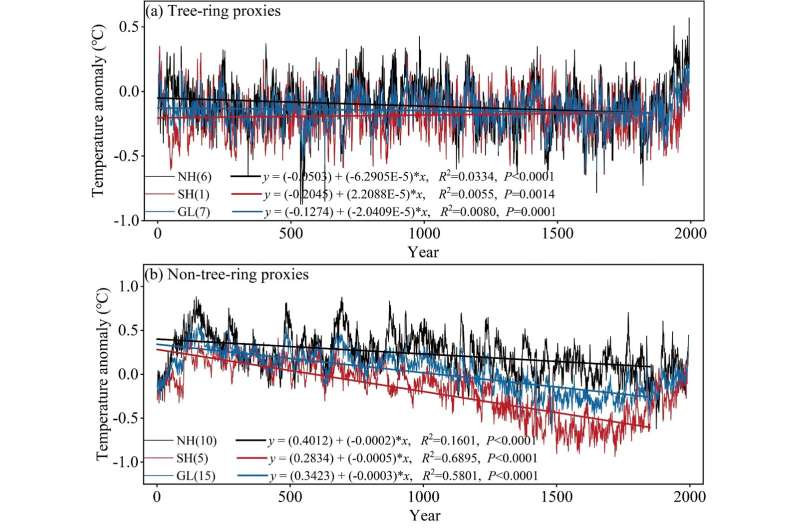
What if a few gigawatts of solar power disappeared without a warning or a cloud in the sky?Imagine a hostile force had control of half your national power generation at lunchtime and could just flip a switch to bring you to your knees? Or how about a crime syndicate wanting a ransom paid by 5pm? Steve Milloy: Communist China is setting us up for solar panel-based disaster: “Solar panels that make the electricity suitable for the power grid and which are usually connected to the web, can be “easily hacked, remotely disabled or used for DDoS [Distributed Denial of Service] attacks.” DDoS is one of the most common types of attacks, which basically try to overwhelm a system… Solar panels were outlined as a vulnerability in several scenarios, also due to the dominance of a single country, China, in the supply chain.” It’s only a week without electricity…Daniel Croft, CyberDaily (October 2023) Cyber Security CRC chief executive Rachael Falk said… that an attack on the solar grid could spark a “black start” event, which could result in the entire power grid going down. … “This could bring down an entire power grid, and it could take a week to recover,” she said. [Falk said] the threat presented by foreign-manufactured solar inverters is a recent one, as only recent models are internet-connected due to increased interest in smart home technology. “Traditionally, cyber risk with solar inverters was low because they were not connected to the internet,” said Falk. “However, as the popularity of smart home energy systems has boomed, this has changed, with most solar inverters now web connected.” The EU and the US have both had a wake up call in the last few weeksA Dutch white hat hacker got into one system a couple of weeks ago with 4 million panels in 150 countries, exposing a major flaw. That software glitch in American Enphase inverters was fixed quickly once they were aware of it, but how many other doors remain open? Only two weeks ago another group called Bitdefender claimed that 20% of the worlds solar panels and 195 gigawatts of capacity, had been at risk of cybercrime for months. Rooftop solar management software by Solarman and Deye (both Chinese solar manufacturers) is used by 2 million “solar plants” and 10 million devices. Hackers could have been able to take control of the inverters (which could “change the way the inverters interact with the grid”. They could also steal quite a lot of data, including real time GPS locations and production. What if they could target individuals? Apparently those issues were reported in May but are now patched too. (I guess no one would be mentioning any issues which are not patched, would they?) SecurityBrief has the gory details. Whatever threats exist in the Netherlands, Australia is a sitting duckEven at lunchtime in winter, sometimes half of the Australian national grid power comes from solar panels. That’s 12 gigawatts of solar power out of 25 gigawatts in toto. (And it’s similar in WA). Here in the renewable crash test dummy, fully 58% of the solar inverters that are connected in to the internet come from companies headquartered in China. (And the rest are headquartered elsewhere, but who knows, maybe they’re made in China too, where 70% of the worlds solar inverters come from?)  Solar power is a large part of the Australian NEM, even in winter. The black line is total generation. The NEM includes NSW, QLD, Vic, Tas, SA. (Source: Anero.id) So Cyber-expert Falk gave us that warning of a black start disaster in October last year, and how far have we got? By January we were redoing our cybersecurity plans, but somehow still forgetting about smart home devices like solar inverters and control of our national critical infrastructure. But, not to worry, by February we had the news that we were hiring Standards Australia, to develop “a roadmap”. (That’ll stop them!) Meanwhile we’re still going gangbusters on solar installations. We can always rely on the government to White hat hacker shines spotlight on vulnerability of solar panels installed in EuropeBy Nikolaus J. Kurmayer | Euractiv An ethical hack of solar panels in the Netherlands has revealed their vulnerability to cyber attacks, prompting industry calls for more rigorous safety assessments. A Dutch white hat hacker could have gained control of millions of smart solar panel systems, reports investigative outlet FollowTheMoney, using a backdoor. The findings confirm a 2023 report by a Dutch agency which found that converters, essential parts of solar panels that make the electricity suitable for the power grid and which are usually connected to the web, can be “easily hacked”… A report by the EU’s own cybersecurity agency from 24 July found that the union is ill-prepared for a concerted attack on its energy infrastructure, whether by a foreign state or by malicious insiders. How much will that cost?We need to test and possibly replace inverters and fix the software: A report by the Perth’s Cyber Security Cooperative Research Centre “recommends assessments be conducted on all solar inverters sold in Australia, with identified vulnerabilities requiring remediation. The report also says cyber security ratings should be introduced for solar inverters and IoT devices more generally, as well as recommending solar inverters with identified serious cyber vulnerabilities be banned from retail sale in Australia. Thanks to Marc Morano of Climate Depot. August 20th, 2024 | Tags: Cybersecurity, Solar Energy (PV) | Category: Australia, Big-Government, China, Global Warming, Solar Power, UK | Print This Post | | How much money has the world wasted because of some tree ring studies?A Chinese group has looked at all the different kinds of 2,000 year long proxies in the PAGES dataset and found that history looks quite different depending on which proxy you pick. Only the tree rings show the HockeyStick shape that matches the climate models. In other proxies, temperatures have fallen for most of the last 2,000 years, especially in the Southern half of the world. And even after the recent warming, we are not yet back to the temperatures the Romans lived through. So yet again, we see that that current temperatures are not unusual except according to tree rings, which we know are affected by rising levels of CO2. (The paper does not mention CO2 or carbon or fertilizer). “All the evidence points out that we are still far from a complete understanding of the Common Era temperature variability at hemispheric and global scales,” says Professor Yang.” “We show that the millennial cooling of annual mean temperatures is likely a global phenomenon.” The world according to tree-rings is at the top, and other proxies, below:
The map showing that the proxies are spread around the world. There are not that many proxies stretching back 2,000 years:  Figure 1 Locations of the proxy data used for the temperature reconstructions over the past 2000 years. The paper looked closely at how all the proxies responded to volcano eruptions, and tree rings do seem to be useful. But without acknowledging that trees love carbon dioxide and grow faster with the fertilization effect of extra CO2, it feels like they are dancing around the point. They said tree rings capture the variability of shorter periods (less than 200 years) but that non tree ring proxies were better for variations longer than 200 years. The news that matters the most to mum and dad voters is that they found a significant long term cooling trend, but that information is buried in the text. And as so many proxies have shown, global warming started back in the late 1600s, long before human emissions of CO2 started. UPDATE: Look at the non-tree-ring proxy — the warming began in the Southern Hemisphere before 1700AD. See also the 120 proxies of Christiansen and Ldundqvist, and the signal in China. What started that? Climate modelers have no idea. It wasn’t cars and coal power. It wasn’t man-made CO2. We don’t understand the big forces that drive our climate, yet we make you pay for your imaginary sins anyway. Study finds temperature reconstructions during the Common Era are affected by the selection of paleoclimate dataKeep reading → August 17th, 2024 | Tags: Hockey Stick Graph, Little Ice Age, Medieval Warm Period, Paleoclimate, Roman Warm Period | Category: Global Warming | Print This Post | |  Every person here is breathing out 40,000 ppm CO2 Elon is scratching for a reason to keep worrying about CO2In the interview with Donald Trump, Elon Musk tried to argue that we ought be limiting carbon dioxide because we are too close to 1,000ppm where people get headaches. Not to put too fine a point on it, but we breath out air at 40,000 ppm fifteen times a minute for our entire lives. If 1,000 ppm gave us a headache or made us nauseous, we’d have to hold our breath every time we kissed someone. @ElonMusk: The point I was making is that, even if CO2 did not cause global warming, it is uncomfortable to breathe air with >1000 ppm of CO2. Given that the outdoor ppm away from cities is now ~420 (lol), it is already getting close to 1000 ppm indoors in cities at times. You can buy a cheap CO2 monitor and measure this for yourself. As the global base level of CO2 keeps increasing, it will cause air quality in cities to feel stuffy and unpleasant, resulting in drowsiness, poor concentration and eventually headaches and nausea. That would not be a good future. And then he quotes CO2meter.com which, ahem, sells CO2 meters, and has an incentive to wildly overstate the problems with CO2, which they do. CO2 is not the problem, the stale air and other pollutants cause headaches and sleepinessThe point of CO2 meters is not so much to warn us about excessive CO2 levels, but to indicate how well the room is ventilated. CO2 levels are just an indicator for air quality. Air with higher CO2 levels usually also has higher levels of organic compounds, humidity, body odour, mold, chemicals from furniture and paint (like formaldehyde) and potentially viruses too. When people report headaches and nausea, the high CO2 levels are not the issue, it’s the bioeffluence that causes problems. When researchers do cognitive tests with pure CO2 added to clean air, performances don’t suffer. The stale air is the problem, not the CO2. (See Zhang, and Misra where they compared the cognitive effects from badly ventilated air and clean air with high CO2 levels up to 3,000ppm. Problems disappear when they use fresh air plus higher CO2.) Well ventilated rooms may also be cooler rooms, which might explain why results so often contradict each other. Classrooms are at 1,000ppm “typically”While outdoor air is 420ppm, indoor levels of CO2 are commonly 1,000ppm in classrooms every day, and can rise as high as 3,000ppm if all the windows are shut. The recognized occupational health and safety levels for long term working exposure are 5,000 ppm for 8 hours straight, five days a week. It’s no big deal. The National Collaborative Centre for Environmental Health (Canada) measured school and buildings and advises that “Typically, in an occupied classroom situation, the recommended level of ventilation would correspond to a CO2 level of approximately 1000-1100 ppm“. Furthermore, they said the “lowest level at which a human health effect (i.e. acidosis) has been observed in humans is 7,000 ppm, and that only after several weeks of continuous exposure in a submarine environment”. The occupational limits for CO2recommended by the American Conference of Governmental Industrial Hygienists (ACGIH) are 5000 ppm (TLV-TWA) and 30,000 ppm (TLV-STEL), based on the direct effects on acidification of the blood. — via Marc Morano and Climate Depot
At NASA The Office of the Chief Health and Medicial Officer reports that a typical spacecraft works at around 3,000-7,000 ppm (or o.3-0.7% CO2). The recommended exposure is 5,000, and the permissible exposure limit is 10,000 ppm. Although the flight surgeons found levels of nearly 7,000 were safe and “didn’t affect performance”. On Apollo 13, CO2 levels rose to 20,000ppm. Sweating and shortness of breath became a problem above 30,000 ppm. Submariners typically live with CO2 levels of 2,000- 5,000 ppm, and when a small sample of sailors was tested at 600, 2500 or 15,000 ppm, the researchers couldn’t find any difference in results from an 80 minute test on decision making. (Rodeheffer at al) Likewise another study at the Johnson Space Centre, people did cognition tests at 600, 1,200, 2,500 and 5,000ppm and there was no dose response effect. Results look rather random. Lowther et al looked at 51 studies in 2021, and found nothing conclusive in terms of harms from CO2 below 5,000ppm. Most studies were confounded, results were conflicting. Teams of researchers are hunting to find another problem “due to CO2”. If there was a strong negative effect of CO2 it would have shown up by now. Instead CO2 is only associated with occasional headaches and nausea — probably because it is high in crowded rooms with little ventilation. One large review in 2019 was described as showing CO2 affected people at levels as low as 1,000ppm, but the paper itself points at the confounding data and uses the words “possible” and “potential effects” and concludes “we need more studies.” UPDATE: Commenters Alan Klein and Mr Farnham points out the safety limits for Australian coal miners (NSW) is 1.25% CO2 which is 12,500ppm, and that is for 8 hour shifts. Brief excursions up to 3% (30,000ppm) are acceptable. See comment #17 for more details. REFERENCESLowther, Scott D., Sani Dimitroulopoulou, Kerry Foxall, Clive Shrubsole, Emily Cheek, Britta Gadeberg, and Ovnair Sepai. 2021. “Low Level Carbon Dioxide Indoors—A Pollution Indicator or a Pollutant? A Health-Based Perspective” Environments 8, no. 11: 125. https://doi.org/10.3390/environments8110125 Mishra AK, Schiavon S, Wargocki P, Tham KW. Respiratory performance of humans exposed to moderate levels of carbon dioxide. Indoor Air. 2021 Sep;31(5):1540-1552. doi: 10.1111/ina.12823. Epub 2021 May 15. PMID: 33991134. Rodeheffer CD, Chabal S, Clarke JM, Fothergill DM. Acute Exposure to Low-to-Moderate Carbon Dioxide Levels and Submariner Decision Making. Aerosp Zhang X, Wargocki P, Lian Z, Thyregod C. Effects of exposure to carbon dioxide and bioeffluents on perceived air quality, self-assessed acute health symptoms, and cognitive performance. Indoor Air. 2017 Jan;27(1):47-64. doi: 10.1111/ina.12284. Epub 2016 Mar 7. PMID: 26825447. h/t to Willie Soon, Marc Morano and Climate Depot. Photo: NASA/Mark T. Vande Hei (taking some images of the Russian modules) Jan 2022
By Jo Nova It’s something to be proud of: Russia, Australia and USA have the biggest Greenhouse Gas Export footprint on Earth. It’s a bizarrely contrived title though, where we have to ignore domestic emissions and blame countries instead for the fuels they dig up which someone else uses. (You know they want to). We could play this game in so many ways. If China uses Australian coal to make a fridge, do those emissions belong to Australia, or China or to the Norwegian who bought the fridge? Correct answer: “all three”. The game of emissions mobile-blame means the shame can be applied to whichever patsy is the most useful. Double counting is not a mistake, it’s a marketing tool. In a normal world, no one is responsible for what someone does with goods they sold, but in green economics, comrade, it all belongs to the Party. You are supposed to badger and harass the people you sold the goods to, to ask them not to use it: [Dr Gillian Moon] said if Australia was serious about its climate commitments, it should be doing more to encourage countries that bought its fossil fuels – particularly the developed economies Japan, South Korea and Taiwan that take about two-thirds of its exports – to move more rapidly to renewable energy. She said it should be having similar discussions with like-minded fossil fuel exporters, such as Canada and Norway. (From The Guardian, linked below). What this graph really shows is who is the Great Global Patsy — not Russia, because they are not working directly against their own economic interest, but Australia — the nation which stands to lose the most money per capita due to the demonization of fossil fuels, and which aids and abets the carbon-hate all the way, and never spends a cent to audit the UN Committee. This one-sided study was, of course, done in Australia. It was put together by the UNSW “Human Rights” Institute which spent exactly no minutes thinking about the human rights of poor people who want to be warm and buy our coal. Nor did they consider the starving kids of Haiti who benefit from cheaper food grown in a world with bountiful CO2. The US has larger fossil fuel exports than Australia, but we export more coal, which is a more “emissions intensive fuel”, they say, so we export more emissions. (They should pay us for the coal, the oil, the gas, the fertilizer, and the warmer weather).
Source:Climate Analytics
Australian fossil fuel exports ranked second only to Russia for climate damage with ‘no plan’ for reductionAdam Morton, The Guardian Australia’s coal and gas exports cause more climate damage than those from any other country bar Russia, according to a new study that argues the country is undermining a global agreement to transition away from fossil fuels. The analysis, commissioned by the University of New South Wales’ Australian Human Rights Institute, found Australia was the third biggest fossil fuel exporter on an energy basis in 2021, trailing only Russia and the US. See also The Conversion:* Dug up in Australia, burned around the world – exporting fossil fuels undermines climate targetsAustralia mainly exports fossil fuels to Japan, China, South Korea and India. These countries, which accounted for about 43% of fossil fuel CO₂ emissions in 2022, are also signatories to the Paris Agreement. So they have set 2030 emissions reduction targets and net-zero goals of their own. Continuing to import fossil fuels is incompatible with their own commitments.
*It is hardly a Conversation while they ban skeptical opinions, eh?
August 15th, 2024 | Tags: CO2 emissions, Emissions (CO2), Russia, USA | Category: Australia, Fossil Fuels, Global Warming | Print This Post | |
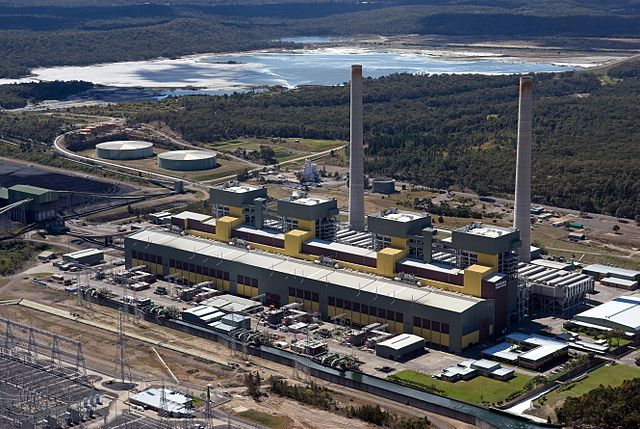
Hiding the costs of renewables until after the next electionThe largest coal plant in Australia was supposed to close in August next year, but the NSW government decided to buy a two year extension until a few months after the next state election. Now the modeling comes out showing that they decided to keep the Eraring coal plant running to prevent the shocking price spikes from disturbing the voters. Keeping the coal plant will reduce wholesale electricity bills by a few billion dollars. (Why don’t we keep it open for ten years?) Presumably his reelection chances would be worse if “saved the planet”, and shut the coal plant a few months before the election instead. They know the voters don’t want the transition. They know it will cost more. And yet they do it anyway… Bizarrely, this news comes from the renewable industry site Reneweconomy, where Giles Parkinson doesn’t seem to notice this shows coal power is cheap and renewables are hideous. Apparently he doesn’t mind inflicting costs on hapless homeowners, he is just bummed that they couldn’t force more unreliable energy and battery packs on the grid even sooner: NSW confirms Eraring closure delay driven by fear of pre-election price shocksThe NSW state Labor government has confirmed that its controversial decision to delay the closure of the country’s biggest coal fired power generator at Eraring was primarily driven by concerns over a possible jump in wholesale electricity prices. The 2.88 gigawatt (GW) Eraring facility on the central coast was due to close on August, 2025, but under an underwriting deal with the state government which could be worth up to $450 million, Origin Energy will now keep at least two units open until August, 2027, a few months after the next state election. Delaying the closure of Eraring even longer until 2028 could save $4.4 billion: Modelling that the Minns government relied upon – produced by Endgame Economics and ICA Partners – has now been released (or at least bits of it) – and confirms that the greatest benefit of the delayed closure would come from lower prices. A summary of the Endgame analysis tabled in parliament on Tuesday suggests that the savings on wholesale market prices would total $4.4 billion, with a relatively small benefit of $300 million allocated to increased energy security and $200 million for avoided system strength measures. The report says this would outweigh the $1.1 billion negative benefits from higher emissions resulting from the burning of more coal, and other costs of $600 million, including $400 million in payments to Origin. Overall, it puts the net benefits at $3.2 billion to $3.5 billion. More bizarrely, Giles Parkinson argues that the futures market is predicting even higher prices than the modelers are:  NSW Futures prices Electricity: NEM Review He views this train-wreck as a bad situation caused by Big Market Players exploiting the market, and they absolutely are. But he doesn’t admit that if we weren’t trying to ram a fake transition down everyone’s circuits with unreliable generators, the Predators wouldn’t have nice juicy price spikes to prey on (and subsidized cushions to land on). With the true genius of all communists-at-heart Giles Parkinson tells us this has nothing to do with prices: Again, this had nothing to do with the actual cost of generation or the prospect of a supply shortfall, it was simply lack of competition. But Giles has no idea what competition even is. If more coal power was competing we’d still have cheap electricity. The market he wants is not a free market, it’s just a different kind of Soviet. So warn the voters of New South Wales. The Chris Minns Labor government is trying to hide the cost of the unreliables until after the election. Eraring photo by Nick Pitsas, CSIRO August 14th, 2024 | Tags: Electricity Cost, NSW (New South Wales), Renewable Energy | Category: Global Warming, Renewable | Print This Post | |
By Jo Nova A group of arty psychologists has accidentally shown how much skeptics can achieve if they just speak up.The small, poorly worded study, done by people who have little understanding of the climate debate, or even of the scientific method, doesn’t prove much at all. But if you start with 170 people who have been fed propaganda for years and then ask some random questions, whatever you repeat seems more believable. We could have learnt so much more if these psychologists did not start so confused themselves. Their big “discovery” was that hearing something skeptical a second time gave it a significant boost in believability, even when the audience were 90% believers. Their big conclusion was the advice to essentially never utter a skeptical word, just repeat the propaganda: “Do not repeat false information. Instead, repeat what is true and enhance its familiarity.” They appear to be oblivious that their advice essentially kills the idea of open public debate. They don’t mention public debate or free speech. Possibly, since they are at an Australian university, they’ve never come across it. But the core message comes through at The Guardian — they are scared skeptics might be heard: Repeating climate denial claims makes them seem more credible, Australian-led study findsOur new research has produced worrying findings. Climate misinformation may be more effective than we’d like to think because of a phenomenon called the illusory truth effect In short, we are more likely to believe a lie if we encounter it repeatedly. Worse, the effect works immediately – a lie seems to be more true even after just one repetition. Repetition, boys and girls, is “insidious”:
But it is only “insidious” when skeptics repeat things, not when the State says the same thing a thousand times, and starts the repetition at kindergarten. These researchers live in an academic fishbowl. The survey was a swamp of irrelevant questions on boring things skeptics hardly ever say like “Global warming will not increase skin cancer”. But one question they designated as misinformation may have gone off like a bomb in the survey: “Emails seized from prominent climate scientists suggest conspiracy and data manipulation.” Clearly these researchers have never read the ClimateGate emails where esteemed professors admitted in writing that they use “Mikes Nature trick” to “hide the decline”. However, as is their way, they suggest conspiracies themselves based on nothing but their avid imagination. At the Conversion (it’s not a conversation if they ban half the country) they let their hair down — seemingly afraid skeptics might use AI bots to wipe out their “public support” (that was created through decades of mindless repetition). Repeating aids believing: climate misinformation feels more true through repetition – even if you back climate scienceAs our social media feeds fill up with AI-driven bots, sheer repetition of lies may erode the most essential resource for action on climate change – public support. Traditional media has a different problem – in their commitment to presenting both sides, journalists often platform climate sceptics whose untrue claims add to the repetition of misinformation. Somehow they lie to themselves that “journalists” are committed to presenting both sides and often platform climate skeptics. Where have they been for the last 10 years — not apparently doing any background research for their paper. If they spent half an hour reading skeptical blogs they’d know that belief in climate change levitates on billion dollar propaganda campaigns, a million lines of “carbon is pollution” and mass censorship. The academic world has trained a generation to hate the sixth element of the periodic table, and these psychologists would probably think that’s a good communication strategy. Their Holy Arc is “the consensus” — that quintessentially unscientific philosophy of polling the scientists you haven’t sacked yet
What can we do to protect ourselves, they ask, and the answer is to chant the permitted litany. In an immature science it’s absurd that 999 climate scientists out of 1,000 say the exact same thing, but this is their garlic to ward off the vampires: Researchers have found one reliable solution – come back to the scientific consensus. For decades, scientists have researched the question of whether our activities are the main cause of rising global temperatures. Many different lines of evidence from rates of ice melt to sea temperatures to satellite measurements have now answered this conclusively. The scientific consensus is now 99.9% certain, a figure which has only grown over time. Drawing on this consensus may work to protect us from accepting sceptic arguments by reminding us of the very large areas of agreement. They write as though they are children afraid of catching of catching typhoid: “Drawing on the consensus may work to protect us from accepting skeptic arguments”. Lord help us all, in case we find a skeptic persuasive! It’s so pathetically intellectually feeble. And indeed, their conspiratorial minds are unleashed, they see “actors” with “an agenda” and never for a moment guess that they are the actors and their agenda is to protect the establishment that pays them: There’s a systemic problem here. Never before in history have we been able to access so much information. But our information environments are not benign. Actors with an agenda are at work in many areas of public life, trying to shape what we do or do not do. We need to learn more about how we can battle the power of lies on repeat. These poor psychologists are so badly trained in the philosophy and methods of science, they have no idea that open public debate is an essential part of science. If the man-made catastrophe was overwhelmingly true, it would survive public open debate. There wouldn’t be a gap where 50% of the population disagree with 99.9% of the experts. Nor would the experts struggle to convince half the meteorologists and two thirds of engineers and geologists. They only need to worry about maintaining belief in climate change because it is a manufactured falsity which billions of dollars depends on. As I’ve said for years: there’s a reason we don’t ask scientists if they believe in gravity.
REFERENCEJiang Y, Schwarz N, Reynolds KJ, Newman EJ (2024) Repetition increases belief in climate-skeptical claims, even for climate science endorsers. PLoS ONE 19(8): e0307294. https://doi.org/10.1371/journal.pone.0307294 Experiment 1: N = 47 (Judging by the dated questions this was done about ten years ago). Experiment 2: N= 120 participants (including 5 uncategorized). 36 participants were Alarmed (31%), 35 Concerned (29.2%), 27 Cautious (22.5%), 0 Disengaged (0%), 8 Dismissive (7%), and 14 Doubtful (11.7%). Photo: Cory Doctorow
August 13th, 2024 | Tags: Censored Science, Conversation (The), Free Speech, Psychology, The Conversation | Category: Australia, Free Speech, Global Warming | Print This Post | | |
Jo appreciates your support to help her keep doing what she does. This blog is funded by donations. Thanks!
   |
|||
|
Copyright © 2024 JoNova - All Rights Reserved |
||||


Recent Comments