Electronic sensors can pick up phantom electrical noise
In the last thirty years the Bureau has installed electronic thermometers all over the country. But unlike the old glass ones, the new sensitive equipment can not only pick up freak gusts of hot air, they can also pick up electrical interference. Theoretically, electronic thermometers could report phantom measurements induced by large electric fields, like perhaps by an airport radar as it sweeps through the electronics.
Indeed as Lance Pidgeon points out, the cable that runs from the platinum resistance probe runs out of the Stevenson screen, down the pole, under the ground and pops up at the electronic data-logger some 6 to 10 meters away. This makes for a nice long aerial ready to pick up “noise” and feed it into the data-logger. Those airport radars produce huge electric fields — all it takes is slight induction of a voltage difference across the 10m cable and voila… the data logger records a “warmer” second.
Here’s the small forgotten airport radar at Heathrow standing about 12 stories high. Imagine the power that puts out?

Electromagnetic interference could also be triggered by mobile phones or radio waves, lightning, two-way radio or television broadcasting as well. Theoretically, at least, it’s possible that any “hottest ever temperature recorded” in newspaper headlines could have been generated the moment the pilot messaged the control tower. Or it could be a maintenance truck driving past, someone in the car park starting their engine or anything electronic really. This was never an issue with a glass thermometer.
As Jennifer Marohasy explains, electronic engineers appreciate this point immediately:
As an analogue engineer recently explained to me, because of all the radio interference at airports, it is not really a place to be recording temperatures with resistance probes. Yet this is exactly where most of these temperature recording devices are now located – and not just in Australia, but across the world. So, the average global mean temperature may not only include the blast from a jet plane landing at Cordoba, Spain, but also the chatter from pilots and the control tower because temperature is now primarily measured as changes in electrical current and at airports.
Is this a problem? Who knows — The BOM is hiding the data that matters
The Bureau of Meteorology say that the new electronic gizmo’s are set up to mimic the old glass thermometers. They carefully calibrate and compare the two types of thermometers in the same box at the same time and in many sites. They have that data. If the electronic systems were working similarly to the old glass ones, and were protected or filtered from the noise, years of side-by-side measurements would show a close correlation and minimal disparities. Too easy, right? But for some reason, the BoM have to hide the parallel data and fight tooth and nail to keep it hidden from the prying eyes of skeptics — temperature data is “a national secret” or something.
Perhaps they’re just trying to save Australians from getting depressed and angry. If hypothetically, airport radars and tarmac caused phantom “global warming” all those trillion dollars worth of solar panels and wind farms would be a total waste of money. To solve global warming we’d just need to go back to glass thermometers.
Sighting the odd phantom hot-second…
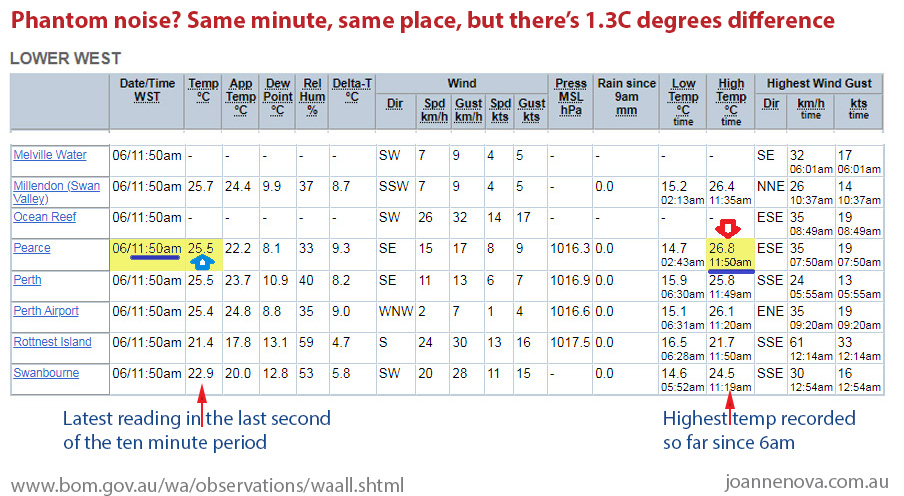
We know there are glitches in the system, even if we don’t know exactly what causes them. On the BOM live reporting pages there are often differences within the same minute that are hard to explain. In this one below from Pearce Air base at 11:50am on the 6th of March there was a 1.3C difference between the highest reading of the minute and the last reading of the minute. Sometime in that sixty seconds either the air temperature changed radically, or there was noise in the system.
Click to enlarge
These kinds of anomalies only show up briefly on the BoM observation pages. (Eg NSW, VIC, QLD, SA, ACT, NT, Tas, WA.) Someone has to be watching to notice when the highest temperature of the day occurs at the same minute as the current observation. The ten-minute data comes from the last reading of the minute, but the highest or lowest temp recorded can cherry pick any second — effectively fishing for the extremes. And it doesn’t average out. See below — for lots of reasons there are more extremes in hot afternoons than there in the cold hour at dawn.
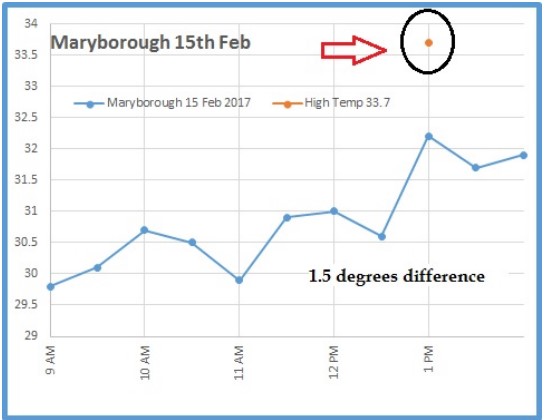
Strange noise pops up in other observations. Here below are the measurements every half hour at Maryborough one day in summer. Ken Stewart had noticed that the BOM have different “live” reporting systems and they often conflicted. The 30-minute observations reported 32.2C at exactly 1pm, but the “Latest Observations at Maryborough” reported 33.7C at exactly the same time. That’s a 1.5C temperature difference, and in the same minute?
From the post: One second records in Australia — how “noise” creates history and a warming trend.
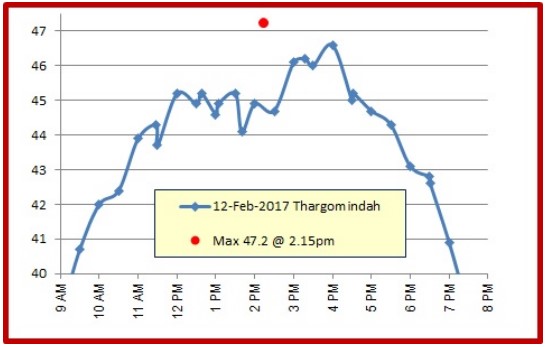
Here’s a similar thing at Thargomindah.
The hottest time of day is the noisiest too
Lance Pidgeon also points out that thermal noise, just from the heat in the probe — is a problem in electric probe thermometers — it’s called Johnson noise, and would be worst at the hottest time of day.
The BOM would argue the thermal heating noise is a well known phenomenon, but as Lance points out a single electronic gizmo thermometer can’t be perfectly tuned to both maximum and minimum thermometers at the same time. Maximum thermometers were traditionally mercury thermometers, but minimum ones were more likely to be alcohol thermometers and they have slightly different profiles.
It’s also true to say that hot blobs of air float around at 1pm, rising off tarmac, but not to many cold blobs levitate 5 feet off the ground at 6am, or any time. It isn’t symmetrical. There is a lot more turbulence, volatility, and also plane traffic and radio chatter at 2pm in the afternoon affecting the maximum temperatures. And as long as the maximums are being warmed, the headlines of deadly heatwaves will keep writing themselves, and the average temperature of the day will still keep rising too.
For the technically inclined
The BOM claim to have worked on the platinum resistance probes to make them mimic glass thermometers, but problems are more likely to be in the long cables and other electronic gear like the data-logger.
Lance Pidgeon: Breaking the automated measurement system into the two parts that are several meters of cable apart, i blame the data logger for most of the problem. Not the simple resistance probe even with its dubious time constant. Specifically i blame the lack of averaging. The small signals are vulnerable to the many forms of higher frequency electrical noise generated both within and external to the system. The missing averaging could cancel most of this out by lowering the frequency response to near that of a glass thermometer. Thus rejecting most of the electrical noise but allowing the desired signal.
If the BOM had sorted all this out, why are they hiding the parallel data?
Electromagnetic interference is a well known problem, at least among electronic engineers, if not meteorologists. The WMO – World Meteorological Organisation warns of electromagnetic interference and talks about testing for such. (vol 5, Section 4.2.3)
In 2018 edition – Volume V: Quality Assurance and Management of Observing Systems part 2 CHAPTER 2. SAMPLING METEOROLOGICAL VARIABLES at 2.1 This pearl of wisdom.
In general, sensors respond more slowly than the atmosphere changes, and they add noise. Sensors also do other, usually undesirable, things such as drift in calibration, respond non-linearly, interfere with the quantity that they are measuring, fail more often than intended, and so on, but this discussion will only be concerned with response and the addition of noise.
The bottom line is that it’s a real threat, but a very solvable problem. The question is whether the BOM have solved it. And the only test that matters is not a certificate from an inspector but the real life data, en masse, and in toto.
The BOM need to publish all the parallel temperature data so Australians know that the equipment is not just “world class” (which is appalling low) but comparable to the old glass thermometers. Conflicting temperatures that change by a degree within one minute tell us something is wrong. The BOM cover up tells us that too.
More information
See all observations for NSW, VIC, QLD, SA, ACT, NT, Tas, WA.
KensKingdom: How temperature is measured in Australia Part I/
The WMO (World Meteorological Organisation) 2018 edition – Volume V: Quality Assurance and Management of Observing Systems
Information on Primary and Secondary Airport Radar
Why is temperature data a national secret? BOM still hiding data


I agree to all that you have written, but the cables will be shielded surely?
90
Yes and shielding helps a lot. Make the system almost fully functional. It reduces the problem down to the point where you would barely notice it if you did enough filtering and averaging.
110
Forgot to say Yes they do use shielding.
90
Thanks to everyone here for their input in comments. It’s been very rewarding to see so many people familiar with the field drilling into the details. Just loving this high level thread.
100
Yes they have likely shielded the sensor cables but the sensor itself will be unshielded. Electromagnetic radiation has a number of entry paths directly into the electronic enclosure where it can reek havoc. As well as the sensor, shielded or not, you also have the power and data cables along with the enclosure itself. The logger will be susceptible to both direct electromagnetic radiation along with conducted interference in both differential and common mode. These days equipment is tested in a laboratory to a given standard such as C Tick, CE or any number of military and automotive ones. The BOM should make public the standard(s) used and level achieved. Even better publish the EMI test results as that way we know what level of error they consider acceptable for a given level of EMI. In my view such mission critical equipment should be to the highest military (helicopter) standard.
Many moons ago one of our product pre tests was to drive it around Melboune Airport. If it passed that then it would pass official lower level laboratory or open field testing.
On another note many years ago I was in an RF laboratory and noticed ai desktop breathalyser being tested so I enquired how it was going. Badly would be an understatement. Don’t have a phone or hand held two way radio within 20m of this unit and whatever you do don’t have a breath test near an airport. Things may have been improved since then but being the government I doubt it.
230
I wonder how many people have been falsely prosecuted for DUI because of this?
231
You were downvoted by Vic Pol. 😆
170
Probably someone who knowingly lied in court that the instruments were accurate and infallible.
100
As far as I know, the roadside test is really only a screening test.
If you read over the limit on it, you are taken back to the bus or station for the more accurate test.
At an annual event I attend where too much alcohol may or may not be consumed and bigger and bigger lies exchanged as the night progresses, the local police used to offer breath tests to people before they left the site*. Even after what I thought was a big night, mine didn’t even register 🙁
[*] It was a great community service approach, which should be more widely adopted.
80
I was talking about the desktop evidence units used in the buses and stations.
20
I thought they still used wet chemistry. I must be way, way, way out of date.
And quite happy if I never have first-hand experience 🙂
40
The critical thing about instrument cables is that they are fully screened and that the screening is grounded at just one end, which has a very good connection to ground earth. Any industrial installation knows that, otherwise you get phantom noise and spikes. Even though we have followed those practices at work, we still get problems. What we do is for protection, it has to be up for 5 seconds before activation. This is needed to eliminate false positives.
It is almost certain the installed thermocouples do not have proper screening, and they don’t have spike elimination built into their software. The designers would never be employed by industry.
320
“Even though we have followed those practices at work, we still get problems.”
Yep there are so many traps and ways it can get it in.
They use platinum resistance thermometers not thermocouples but the problems are similar. So can also take advantage of a four wire system to isolate the power supply.
150
Thanks for the correction that they are platinum resistance rather than thermocouples. We have those in places and they have similar issues. So do 4-20mA transmitters which have a continual current going through the wires.
Transient voltages are very hard to eliminate even when everything is earthed and you have a power station earth mat
80
No worries. It seems to be the people who have been there and done that like yourself that are agreeing it could be a real problem. A remaining problem with the four wire system is that while it removes errors from cable resistance that would have been caused by the supply current traveling through the same wires it cannot remove the Johnson Nyquist (thermal resistance) noise from the cable resistance. So the return Voltage path cable resistance still contributes noise that is generated by the cable itself. This noise exists even when the equipment is switched off. It is not from external interference but directly caused by heat exciting movement of electrons in the cable.
This noise needs to be calculated as a series resistance added to the resistance of the platinum resistance probe. Imagine the cable resistance per wire is 5 Ohms and the thermometer resistance is 110 then the total is 120. To make it harder the cable will not be at the same temperature as the probe so that 120 is the wrong way to go about it. The noise Voltages need to be calculated Separately then added. Cable capacitance adds a further complication.
60
10meters of #18 wire is around 0.2ohms
20
Agreed. One of the major sources of electronic noise is the creation of ground loops. These can be near impossible to eliminate. ideally shielding is connected at only one end but even then you have even in the size of a house a big difference in earth voltage across the property and a loop through the ground. Any two ways to get to the same point and you have a wire. Any two wires and you have a loop. Induction can then convert electromagnetic radiation into an electrical signal. It can be infuriating to eliminate and in some cases impossible.
However given that temperature does not vary quickly or should not, averaging and calibration should fix the problem, especially if the average is over say 5 minutes as expected for such a measurement as temperature.
81
The other solutions include fibre optic cabling. And even photo-optic connections to isolate say detector units from the local environment and Faraday cages so that all electronics is floating inside a shield. This is a bit like a Stevenson box but metal, not wood. Even earthed steel mesh would be great inside the Stevenson box. The last thing you want is a detector on a wire. You may as well call it an aerial.
71
Great comments Tdef. I can see you have some real world experience. Trouble with putting any electronics inside a screen is then that the electronics produces heat. The box also disturbs airflow. Not saying no or impossible just warning that nothing easily beats a resistance probe done well. Even though they too self heat. They could have a current of 2mA and at 100 Ohm (zero degree C) that is only 400 micro watts but it is right at the sensor. Current squared * Resistance of probe. At the higher end it is about 120 Ohm or half a milliwatt.
What heating power will your equipment bring?
30
Why not use a thermocouple inside a probe (metal, ceramic or even glass) as used in industrial applications for process control. The thermocouple does not heat. Voltage is the measured quantity. The thickness and thermal conductivity give some averaging over a couple of minutes which is necessary for control to prevent hunting.
30
“Why not use a thermocouple inside a probe (metal, ceramic or even glass) as used in industrial applications for process control. ”
Because a good resistance thermometer is ten times more accurate.
31
Where did you get that 10 times more accurate from?
10
Specifications from manufacturers and outlets and the history of how the international ITS90 temperature scale was defined. Although having welded up quite a few Platinum/platinum Rhodium thermocouples myself using an oxy/hydrogen hydrolysis torch for an old employer, some of it comes from memory.
Take a look at the various thermocouple types accuracy’s in this and then scroll down to the RTD page and look at Class A RTD from 0 to 100 Degrees C.
https://docs.rs-online.com/0a1c/A700000007236563.pdf
A bit of interesting history at this link below where this quote comes from.
https://technology.matthey.com/article/24/3/104-112/
11
Re the accuracy see also;
.
https://publications.csiro.au/rpr/download?pid=procite:906019b1-66b6-48ec-9251-00b4d195b5b5&dsid=DS1
10
Yep and why not put the thermocouple or Platinum sensor in mercury inside glass to fully emulate a standard mercury in glass thermometer including its thermal mass and conductivity to the ambient.
20
Because the bit that matters on a glass thermometer is the bulb and its dimensions. All that stuff won’t fit.
10
Averaging rarely if ever fixes issues due to EMI.
20
“Averaging rarely if ever fixes issues due to EMI.”
True but it does massively reduce the effect on readings. Best to avoid the problems and do the averaging or perhaps KP’s Median thing.
21
Ground loops while a real issue in many applications should not be an issue when it comes to the measuring of temperature in a screen.
10
Why not? It all gets wet and is on a steel pole just a tad below the wooden box. A wet metal probe body that is connected to the shield that is earthed at the other end only needs a little conduction to ground on the surface it is mounted on to be the loop. How well does the shield shield if it is the ground loop? Failing a direct conduction path to ground there will always be a capacitive coupling.
https://www.antarctica.gov.au/news/stations/davis/2021/this-week-at-davis-29-october-2021/
21
Don’t forget idling jet exhaust too.
130
Yes many things at airports to heat it up but generally speaking electro-magnetic radiation does not cause anything to warm much in the thermometer it instead causes Stray Voltages and currents that get measured as if they came from the resistance thermometer probe. Using a semiconductor sensor instead can remove some of the cable vulnerabiltity but adds even more noise sources to the list.
Check out all the ways noise that did not come from the thermometer can affect things in the process sequence after the thermometer temperature and it’s response times cease to be the main consideration.
https://www.analog.com/en/technical-articles/managing-noise-in-the-signal-chain-part-1-annoying-semiconductor-noise-preventable-or-inescapable.html
170
Chris Morris:
Thank you for the explanation.
What I don’t understand is why the installed thermocouples do not have proper screening and do not have spike elimination built into the software, How do we know this without examining them in the field?
110
The resistance probes(not thermocouples) do have screening and spike elimination but also need rapid sampling to be averaged. Those things all need to happen but are not enough.
The BoM say the spike elimination is to mark a reading unavailable if it was more than 0.4 degrees different to the reading taken one second earlier.
120
Resistance probes are heated by the electronics as current must be passed through them. They either have a permanent current running through them or there is only current during the measurement. If the latter then the amount of heating is sample rate dependant. You can have very low current to minimise heating but at the expense of being more susceptible to EMI and all forms of thermal noise. So another question is how much heat is being generated in the sensor. Is it significant and if so how is it being handled.
60
Red re:”another question is how much heat is being generated in the sensor”
In this FOI publication many different numbers came back when this question was asked.
http://www.bom.gov.au/foi/release/FOI30-6150_DocumentSet_ForRelease_Redacted_r_Part1.pdf
What is the sensor current?
quote from redacted @measurement.govt.nz .
“Thirdly, 5 mA is a very high sensing current. If I remember correctly, Bruce Hartley mentioned that in the Mk1 cards the current is actually 2.2 mA, use this value in the sentence.”
This FOIed quote from various people to various people. In the same FOI publication linked to above.
“What is the sensing current for the PRTs, and are they calibrated/checked in oil or water baths – self heating may be different in use and calibration?”
“Answer: approximately 260 uA (~0.01 mW)”
“Sensor current applied by the AWS interfaces (determined from AWS circuit schematics)…”
“Almos 2200 uA (~0.5 mW)
Telmet 600 uA (~0.04 mW)”
“Comment – the sensor calibration current is significantly different (and less than) the AWS operating currents (particularly the Almos). This raises a concern for the potential of sensor self heating during operation on the AWS, particularly as the AWS sensors are in air and not in a stirred oil bath as is done in the calibration process”
Ooops
Then finally printed in the 2017 BoM review of Automatic weather stations after all this deliberation.
“The resistance is sampled at least once a second, and a temperature (sample) value calculated. The four-wire measuring technique is used to measure the resistance,and the maximum excitation current is limited to 0.2 mA so that the sensor heating is within acceptable limits. Will the real PT100 current value please stand up
40
Thanks for the link I will follow it up.
20
More info here.
http://www.warwickhughes.com/blog/?p=7084
10
Re “They either have a permanent current running through them or there is only current during the measurement.”
A very very good question Red. I suspect the answer is permanent. Because…
One value is written to short term memory each second but the Voltage returned from the resistance of the PT100 probe is initially spot sampled not once per second but up to 5 or six times per second. This revelation comes from an FOI release where the BoM found someone who knew a bit about these things to explain it to them. Part 4.2 of page 90 of this PDF or page 1 of the 15 page document within it near the end. The effective short term data writing rate is one Hertz, the inverse of a second. The sampling rate is five or six times faster than the writing rate.
40
It is great to see this information posted. Thanks Jo and Lance. :-).
But in many ways it begs more questions than it answers.
We need, at the very least, the full 15 years of parallel data to be made public for Brisbane Airport. John Abbot has put in another FOI request, but the BoM won’t acknowledge it.
And I would like to see some second by second data. At the moment the Bureau record every second, and then throw away everything except the last second in each minute and also the highest and lowest second in each minute.
310
Memory is cheap now. Why can’t they keep and make every reading and it’s Q.A status available? If a reading needed to be ignored because it was obviously a noise spike then why not list it as a fail and not count it. It does not need to be deleted to be ignored.
240
Reaction times in large organisations are quite slow, especially when they are attempting to retain long-term compatibility.
Unfortunately, the BoM’s IT focus doesn’t appear to be on data collection or retention.
From a computer nerd perspective, it would have been much better to collect and retain fast-response 1-second readings and emulate LiG responses in software than to attempt to physically replicate the thermal response.
The CPU, storage and bandwidth we take for granted now were still in the R&D labs when the BoM was planning to cwitch to electronic remote data collection.
70
And what?
If radar was an effect, you would see a rhythmic pulse every time the radar swept over the weather unit.
If there is that much variation in the temp over a minute, what temp should be recorded?
421
If they refuse to make their full data sets and methodology available, we would never know. The scientific method does not allow for secrecy. As Jo said:
200
PF I think the most common temperature in that minute, rather than the average would be better. Unless you discard the figures that look like spikes and average the others, then taking the median gives a better value for that 60seconds.
Not only would you get a repeated effect from the radar emitter, you would get variable false noise from any radar returns as a metal vehicle passed by. I wonder if electric vehicles are more noisy than a set of spark plugs?
Really, in the modern world you can’t trust anything electronic. Why couldn’t they have a glass thermometer and an optical reader filming it, you get 60 images sent back to the control room and a program can do the averaging there.
160
KP that most common/median idea is worth thinking about. If as Jennifer said we had all of the 60 readings and the parallel data it would be easy to see what, if anything, actually works.
110
All sorts of analysis would be possible if the Ayers and Warne 1-second data was available.
I believe Jennifer has the same data set used in the earlier Ayers paper, but that is only min/max/last reading for each minute.
It would certainly be instructive to be able to compare the mean, mode(s) and median for each period, and find the range and variance/SD.
40
If you go through the pain of reading those papers they did not actually use the full 60 readings per minute. Even they could not get that data. So for some of their calculations they used “simulated” data and for others a few min max and last readings. All to prove something irrelevant. The last second data they defend is not what is actually used. Not just that but it was all to claim adherence of that irrelevancy to a WMO guideline that was already out of date by the time the papers were published.
30
Other than that, how did you enjoy the play, Mrs Lincoln?
I haven’t read the Ayers paper, but did wade through the Ayers and Werne a few days ago. I’ll re-read tonight or tomorrow to refresh my memory, but I think they did have the 1-second data for 27 days at Darwin and 10 days at the Bight site. They didn’t seem to use the full set though, just a couple of hours each day they thought would have the most variability.
The simulated data provided a probability distribution for various e-folding times (I gather that’s the thermal time sensitivity), then compared the 60-second figures to the simulated.
One thing which stood out was the 0.4 degree C range, and how many of the readings were in those tails.
20
KP, your solution to the obvious is amazingly simple. I love it.
It would ensure the continuity of temperature readings with the same glass thermometers of old and enable realtime, accurate readings.
Any doubt, (which most of us have) in the temperatures from BOM would be allayed.
The only other problem which still needs to be addressed is the location of the temperature probes. Airports and similar are not the ideal locations to measure temperature.
70
KP
Not only would you get a repeated effect from the radar emitter,
See my reply to Peter at 7.4 as to why this is not the case.
40
KP, with an airport radar rotating once every 5 seconds, every second the beam will sweep 72 degrees. The pulse repetition rate is typically 1000/sec. The beam width perhaps 1 degree.
It doesn’t require much calculation to find that the chances of interference coinciding with a read of the sensor is slim.
It is quite easy to see that interference would be chaotic and appear semi random.
These systems need a full suite of tests…
40
“what temp should be recorded?”
BoM would, by agenda, choose the very highest reading they could find.
In real science you would remove outliars then average over say 5 minutes
But that would give a real indication of the temperature… the very last thing that BoM wants.
200
Conservatives and fellow rational thinkers need to understand that The Bureau (how Orwellian) is a political organisation disguised as a once-reputable scientific organisation (just as was CSIRO), whose primary purpose is to maintain and promote the Official Narrative of supposed catastrophic anthropogenic global warming. True science has nothing to do with it.
160
Very appropriate typo, b.nice – ‘ In real science you would remove outliars….’
100
Peter It seems you have little understanding of how EMI propagates from various sources and how susceptible the electronics is to it. It is likely the RF is entering the enclosure either directly or indirectly via its cables. As it turns out an Analog to Digital converter is only susceptible to EMI during part or all of the conversion process which is typically in the range of a microsecond.
So we have a radar coming around every second or so and emitting a very short pulse again in the microsecond. So you expect the window of A/D converter susceptibility to line up radar output every second. Sorry to disappoint you but you would be lucky if they lined up once a day. This is a complex Black Art problem.
70
Black art it is and true that a sample may only take a microsecond or less to be processed. This leaves a 999 micro second safe period. But there are signal conditioning, linearisation compensation and self heating compensation circuits with active components in the system prior to and including the ADC. These can get thrown into a nonlinear region of semiconductor curve and then demodulate, down convert, ring, distort, latch or just go noisy for a while until the biasing settles after being hit by a powerful unwanted signal. All bad for longer than that one rapid conversion. So the chances of synchronisation are a bit higher. How much higher? Back to the black art theory.
50
Ooops missed the edit window. 999,999 microsecond window.
but this is my chance to add that even if it took a month to happen, what about the chance that it damages the ADC or any of the other stuff and leaves a lingering but hard to detect problem.
20
Plenty of chance to degrade the performance. Even just handling the equipment as static discharge is a major cause of spark now fail for no obvious reason latter. By failure I mean no longer meets its specifications.
40
Yep it is a matter of how long any disturbance takes to subside to below normal noise levels but it would take volumes to go over this and my point was simply that you would not expect to see “a rhythmic pulse every time the radar passes over the weather station” as falsely claimed by PF. The radar pulses at a higher rate than it rotates at and then you also have side lobes from the antenna. Bottom line is that working out the disturbance likelihood requires detailed knowledge of the systems. In my experience the recovery time of a logger of this nature from a signal not big enough to cause any latch up should be well under 1msec. So the $1million/day question that the BOM needs to answer is what’s the likelihood and extent of the radar interfering with the reading.
40
I don’t want to name the guy without his consent but i he told me he was fault finding a data logger for a HVAC system or similar at a capital city airport and that his colleague watched the reading while he called,”now”. He was watching the radar dish. The problem did synchronise every lap. I have no idea what the exact system or problem was. Might be able to get him to tell me more.
40
Depends on the ADC type Red. There are methods of ADC that effectively cancel out noise effects.
21
Graeme#4. Could you please point me to an A/D that operates within specification when frequencies well outside its bandwidth are present at its inputs including reference and power supply. You are making the mistake of assuming that the converter only needs to deal with frequencies that it can handle. FYI typically an A/D is very susceptible to frequencies that are multiples of its clock frequency.
10
This is on top of the well-known heat island effect that elevates temperatures in all places where there is a lot of heat-absorbing infrastructure.
Chicago Orchard Fields airport is so-named because it was built in an orchard, miles out of town and now it is absorbed in the metropolis. Interestingly the night-time temperatures have hardly changed but the daytime (and hence the average) temperatures are much higher. There is a chapter on the heat island effect in one of the IPA Climate Change: The Facts collections.
261
Well, this looks like one of those problems they looked into, and started to fix- until they noticed it only erred in one direction! Then it became a feature.
180
Indeed It looks like they took enough samples to play join the dots and get a good picture but then took a detour via an easily hidden error and tossed all but the extremes. The last reading of the minute that in the long run gets thrown away as well could also be a hangover from some other idea. Perhaps it was from an older 60 times slower sampling rate.
60
Note to BoM, if you refuse to reveal your old and new measurement comparison in full, your algorithms and your highly secret and mysterious “homogenisation” process in a way that other people can scrutinise and/or replicate your results, you are not engaged in science but PROPAGANDA.
There are multiple statistical methods you could have applied to the comparative data such as the Tukey range test. https://en.wikipedia.org/wiki/Tukey%27s_range_test?wprov=sfla1
But statistical methods aside, the scientific method requires you to fully disclose your data and methodology. How can you think and behave otherwise if you claim to be a scientific organisation, which obviously you are not?
280
I’m only a lay person ,but how do we know what the BOM are hiding from the public and other interested data experts and govts etc?
And what if the old paper recorded data are eventually destroyed?
I seem to remember the UK Met office telling an inquiry that some old data had disappeared because of storage problems.
DUH????
This was during the Climategate inquiries and soon after Dr Phil Jones retired and Dr Griffa was not happy about some of Mann’s input during the inquiry either.
150
Exactly. Even if you could obtain the parallel records (glass vs electronic) – do you actually trust them?
60
We need an audit, but there is no political will.
70
The only reliable global temperature is measured by satellites. But they’re usually cooler than the averaged world BOM readings.
160
UAH Australia since 1998
https://ibb.co/hLRPMRS
Where is the warming ! ?
50
Finally I have come across something more crooked in these resistive temperature probes than the country trotting meetings!
150
There must be some BoM “lurkers” out there.
Surely one amongst you must have the courage to come out and say something, even under a pseudonym?
160
Its happening, but they seem mostly concerned over pay and conditions.
‘And two former staff members told the Guardian of an exodus of communications staff in the last two years, alleging a “horrendous” culture with staff mentally “broken” and “distraught”. (SmartCompany)
102
Airports may have been once a good location for weather temperature measurements because they were large open areas, flight movements were infrequent, and there were only small aircraft with small piston engines that didn’t put out much in the way of a heat plume.
Today, huge aircraft with huge jet engines might land every minute or two creating a significant heat island effect, plus there are numerous sources of electrical interference. In addition, there are vast areas of concrete 43 to 51 centimeters (17 to 20 inches) thick with massive heat capacity.
They should no longer be considered reliable temperature recording locations, at least not any that have regular landings of jet aircraft.
Of course, each airport should have its own weather monitoring system for pilot information but that should not be for the official record.
120
Also airports must provide reasonably accurate data so pilots can land and take off more safely. Air density/temp affects things like stall speed, landing and take off speeds, and air/fuel calibrations. That’s why airports have the instrumentation. They are not nessarilly there to provide long term climate trends to a fraction of a degree.
180
“airports must provide ” Yes and they might need the fast response at risk of noise but the long term climate trends need to be compatible with the slower and older noise free equipment.
80
A large proportion of surface sites, probably up to 90%, are totally unfit for use as “climate” indicators.
Great for climate propaganda, though.
130
Thanks Dave. Then the question is: does the BOM include airport readings in its Acorn data suites? Surely it shouldn’t.
41
Graeme#4 says:
I am reliably informed that 57 ACORN sites are at airports. That is 50.9% of the ACORN sites.
A list emailed to me says:
Surrounds no %
City Park or Block 4 3.6%
Town Park 4 3.6%
Lighthouse or
seaside 13 11.6%
Open Country 29 25.9%
Airport 57 50.9%
Agricultural
Reseach Stn 5 4.5%
20
Not only that, but I roughly recall a post a few months ago, showing that there has been a huge increase in the percentage of surface sites located at airports.
80
Here is an interesting, relevant article about the Left’s war against science. Too long to post in full, from US, 2016. SEE LINK FOR REST
SEE LINK FOR REST
90
As well as different temperatures at the same time, I’ve noticed that the maximum temperature sometimes shows a minute before or after the 10 minute time. Perhaps someone reviews the data and adjusts it to remove the same time anomaly, but the reviewers sometimes miss the anomalies.
50
I think the maximum can be from any minute not just every tenth minute. What gets interesting is when as per the picture above for Pearce two very different readings during the same minute can be seen.
60
Ah induction. Induction is not blocked by shielding and not cancelled by noise reduction techniques. Induction does affect voltage. Induction is meaured in henries and is not exactly the same thing as resistance/impedance which is measured in ohms.
70
It is not blocked by shielding but is canceled somewhat by conductors having an equal and opposite effect to each other. Apart from the shield there are there are four wires. Two to bring an isolated constant supply current and two to return the Voltage that develops across the resistance. So you would hope that they are kept in balance and that they have appropriate twists to assist that for higher frequencies.
61
Twisting wires very tightly together is very effective against induction (magnetic field) differential mode interference. The sensor cables used should hopefully be twisted and shielded. Common mode coupling is much harder to protect against. There is no such thing as elimination just reducing to an acceptable level.
50
No, common mode rejection is easy to implement, especially with op amps. Some research on how op amps work might be useful.
31
Graeme#4. You have assumed the offending frequencies are within the op-amps bandwidth. Once the frequency exceeds the op-amps bandwidth you get all sorts of side effects from the op-amp. So please show me where GHz op-amps are used in data loggers suited to slow changing temperatures.
30
They should be using 3 core shielded and balanced cable.
41
Make that four core shielded. The four wire method is better.
https://www.variohm.com/news-media/technical-blog-archive/rtds-2-wire-3-wire-and-4-wire-what-s-the-difference-#
30
That link is all about resistance… Which is not what interference rejection in “balanced” cables are all about.
30
For AC currents in three wires to be in balance you need a three phase signal. The four wire system maintains balance perfectly not just for DC because two of the wires introduce an isolated balanced current DC source through the resistance. Then the Voltages both AC and DC across the resistance retain balance on the other two conductors as it travels back to the balanced inputs of the data logger. A three wire system is unbalanced to EMR by the power supply being directly connected to only one side.
20
Balanced audio cables work by inverting the signal in one of two sends (pins 2,3) so they are 180º out of phase.
At the receiver end they are then put back in phase, so anything noise picked up by the cable cancels out.
20
“Balanced audio cables work by inverting the signal in one of two sends (pins 2,3) so they are 180º out of phase.”
Yes that is also true for all types of balance cables. Like the old flat ladder cable that preceded TV coax. The four wire resistance probe connection achieves exactly that same situation. If the Voltage across the resistance increases then the Voltage relative to ground goes down on one of the two sense wires and up on the other. A four wire system works exactly the same as a balanced audio line. But a three wire system does not. One side of it has a greater capacitave coupling to the shield due to there being two wires on one side and one on the other. Remember that the shield is a fourth conductor in a three wire system but is a fifth in a four wire system.
From here
https://instrumentationtools.com/4-wire-rtd-accuracy-is-better-than-2-and-3-wire-rtd/
10
ooops i have cause confusion with some poor and technically incorrect wording here.
“A three wire system is unbalanced to EMR by the power supply being directly connected to only one side.”
I should have written;A three wire system is unbalanced to EMR by the power supply being independently connected to only one side.
10
4 core is a must if you are going the measure a resistance accurately even before taking into consideration shielding and twisting to reduce EMI.
30
About the size of the antenna in the photo for anybody interested. Longer wave lengths require larger antennas. The antenna size needed can get really big with longer wave lengths. How tightly focussed and concentrated the radar beam is, is a function of the wave length divided by the effective antenna size. This is far more important than transmitter power output. The Germans discovered during WWII that a wave length of about 27 cm works best for the detection and tracking of aircraft, especially aircraft with out props or rotors.
50
True Dave. The gain from being directional multiplies the power by many times in that direction by not sending it in other directions. As you say the higher the frequency (shorter wavelength) compared to the dish diameter the higher that gain. So it could well be a problem seen in the data in synchronisation to the beam sweeping past.
The equipment close to it but under the beam might be less at risk than stuff further away but in front of the beam.
40
RADAR, as we know it, especially marine, is mostly 3 cm wavelength. Specialised high power search RADAR can be 10 cm and military airborne stuff I assume is shorter. For 3 cm a panel, beaten parabolic, 6 in dia. would be an effective antenna if you are mucking around, beyond this size is 100% for gain.
At very short wavelengths, a phased array antenna to fit in the nose of a fighter can have a dozen or so antennae. I have no idea if they are half wave dipoles.
30
Must have a look at the nose of the F18 down the road. Or ask one of the gents currently re-installing the engines to see if they know. We also have a Tornado that might be worth checking.
20
The radar antenna size has nothing to do with wavelength and all to do with focusing the radar beam.
43
Plug a few different frequencies into here and change your theory.
https://www.everythingrf.com/rf-calculators/parabolic-reflector-antenna-gain
or here.
https://www.rfwireless-world.com/calculators/parabolic-dish-antenna-calculator.html
30
At microwaves? The antenna aperture is often just a waveguide. Yes, I do know how to calculate 1/f as I have designed many antennas. Think you are missing my point here.
30
Missing the point is so ironic. More wavelengths across the dish means a narrower beam width. So shorter wavelength (higher frequency) means a pointier beam. This is why Dave typed
20
According to your tables a 10 inch dish has a gain of 26dB for 3 cm RADAR. Even with 10 cm the gain is still 15dB. A 3m antenna for that would give 37dB in the azimuth. When searching the sea surface it is bearing not altitude that matters. 🙂
It is complete BS to start dialling in radio freqs.
22
Why did you dial in radio frequencies instead of microwave frequencies?
20
The RADAR dish on a Neptune P2V7 was ten ft. across. They wanted to find submarines at long range so both power [3MW PP? We measured magnetron current not power] AND antenna gain was paramount.
This is ’73’ of RAAF 10 Sqn. You can see the big radome. I would have spent many hours climbing around this bird.
https://www.pinterest.com.au/pin/another-photo-of-lockheed-neptune-p2v7-a89273-this-time-at-the-australian-bicentennial-airshow-at-raaf-richmond-in-19–106397609925777938/
That pic was in ’88 so Peter Rundle would have owned it and that radome would have been empty.
30
That would be a big magnetron.
The APS-20 RADAR on the DEW line during the cold war is 10 cm and the magnetron anode is physically large, it must be to have a number of tuned cavities drilled in it.
Ordinary ship RADAR is 3 cm.
BTW it was the Poms who invented the magnetron and gave it to the Yanks during the war.
40
Have one of the airport radar magnetrons on display, and yes, it is big. Also have a couple of the original WW2 magnetrons from the H2S system. Have played around with a SO13 PT boat radar and an AWA A272, ex WW2 corvettes, which were the source of the original magnetrons. Had a thyratron from the Neptune radar on display but the owner wanted it back – was also a very large valve.
50
I was pointing to the thyratron on the APS 20 [Neptune] when talking to my Sgt. and drew an arc through the glass. VERY high voltage there.
30
A thyratron is used mostly for anode modulation designs. This increases power output about four fold. If you really want to up the power, employ anode modulation with a spark gap modulator in place of the thyratron. However, coherence becomes impossible.
According to the known physics of radar it takes a 16 fold increase in transmitter power to double the range attainment, all other factors being the same. That’s why increasing antenna gain and improving the signal to noise ratios of the receiver are better ways to improve range.
20
Thyratron
A thyratron is a type of gas-filled tube used as a high-power electrical switch and controlled rectifier. Thyratrons can handle much greater currents than similar hard-vacuum tubes. Electron multiplication occurs when the gas becomes ionized, producing a phenomenon known as Townsend discharge.Wikipedia
It discharges high power direct to the magnetron cathode.
The artificial transmission line [pulse line] stores the HV DC power, folding [doubling] it in the process. You are in my wheel house although it was 50 yrs ago. 😀
10
The German expeirence with magnetrons is interesting. During the mid 30s they built an experiemental radar using a cavity magnetron designed by Hans Hollman, but they dumped it in favor of a push pull power amplifier using triodes. The reason for this was because the magnetron was too unstable to coherently time the pulses to the summer. They Germans were already experimenting with phase coherent radar techniques.
By 1940, the British began to research 10 cm radar because they wanted a small engough antenna to mount it on fighter planes. This lead to the Randall and Boot cavity magentron developed at Birmingham Univerisity. But the real important innovation of magnetron development was strapping. Strapping brought frequency stability and also increased the power.
The Germans recovered, intact, the H2S’ strapped magnetron from a crashed bomber at Rotterdam in early 1943. Then a few months later they recovered the 3cm radar from an American bomber at Meddo. They were already developing a 27cm version of the Wuerzburg flak directing radar for mounting aboard warships smaller than a cruiser. They built 3cm and 9cm versions of the radar and then compared them to the 27 cm version. This is how they discovered how well L band tracks aircraft.
The Japanese also developed, independently, a 10cm cavity magnetron powered radar by 1941. It used a horn at the end of the wave guide rather than a clipped parabola antenna design. But this is why the 1/2 power beam width was like 20 degrees. The Japanese did not discover strapping. They tried to control moding by other means.
30
I don’t remember the name of the magnetron, but do remember that after the Poms decided to tell the Yanks everything they knew they sent a diplomat to America with one of these in his suitcase. The Americans declared it the most valuable item of cargo ever imported into the US, I think because it made it possible to put radar in aircraft.
I remember too that they had a problem in that manufacturing them they were unable to build a precise frequency, but this was overcome easily enough because they could tune the receiver to suit.
I have always wondered if that gadget is the wave generator in our kitchen microwave cookers.
10
I just have to admire Jennifer Marohasy, David Abbott and Ken Stewart et al for their persistence, because I deal with a federal department on a regular basis. Go back 15 years and you could call up the relevant person with a query and generally get some guidance or advice relatively quickly. Now, most departments have user pay type requirements and you can’t call anyone. These days any queries are by email or proforma requests. Sometimes you might get a reply email from someone, set up a sort of relationship, only to find 1 month later the person has moved on or left the department. Hence, I can see why the need for FOI requests because any requests would just be ignored or “lost”. It was once the job of politicians to help you with your dealings with the public service, but these days that is very rare indeed. The present government (Labor/Greens) wouldn’t touch this issue with a 10 foot pole. The LNP under Abbott tried, but Greg Hunt (dutiful member of the WEF) scuttled it. You could only hope that MSM might pick this up, but the story would need to be greatly simplified and summarised for the average person to even understand it.
90
I agree, far to complicated for average Jane.
I believe the buried gem of climate knowledge is the simple fact that open ocean water CANNOT sustain a temperature above 30C.
You might respond – So what!. Well climate models all show ocean surface exceeding 30C at some point in the future – models run using 1970 to 1990 input forecast that we should have already breached the 30C limit. If they were constrained to 30C then they could not go into runaway global warming as they now do.
This simple fact has been buried. But it is easy to verify somewhere on the globe every day of the year. Go back to the May 10 when Bay of Bengal hit 31.1C:
https://earth.nullschool.net/#2023/05/10/1200Z/ocean/surface/level/overlay=sea_surface_temp/orthographic=-276.75,8.04,373/loc=88.516,15.324
Then the convective regulation kicked in so that by May 13 the surface temperature was down to 28.9C:
https://earth.nullschool.net/#2023/05/13/1200Z/ocean/surface/level/overlay=sea_surface_temp/orthographic=-276.75,8.04,373/loc=88.516,15.324
Negligible change in top of the atmosphere sunlight in 3 days but a big change in convection as those circling winds confirm.
Convective instability regulates Earth’s energy uptake. Absolutely nothing to do with delicate radiative balance. The process is purely a function of surface temperature and the mass of the atmosphere.
If you watch the Persian Gulf into August, it will reach 34C because the sustained northern winds prohibit convective instability. But open ocean surface just goes into regulating mode once the 30C limit is breached. That will be observed in the Arabian Sea in a few days because it is already above 31C.
80
RickWill – doesn’t matter if you look at the physics, biology, chemistry or modelling for AGW theory provided by the climate alarmists. There’s always the exception to the rule or a flaw in the theory that renders everything doubtful. Your 30˚C example is a perfect case in point of the flaw of SST modelling. Here’s one of the absurdities of the radiative theory of AGW. The IPCC claims that cooler bodies can reflect back heat emitted from a warmer body and make it even warmer (they call it Back Radiation). So if you sit around a campfire, the more people there, the hotter the fire will burn. I don’t think so!!! One of the basic laws of thermodynamics is that heat seeks cold not the other way around. Responsible scientists were once honest enough to reveal the flaws in their argument or the limits of their data analysis, not any more, it just appears to be a free for all. For this subject the BOM should reveal the frailties of trying to emulate old fashioned glass thermometer readings via electronic methods. #climatescam
10
Ross, the second law applies to NET systems, not every individual photon. There will always be more heat energy from the fire to the humans around it than there will be returning from humans (which are only 37C next to a fire that may be 600C or more). The heat coming off humans to a fire that hot will be so small as to be almost undetectable, but there is no breach of the second law to say some photons of IR will travel from the humans towards the hot fire. Photons can’t steer. They have no brain. They don’t know what direction they are travelling. They move randomly. The NET flow will always be largest from hotter things to cooler things, you are absolutely right about that, but there are some photons flowing both ways.
102
The problem as I see it is the same issues that we face on “climate change” . We are dealing with a system with multiple inputs into a chaotic system . If you look deep enough you would have to account for effects from chemical to sub atomic . With the change in sensors an opportunity has opened up for manual and automatic manipulation of data in the system and all the old data can be “corrected” to fit . Orwellian indeed .
70
I can recall a few occasions fault finding in electrical field cabinets to central control systems. In my day, we had portable radios strapped to out belts and it was very common to fault find across an extensive site communication with two way radio.
It was in the period of transition from pure relay control systems that were quite insensitive to radio interference to electronic control systems. It took a while for some of the more experienced electricians, familiar with relay control, to learn to get clear of the cabinets before hitting the transmit on their hand piece. Even a 5W radio transmitter inside or even close to a sensitive electronic cabinet could cause glitches.
50
When i was a naughty 17 year old punk i pulled up behind an ice cream van that was playing the typical music over it’s P.A. system. I fired up the AM CB radio that was connected to the 9 foot stainless steel whip on my roof rack and began to warn the kids of awful things in the ice cream. My signal not only getting into the ice cream Van P.A. but being nicely demodulated by by it. Quiet a bit louder than the music. Needed to drive off before they figured out what happened.
60
So let’s fund temp stations identical to those used by BOM, and install them at problematic locations, close to the BOM ones.
Sit back and wait, then ask BOM to explain their higher readings.
40
What should have happened at the very start of this nonsense is a set of reference stations like the USA has.
Reasonably equally spaced, put in locations that could not be interfered by urban development and aircraft heat.
USCRN shows no warming apart from a bulge during the 2015/16 El Nino, and is basically a near zero trend match to UAH USA48
It should be noted that UAH Australia also shows no warming since 1998, and I’m pretty sure that an AUCRN would have been the same.
60
Temperature readings at airports are totally flawed fullstop.
I remember one time in an A380 waiting to take off behind a queue of at least 2 other A380’s.
The external temperature reading on the inflight entertainment was reading over 70 Celsius (not Fahrenheit). This was on a day where the outside temperature was probably 29-31C or so.
It seems the only people who think reading air temperatures anywhere near a place where you find dozens of idling turbofan engines on red hot tarmac, work for meteorological agencies.
50
As you say an airport is the wrong place to be recording temperatures, a landing aircraft is blowing lots of hot air out of the reversers (it is tapped off the compressor and is very hot) the brakes get smoking hot after a landing roll and craft taking off are blasting heaps of exhaust gases out the back.
30
Airport radar is just one source of incorrect readings. Lightening is another major source.
I suspect that the logging equipment used when subjected to Electrical Fast Transients or Surges will give incorrect readings. Large errors will be obvious but the disturbance can be anywhere from nothing to destroying the equipment.
In most standards there are a number of classes of interference such as.
1) Must not cause any error in reading.
2) May cause an error in reading but must resume normal operation when disturbance is removed.
3) May case an error and stop working but resume operation without operator intervention.
4) May cause an error and stop working requiring operator intervention.
5) Destroyed.
My moneys is on the BOM only qualifying to 2) or 3) and then there are the levels such as residential, commercial, industrial and the military and automotive levels. I.e. a safety system in you car will have a much higher immunity requirement than a convenience item.
60
Most instrumentation systems connected to long instrumentation lines have protection systems to avoid the affects of lightning. This could include high-energy such as gas discharge tubes, tranzorbs or MOVs. For the lower levels, Shottky diodes across the amp inputs would suffice.
20
” Schottky diodes across the amp inputs would suffice.”
The leakage current of the Schottky diodes would change with temperature and cause an even worse error. No can do.
40
Graeme#4. You have only mentioned protection devices that “may” help prevent the destruction of the equipment. Nothing that you have noted will in any way stop an incorrect reading.
10
Antenna size has nothing to do with power, only gain. High gain means lower power side lobes which MAY interfere with electronics. The main beam is blasted off into the ether so cannot have an effect.
Airport radar is not primary radar so is not searching for an echo, so with a high gain dish, a tuned antenna in the target aircraft and limited range [60 mile?] there really is no need for high power. Besides such a run would be coaxial cable or some other shielded cable.
I don’t see a problem.
41
The radar antennas shown in the photo is both primary radar and SSR. As somebody who once taught airport SSR for a short time, that’s easy to determine.
20
How many airports have primary radar and when would they use it?
20
Remember MH 407? Only one military RADAR ever saw it. Search RADAR sure ain’t common.
10
Actually I think the answer is none. Perth’s primary radar was up in the hills, well away from the airport. Need to email somebody to find out the full story.
10
Ok, I need to correct here. Terminal Approach Radar, used at Australia’s main airports, is now called primary radar, whereas the term was used for the high-power radar systems located away from the airports.
10
What is the peak power of that RADAR?
10
Trying to find that out right now. Strangely, couldn’t find the data on the CASA website, so need to talk to the CASA techs.
00
Opinions are like aoles – they’re easy to find, but technical data is much harder. I often come up empty.
I think the magnetron is magic and often search on its development during the war but I still don’t know where and when it was first used. In my eyes RADAR without a magnetron is just fancy radio. Someone above said the Japanese developed it but that’s odd because they were always behind the Americans in both shipborne and airborne RADAR.
00
-here’s the answer.
-show us your working.
-No.
40
Methinks this is stretching a very long bow. For a start, I’m sure that, as per most instrumentation connections to measurement circuitry, the RTD inputs would be 2-wire and connected to an op amp that has a high degree of common mode rejection. This is a standard technique to greatly minimise the effects of common-mode noise on instrumentation inputs.
Secondly, it’s quite easy to filter out any RF signals by bypassing with good-quality ceramic capacitors at all points in the measurement circuit, including its inputs. And surely the measurement circuit would be mounted a shield box.
Of course, time-averaging the inputs would also go a long way to making sure that any short-term fluctuations would not show in the measurement record. But regardless, I don’t believe that RF interference would be an issue.
31
I agree. The RADAR pictured was not selected because of any specific problems [I assume] but because it is “big and scary”. It is on a tower on a multi story building, pointed into the air [because that’s where the planes are]. Any thermometer would be over a mile away [airports are big] and any side lobe that may be pointed to the ground would be attenuated because of the high gain antenna and further attenuated according to the square law – double the distance, reduce the power by a factor of four.
We sceptics should not mimic the AGW alarmists by magnifying a grain of truth until it becomes a major problem.
30
According to google.earth the London weather station is about 1 mile from the airport with the Radisson Red between them so the photo is “for illustration purposes only”. Urban heat island could easily effect readings but not the RADAR or jet wash.
30
“according to the square law – double the distance, reduce the power by a factor of four.”
So what direction and distance from nose cone radar do we have?
20
Ask a meaningful question and I may be able to answer.
Look up inverse square law and you may find the answer.
20
My question is not about inverse square law i am very familiar with that. I am pointing out that in the nose of aircraft that can come very close to the automatic weather stations and be pointing right at them are radar transmitters.
Your inverse square law argument proves that could be a serious issue.
10
The assumption then being that aircraft turn on their radar on the tarmac. I don’t know whether they do or don’t, but surely turning them on early could constitute a heath hazard to folks on the tarmac? Again, this surely is just another blind alley – there are more important issues to discuss WRT weather stations.
21
The assumption then being that aircraft turn the radar off before landing as well. Not to mention the airport radar reflecting off planes that have not yet landed.
20
This is getting silly. Aircraft only have a low power weather radar. Why would it be spraying the airport if it was powerful?
Reflected signal is micro watts and needs a high gain antenna and sensitive receiver to pick it up. Any vehicle radio would be thousands of times more powerful.
22
Yes, H, this is not a rabbit-hole worth going into, as it’s wide open to valid criticism. I think it far better to investigate whether airport weather stations are part of the Acorn network – surely that would be a major concern.
20
It’s hard going against the group-think here.
10
Hanrahan & G4
Suspect you are very probably right. Thing is we don’t know for sure and BOM won’t give up the evidence. That is the suspicious bit.
Doug
30
I never wanted to be devil’s advocate here but what you ask could be a “When did you stop beating your wife” type question. Rightly or wrongly they can simply dismiss any enquiry.
20
Hanrahan
The interest in internally generated and external interference noise sources comes from seeing a vulnerability caused by the BoM detection of potential outliers as the extremes. They choose them and loose the more typical median or average values. The hunt for the cause of large sudden changes in readings has intensified due to the presence of them being easily seen in real online data and by various people who have acquired other relevant data such as Jennifer Marohasy’s acquisition of parallel data. Significant long term errors are seen.
The possibly related vulnerability is due to a lack of rejecting potential noise spikes other than one insufficient and poorly though through error detection routine in their published documentation in combination with deletion of good readings that could have been used to get a short term average or median value.
There is a real problem. Can you suggest an alternative cause? Please.
10
All I’m saying is that airport RADAR is only a minor problem at worst.
Could not possibly be one at Heathrow, the system illustrated.
20
Only needs to be a minor problem at the time of maximum temperature recording to nudge the peak detected value up a tad.
00
Well said H. Reminds me of Ralph Nader, when following his successful and justified comments about a particular vehicle, then tried to branch out into other areas, including electronics, and came a cropper.
00
Graeme#4 You might want to stick to antennas because your EMI in relation to instrumentation knowledge is lacking. As I have stated elsewhere frequencies above an op-amps bandwidth result in undesirable side effects and your assertions that such frequencies can be easily dealt with using ceramic capacitors is just nonsense.
10
I think I’m correct in that none of us have the chance to look at the measurement system and its circuitry. Nor have we had the chance to measure its performance under a range of external signals. So this is all conjecture and assumptions, and quite frankly, it’s achieving nothing but upsets. Jeremy, Russell and H. are I believe quite correct in their concerns.
As somebody who has had to design electronic systems to be produced in their thousands and work reliably in the field, I believe this discussion is going nowhere.
00
Well Graeme#4 get back to me when you have designed logging equipment used by the Australian Military and passed very high level Mil EMI standards along with having your own RF lab then I may take some of you comments more seriously.
What EMI testing did you do on your designs?
10
While I totally support the exposure of BOM parallel data, I don’t think attacking the noise “quality” of electronic measurements is a wise move. After all, I don’t think it would come as a surprise that all satellite and radiosonde measurements are done using similar techniques. Sure, upper-atmosphere and space have less “local” noise sources but how can we be sure that those measurements are free from the same instantaneous impacts from comic events.
I do like the airport-measurement problem with localised blobs of hot air moving around but I’d favour an attack on the quality of previous max/min temperatures using sub-standard technology compared to today. It is far more likely that human-readings or max-min mechanical indicators of the past were also subject to all sorts of failures or inaccuracies.
So the only way to truely “calibrate” for trends or comparisons between periods of the different technologies is to analyse a long-run of parallel data.
If this parallel data is available and is not made public, something must be being hidden (either BOM incompetence or an unhelpful outcome to the IPCC narrative).
BOM will regret not making this public when the government turns on them after CC deadlines fail in 2030/2050. Even worse if there is a change of politics.
Tony Abbott was close to exposing them – do they want their toes in the fire again?
32
100% agree Russell.
22
I quite disagree Russell — if electromagnetic interference is a problem with satellite data or radiosondes they have had 30 years and $1Trillion dollars in vested interests to find it. They have rehomogenized, reanalyzed and studied those datasets looking for any reason to rule out cooling and find a warming trend they can’t find.
Plus, isn’t the data open source? That’s nothing like what we are dealing with here with massive hidden datasets and potential problems which are solveable and testable but they hide the data so it can’t be assessed.
Information is always our friend. Truth matters and skeptics will always win from open source data with all major errors identified.
PS: Why would we wait til 2030 or 2050 for CC deadlines to fail when they already fail on every count?
With censorship only getting worse week by week, we have no time to lose.
60
Sorry for any misunderstanding Jo but I am on your side. I just think it is unsafe to fault high-tech modern temperature measuring gear – signal-wise.
We could attack the methodology that BOM are using on the raw data (as Jen has suggested) but the actual sensor and raw datalogging seems pretty sound technically.
Is anyone interested that any apparent upwards trend in temps might be because earlier methods (human-reading or max-min indicators on mercury) might have been measuring systematically low?
The activists should accept that the relative temp changes they suggest can have systemic error bars for both mercury and electronic values. Do they overlap?
BOM’s disclosure of the full parallel readings is critical to fully understand the true temp trends at each specific location. There lies truth.
I don’t think anyone should be aggregating average temp across various sites – it is as meaningless as adding Total System Energy across various Bulk Supply Zones.
Just too many variables like latitude, winds, mountains, volcanos and the daddy of them all – temporal impacts of discrete time zones.
And I am not suggesting we wait till CC deadlines fail.
But I am registering the pig-headedness of BOM for not disclosing their records of parallel data – now! I absolutely believe they will be reading your blog.
Also I am very suspicious that they do not have the parallel data except in some rare cases.
So not as wide-spread as it should be for a professional job – even more embarrassing than the solar panel pointed at the Stevenson Screen?
31
Russel. You faith in so called “ high-tech modern temperature measuring gear – signal-wise” is completely misplaced. The equipment they are using will at most meet basic industrial requirements which is no where near fit for purpose when it comes to spending billions of $. I have been looking at a lot of loggers that are advertised as suitable for weather stations and none so far have specified the EMI test standard and levels that they meet which is a total disgrace.
30
Red, thanks. This is very interesting and I’d like to hear more.
10
Russell —
What evidence makes you confident in this? Given the errors and obvious noise in the BOM data, and their inexplicable “secretive behaviour” hiding the data, I am unable to figure why anyone (except a BOM employee) would say it was “pretty sound technically”.
Why is it “unsafe”? That’s a strange phrase to use. Who exactly might get hurt because I asked a question the BOM can’t answer?
Forgive me, I’m not convinced you are on my side?
30
Jo, Lance,
There was discussion among some of us here in Australia in 2020 about AWS versus LIG observations. I wrote to BOM with an example of differences from three official stations.
This link shows the magnitude of some differences in graph form. It also shows the BOM response.
Interesting comparisons, uninteresting explanation.
Geoff S
https://www.geoffstuff.com/awsvlig.docx
40
There needs to be some serious testing done by a third party to determine if this is a real problem or not.
Years ago, I worked at an industrial installation where we had occasional boiler trips on flame failure, it turns out someone noticed it usually happened when there was a truck parked beside the boiler delivering product, each time he reported back to base on his two-way, it tripped the flame scanner, our electrical engineers poohpoohed the idea it was the truck radio as ‘The wiring was all shielded, can’t happen’..
Years later it was determined it was indeed the 25W two way radio causing it.
60
Actually it needs to also be done by the BoM if they meet the WMO guidlines as per the link Jo gave above WMO 8 2018 Volume V 4.2.3
“An electrical/electromagnetic interference test programme document should be prepared. The
purpose of the document is to establish standard electrical/electromagnetic interference test
criteria and corresponding test procedures and to serve as a uniform guide in the specification
of electrical/electromagnetic interference susceptibility requirements for the procurement and
design of equipment.
The document should be based on a study that quantifies the expected power line and signal
line transient levels and rise times caused by natural phenomena, such as thunderstorms.
It should also include testing for expected power variations, both voltage and phase. If the
equipment is expected to operate in an airport environment, or other environment with
possible electromagnetic radiation interference, this should also be quantified and included
in the standard. A purpose of the programme may also be to ensure that the equipment is
not an electromagnetic radiation generator. Particular attention should be paid to equipment
containing a microprocessor and, therefore, a crystal clock, which is critical for timing functions.”
40
The very high frequency of the weather radar (2.7 – 10Ghz) would probably not be absorbed by the cables on the weather stations. These radar transmitters also tend to radiate from a high tower and RF would pass over the airport at ground level. However, there are other sources of RF that might cause issues such as the aircraft themselves on 120Mhz. However, if you wanted to prove a point, you could set up a spectrum analyser nearby and record the sources of RF to see if it correlated with temperature spikes.
41
Exactly.
11
Serge, mostly we were not talking about weather radar but about the Primary and Secondary Airport radar. Though there is a possibility of electromagnetic interference from many other things. Some which may be very intermittent and hard to detect.
The BOM has a lot of data but they won’t let us see it. Why not?
40
“However, there are other sources of RF that might cause issues such as the aircraft themselves on 120Mhz. ”
That 120 Mhz system is also AM so very likely to produce audio frequency interference if it can find a nonlinearity to upset.
00
As an electrical/electronic engineer that has worked on sensitive gear in electrically noisy environments for decades I find this highly speculative and somewhat desperate. As if engineers don’t have any experience working in a high energy environment such as an airport. Not a very convincing argument especially when claiming any noise results in a positive temp reading. I guess there will be a lot eye rolls from engineers like me reading this stuff.
12
“especially when claiming any noise results in a positive temp reading. ”
As an electronic engineer would you consider this system to be vulnerable to detection of maximum and minimum outlier values departing from real values at a rate of 0.3 degrees per reading? These words are quoted from the BoM 2017 review of automatic weather stations.
https://apo.org.au/node/106276
30
Jeremy Cavanagh
If your answer is yes as it should be, the next question is:
With noise sources that could cause anomalous rates of rise greater than 0.3 degrees being mostly more extreme in the daytime would the average of daily (min+Max)/2 be shifted up by them should they be present?
30
Thank you Jeremy. Could not agree more. We rightly castigate the IPCC for using many assumptions, and yet the same is occurring here.
03
JC. First mistake is to assume all engineers are created equal. Fact is some at really good and others are complete duds. You will also find that the end solution is the result of a long list of compromises. So the question is what were the priorities and what compromises were made in specifying and selecting the equipment. Which begs the question are the loggers and sensors fit for the purpose of measuring climate change and the resulting $billions being wasted or are they perfectly suited for airport weather and letting the public know how hot they should feel. The second one I can do with $50 worth of hobby gear. The first I would start at $20K and go up.
10
Jeremy, you need two hats: Normal and climate change.
With you normal hat on you are correct. Many instrumentation engineers would have specified and installed good and effective monitoring equipment.
Now put on your climate change hat on, you will recall that Acorn equipment had a hard limit coded into the firmware which prevented the recording of temperatures lower than -10C, if I remember correctly. Your climate change hat/head said its a one off at one station, don;’t worry about it.
Your normal hat/head would say ‘how on earth did that kit get into service’??? wasn’t it tested, checked, validated, spec’ed right etc etc etc.
Quick, quick, put your climate hat/head on, phew! don’t worry, you can trust the BON!!!
There are two different worlds, one where good data is gathered and cherished. the other where data is a pliable product that does as it is told. And tell a story it does!
30
Swap those two hats for an investigative hat and an extra investigative hat.
The investigative hat should find you this.
Neither Goulburn or Thredbo being ACORN stations.
Now put the extra investigative hat on and you will find that the “not fit for purpose.” situation resulted from a BoM design specification. The problem existing in possibly all the Australian automatic weather stations between november 1996 and about the year 2000. Almost definitely being present in all the ACORN stations.
Details here. “BoM failure as specified by BoM”
http://www.warwickhughes.com/blog/?p=7084
20
There are two worlds’ yes, SR, the Real World and the Cargo Cult world.
10
Hanrahan wrote:
There was no reply button (???)
Anyway, strictly speaking a magnetron is a vacuum tube which uses a magnetic field instead of a control grid to regulate the flow of electrons between anode and cathode. RCA had a patent by about 1917 if I recall correctly. But for radar, a magnetron is designed to resonate at a certain frequency.
It was a Japanese scientist, named kinjiro Okabe, who invented the magnetron for this. This happened in 1927. Okabe’s magnetron was a split anode magentron. The spit anode created two resonation chambers. The Japanese had developed a cavity magnetron which produce 10cm electromagnetic waves at 500 watts by April 1939. Actually, the Japanese developed a whole array of cavity magnetron designs by 1942.
A German self taught scientist used split anode magnetrons to build himself a mobile phone system (a cell network) when he drove around Berlin in 1933.
The German firm of GEMA had already used a cavity magnetron for radar during 1936. GEMA had an operational ship borne radar by 1938, but they did it without using a magnetron. It was not a primitive radar. It featured phased array scanning and it had range resolution as fine as 25 meters using 2 micro second pulses, and a range to a cruiser exceeding 25km. The Germans navy’s first radar was a continious wave radar design in 1934. Normally CW radar can not measure range. But GEMA invented a way to measure range by comparing the phase shift of the echo to the phase to when the signal was sent by a master osculator. They carried this over to their pulse radar designs. The advantage of this technology was a superior resolution for range.
The speed of light is 299.999999- repeating meters per microsecond. So the minimum resolution for range using only a 1ms pulse is 150 meters. (300/2 because the leading edge of the pulse will have already bounced off the target before the trailing edge reaches it.) But using GEMA’s phase comparison method the resolution was greatly improved. But a magnetron is not conducive to this method of range measurement, so they dropped it from the design.
The cavity magnetron seems to have been a case of independant invention in different places during the 1930s. The British got a leg up from the French, by giving what they knew about magnetron cathode design to GEC engineer EC McGaw, and the British gave their centimetric radar technology to the Americans during the Tizard Mission of 1940. But Hans Hollman applied for a German patent for a cavity magnetron in 1936, if I recall correctly. The Swiss developed a cavity magntron operating at centimetric wavelengths during 1936. The Swiss magnetron was not a secret and was written about in engineering journals if anybody had cared to look.
10
Around 30 years ago i was engineering manager for a paper mill in Nowra NSW. We had lots of low current control circuits (4-20mA, thermocouple, frequency signals etc. and despite rigorous screening and earthing protocols, still had many more problems when the Naval Air Station about 15km away was operating its radar and things often went haywire when an electronic warfare plane they had came anywhere close.
20
Thanks Garry. Yet again someone who has been there and done that confirming the problem.
10
Probably should have kept the old thermometers in place as backup.
10
Seems to me simplest test is replace the thermistor with an NPO resistor in the same physical place/mounting and log for a week, or even longer. Any “noise” would be inherent in the physical layout etc etc – ground loops, EMI, ADC repeatability etc etc would ALL show up as noise, and you would have a good idea of what you were up against.
This sort of “base line” is required if you are serious – and adjust your design until it meets spec with the “flat line” you expect from the NPO.
Without this, no amount of bench/lab testing means anything – the “real world” always has a “gotcha”.
20
I am not sure Pearce would be a good example, the BOM sites at airports are not there to measure temps every few seconds they are there more for wind speed/direction and atmospheric pressure. There is a very good chance the BOM station is very poorly sited just like the one at Edinburgh which sits a few meters away from a taxi way.
10