Electronic sensors can pick up phantom electrical noise
In the last thirty years the Bureau has installed electronic thermometers all over the country. But unlike the old glass ones, the new sensitive equipment can not only pick up freak gusts of hot air, they can also pick up electrical interference. Theoretically, electronic thermometers could report phantom measurements induced by large electric fields, like perhaps by an airport radar as it sweeps through the electronics.
Indeed as Lance Pidgeon points out, the cable that runs from the platinum resistance probe runs out of the Stevenson screen, down the pole, under the ground and pops up at the electronic data-logger some 6 to 10 meters away. This makes for a nice long aerial ready to pick up “noise” and feed it into the data-logger. Those airport radars produce huge electric fields — all it takes is slight induction of a voltage difference across the 10m cable and voila… the data logger records a “warmer” second.
Here’s the small forgotten airport radar at Heathrow standing about 12 stories high. Imagine the power that puts out?

Electromagnetic interference could also be triggered by mobile phones or radio waves, lightning, two-way radio or television broadcasting as well. Theoretically, at least, it’s possible that any “hottest ever temperature recorded” in newspaper headlines could have been generated the moment the pilot messaged the control tower. Or it could be a maintenance truck driving past, someone in the car park starting their engine or anything electronic really. This was never an issue with a glass thermometer.
As Jennifer Marohasy explains, electronic engineers appreciate this point immediately:
As an analogue engineer recently explained to me, because of all the radio interference at airports, it is not really a place to be recording temperatures with resistance probes. Yet this is exactly where most of these temperature recording devices are now located – and not just in Australia, but across the world. So, the average global mean temperature may not only include the blast from a jet plane landing at Cordoba, Spain, but also the chatter from pilots and the control tower because temperature is now primarily measured as changes in electrical current and at airports.
Is this a problem? Who knows — The BOM is hiding the data that matters
The Bureau of Meteorology say that the new electronic gizmo’s are set up to mimic the old glass thermometers. They carefully calibrate and compare the two types of thermometers in the same box at the same time and in many sites. They have that data. If the electronic systems were working similarly to the old glass ones, and were protected or filtered from the noise, years of side-by-side measurements would show a close correlation and minimal disparities. Too easy, right? But for some reason, the BoM have to hide the parallel data and fight tooth and nail to keep it hidden from the prying eyes of skeptics — temperature data is “a national secret” or something.
Perhaps they’re just trying to save Australians from getting depressed and angry. If hypothetically, airport radars and tarmac caused phantom “global warming” all those trillion dollars worth of solar panels and wind farms would be a total waste of money. To solve global warming we’d just need to go back to glass thermometers.
Sighting the odd phantom hot-second…
We know there are glitches in the system, even if we don’t know exactly what causes them. On the BOM live reporting pages there are often differences within the same minute that are hard to explain. In this one below from Pearce Air base at 11:50am on the 6th of March there was a 1.3C difference between the highest reading of the minute and the last reading of the minute. Sometime in that sixty seconds either the air temperature changed radically, or there was noise in the system.
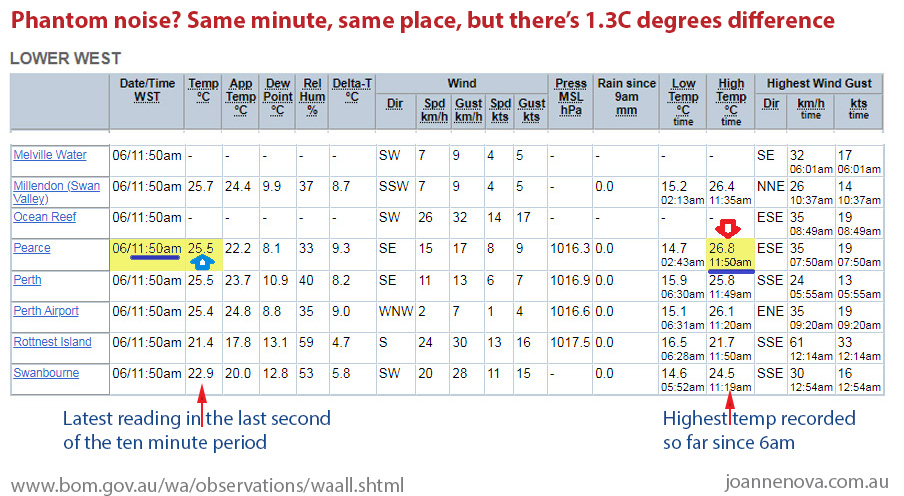
Click to enlarge
These kinds of anomalies only show up briefly on the BoM observation pages. (Eg NSW, VIC, QLD, SA, ACT, NT, Tas, WA.) Someone has to be watching to notice when the highest temperature of the day occurs at the same minute as the current observation. The ten-minute data comes from the last reading of the minute, but the highest or lowest temp recorded can cherry pick any second — effectively fishing for the extremes. And it doesn’t average out. See below — for lots of reasons there are more extremes in hot afternoons than there in the cold hour at dawn.
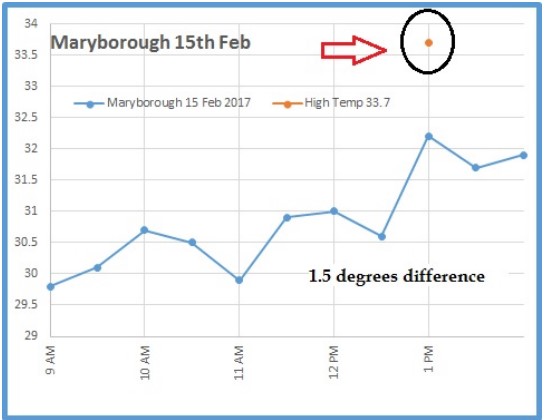
Strange noise pops up in other observations. Here below are the measurements every half hour at Maryborough one day in summer. Ken Stewart had noticed that the BOM have different “live” reporting systems and they often conflicted. The 30-minute observations reported 32.2C at exactly 1pm, but the “Latest Observations at Maryborough” reported 33.7C at exactly the same time. That’s a 1.5C temperature difference, and in the same minute?
From the post: One second records in Australia — how “noise” creates history and a warming trend.
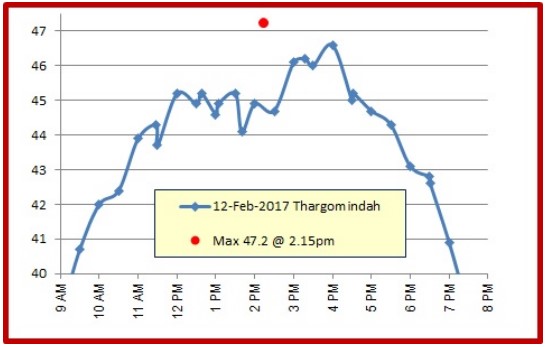
Here’s a similar thing at Thargomindah.
The hottest time of day is the noisiest too
Lance Pidgeon also points out that thermal noise, just from the heat in the probe — is a problem in electric probe thermometers — it’s called Johnson noise, and would be worst at the hottest time of day.
The BOM would argue the thermal heating noise is a well known phenomenon, but as Lance points out a single electronic gizmo thermometer can’t be perfectly tuned to both maximum and minimum thermometers at the same time. Maximum thermometers were traditionally mercury thermometers, but minimum ones were more likely to be alcohol thermometers and they have slightly different profiles.
It’s also true to say that hot blobs of air float around at 1pm, rising off tarmac, but not to many cold blobs levitate 5 feet off the ground at 6am, or any time. It isn’t symmetrical. There is a lot more turbulence, volatility, and also plane traffic and radio chatter at 2pm in the afternoon affecting the maximum temperatures. And as long as the maximums are being warmed, the headlines of deadly heatwaves will keep writing themselves, and the average temperature of the day will still keep rising too.
For the technically inclined
The BOM claim to have worked on the platinum resistance probes to make them mimic glass thermometers, but problems are more likely to be in the long cables and other electronic gear like the data-logger.
Lance Pidgeon: Breaking the automated measurement system into the two parts that are several meters of cable apart, i blame the data logger for most of the problem. Not the simple resistance probe even with its dubious time constant. Specifically i blame the lack of averaging. The small signals are vulnerable to the many forms of higher frequency electrical noise generated both within and external to the system. The missing averaging could cancel most of this out by lowering the frequency response to near that of a glass thermometer. Thus rejecting most of the electrical noise but allowing the desired signal.
If the BOM had sorted all this out, why are they hiding the parallel data?
Electromagnetic interference is a well known problem, at least among electronic engineers, if not meteorologists. The WMO – World Meteorological Organisation warns of electromagnetic interference and talks about testing for such. (vol 5, Section 4.2.3)
In 2018 edition – Volume V: Quality Assurance and Management of Observing Systems part 2 CHAPTER 2. SAMPLING METEOROLOGICAL VARIABLES at 2.1 This pearl of wisdom.
In general, sensors respond more slowly than the atmosphere changes, and they add noise. Sensors also do other, usually undesirable, things such as drift in calibration, respond non-linearly, interfere with the quantity that they are measuring, fail more often than intended, and so on, but this discussion will only be concerned with response and the addition of noise.
The bottom line is that it’s a real threat, but a very solvable problem. The question is whether the BOM have solved it. And the only test that matters is not a certificate from an inspector but the real life data, en masse, and in toto.
The BOM need to publish all the parallel temperature data so Australians know that the equipment is not just “world class” (which is appalling low) but comparable to the old glass thermometers. Conflicting temperatures that change by a degree within one minute tell us something is wrong. The BOM cover up tells us that too.
More information
See all observations for NSW, VIC, QLD, SA, ACT, NT, Tas, WA.
KensKingdom: How temperature is measured in Australia Part I/
The WMO (World Meteorological Organisation) 2018 edition – Volume V: Quality Assurance and Management of Observing Systems
Information on Primary and Secondary Airport Radar
Why is temperature data a national secret? BOM still hiding data