Think of the BOM as an advertising agency for big-government programs, and it all makes sense…
…
Apparently, after the stinging criticism about them, the Bureau of Meteorology is telling journalists and academics that “they publish all the data”. Jennifer Marohasy has been fielding calls and correcting journalists on air who are fooled by this claim. Clearly this isn’t true, or she wouldn’t have needed to spend three years on FOI applications just to get a tiny part of it, (and in the least helpful form possible , like 1,000 sheets of paper). The Bureau not only don’t publish this data, they actively work to hide it and fight FOI’s.
The BOM are not only hiding national temperature data, now they are trying to hide that they are hiding it too. There is some dynamite secret here. Why is it so important — perhaps because it shows that the BOM installed new thermometers that register artificially higher temperatures than the old glass thermometers do? Thousands of “hottest ever records” have been set by new electronic thermometers that might not have been set if we still used traditional thermometers.
If the Bureau can’t be bothered giving us the data, the country shouldn’t be bothered with the “transition” to unreliable expensive energy either (or with paying for the BOM a million dollars a day to study our climate).
Do the Bureau even care about Australia’s climate?
Climate is the biggest threat the world faces they say, but the Bureau of Meteorology aren’t so worried about it that they care whether their new electronic thermometers are correct. After the old glass thermometers were replaced with electronic ones, you’d think the bureau would want to check that the new style was recording the same temperatures as the old style would have. I mean, how could anyone compare temperatures in 1896 with 2016 if the equipment changed and the two instruments were not the same?
It’s easy to show whether the thermometers are equivalent, just put them both in the same box at the same time in parallel, and publish that data, then we’ll all know. The BoM set up the experiment, but the data from it is a national secret. The only conclusion anyone can draw from this behaviour is that the new electronic thermometers are reporting artificially higher temperatures than the old glass ones, and the BoM knows it.
As Jen Marohasy says, Australia is the only place in the world where it only takes one hot second to set a new maximum temperature record:
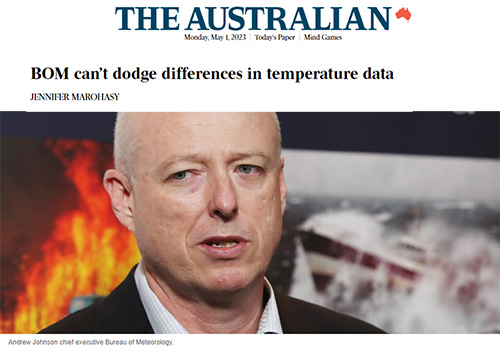
In his letter to The Australian on April 19, the bureau’s chief executive, Andrew Johnson, explains that they follow all the World Meteorological Organisation rules when it comes to measuring temperatures. This is as absurd as the bureau’s Peter Stone claiming that all the parallel data is online.
The bureau is unique in the world in taking instantaneous readings from the probes and using the highest in any 24-hour period as the maximum temperature for that day. In the US, one-second samples are numerically averaged over five minutes, with the highest average over a five minute period recorded as the daily maximum temperature. This is to achieve some equivalence with traditional mercury thermometers that have a slower response time, more inertia.
The BOM appears to be tacitly confirming Jennifer Marohasy’s findings, but saying even though the temperature differences are real, they’re small enough to be within tolerances. Skeptics say that same thing about the Planet.
Marohasy: The bureau does not dispute my findings. It has not provided its own analysis of the data beyond claiming that its own assessment of the full 2019-2022 period finds “no significant difference between the probe and mercury thermometer”.
It seems that some Australian academics are, on the one hand, quite prepared to claim that we should be fearful of temperatures exceeding a 1.5C tipping point, yet at the same time be unconcerned about the accuracy or otherwise of measurements from official bureau weather stations.
Until they give us the data it seems fair to say:
- The BoM have the data, therefore they know the new thermometers are creating artificial warming in the records. If these new thermometers were creating artificial cooling we’d know all about it.
- The Minister in charge, Tanya Plibersek, needs to take responsibility for either releasing the data or appointing a new CEO who has higher scientific standards. Does Tanya Plibersek care about the Australian climate? Does she care about science, and when will the ABC start grilling her “on behalf of the environment”?


Yes.
Why?
140
To hide there is no essential warming, period.
530
We need a royal Commission into this massaging of data.
70
I’ve personally cancelled climate and will just look at the weather.
370
Look at the weather?
I humbly ask is that scientific?… Don’t we need to listen to the experts?
That is what the BOM tells me.
(Note: they have a lot of experts.)
The BOM states this on their website:
“Find out about the experts behind our world-class research and how we support their innovative work.”
And… “Experts delivering impact and value.”
http://www.bom.gov.au/research/researchers/index.shtml
and this:
“We will further develop our real-time engagement and connection with the community, providing people with the latest data, knowledge, insight and wisdom from our experts in ways that are better tailored to meet their needs.”
Ok, So how can one not believe the BOM experts?….
It seems they can adjust temperatures using the arcane science of subterfuge/homogenising and then supply to “people” the “latest data” to “meet their needs”… Yet who knows the truth?
On the BOM’s webpage they self proclaim to be “world class” experts.
Yet.
I find it lacking that their “World class Experts” can’t place their stevenson screens correctly.
I find it lacking that their “World class Experts” can’t produce the parallel data that was recorded for all sites.
I find it lacking that any “World class Expert” has mislaid or lost a historical record.
I find that there are a lot of BOM “World class Experts” that have let me down as a taxpayer funding this organisation.
So I humbly ask.
Does the actual weather/climate get in the way of their modeling and desired outcomes?
and… Looking at the weather and recording it factually, with integrity at all sites, is that also so passe today for a “world class” BOM expert.
Whatever a “World class” BOM expert is.
600
The real message from the BOM is that they’ll deliver all Data that fits the “ narrative “, nothing more, nothing less. In other words the less said the better. Bloody hypocrites, leftist, Marxist lackeys.
630
My father used to say the definition of an expert was;
And that sums it up quiet accurately 🙂
200
At our place, a has been drip under pressure.
50
ColA,
My Dad’s was “an Ex is a ‘has been’ and a spurt is a drip under pressure”
Both seem to be on the right track with the BOM
60
It is someone who comes from more than 50 miles away, that is two towns away
20
I’ve studied the mission statements of another government department and they keep changing to (a) say what they think people want to hear and (b) outdo the previous one. In the 1990s they reduced the number of words by nearly half, removing anything remotely connected to a negative but necessary concept (eg dealing with trouble). Now it seems the more words the better. The real message is always “trust us”.
50
I just re-read what you wrote Graham. We’re saying the same thing.
30
There are more “experts” over at the CSIRO who also have never sought to challenge the hypothesis. I always thought that was what real scientists did. Then there are the multitude of “experts” infesting our universities who are so “expert” that no other voice will be heard. If the government i.e. taxpayers stopped funding these “experts” we would probably have no need to waste billions on subsidies and transmission wires and have good old reliable coal fired power stations.
I suspect the BoM is worried that the Earth will start cooling and that while people shiver they will have a harder job convincing them that they are in fact sweltering.
Newsworthy today is a story about a woman with a penis who has been found guilty of being a pedophile. When “experts” can’t tell the difference between men and women we are in serious trouble and “expert” loses its allure.
180
Breaking the automated measurement system into the two parts that are several meters of cable apart, i blame the data logger for most of the problem. Not the simple resistance probe even with its dubious time constant. Specifically i blame the lack of averaging. The small signals are vulnerable to the many forms of higher frequency electrical noise generated both within and external to the system. The missing averaging could cancel most of this out by lowering the frequency response to near that of a glass thermometer. Thus rejecting most of the electrical noise but allowing the desired signal.
500
Siliggy, your comment about rf getting into the cable is potentially very important, as if the input to the receiving amplifier is not properly protected against rf interference, it can lead to quite large and seemingly random input offset errors. This would be consistent with Jennifer’s comment about “all over the shop”. I had exactly this type of problem years ago (I’man electronicengineer), and I traced it to a CB radio broadcaster in the neighborhood. I wonder how many weather stations at airports have rf devices nearby, like aircraft, or control towers, or radars….
440
Yes those sources and 4kTBR, sqrt(kT/C) etc etc.
Even harmonic distortion riding along underground mains power as well as the fundamental, lightning, traveling along cathodic protected or ordinary underground pipes, telecomms cables and even magnetised train wheels.
220
Train wheels.
We used to live in an isolated valley with very iffy TV signals. The nearest we could get to the house was a bit over 200 metres away, across a road. THat’s where our antenna was, and I ran a 2 wire overhead line from there to the house. The reception was not good.
To service new coal development they built a railway line between the house and the road, later extending a passing loop across our driveway and under that line. This involved a moderately complicated signalling system.
The rails were continuously welded steel, 60kg/metre. They were insulated, mounted on concrete sleepers with polythene spacers above and below for insulation. There were insulated joints at various places on the line, and, from memory, a 9v potential difference between the rails. So that when a train crossed an insulated joint it connected the rails and this signalled to the system the location of the train.
When they completed their construction and powered it up we lost our TV signal. I had to buy and install coaxial cable to the antenna.
WE later paid $3,000 for a satellite TV system, with 2 commercial channels, Channel 7 in Townsville and Imparja from Alice Springs. Plus ABC and SBS in many (5?) time zones. THis at 200 km from Sydney.
60
Ted1 Re “I ran a 2 wire overhead line from there to the house.” and ” I had to buy and install coaxial cable to the antenna.”
Yep that could well have been a signal from the railway gear leaking into the unshielded pair. The rotation of train wheels being far too slow i think it more likely to be telemetry or just the big bits of metal. Putting about four or five twists per meter in the cable could sometimes help. Thus the name of the blue ethernet LAN cable which is four pairs of Unshielded Twisted Pair.
Did not know of that 9V system. Unless it is raining hard the satellite stuff works well.
21
I should point out that you never ever put those twists in coax. They are only for the old ladder or black ribbon type pair of wires you would have used. Also the railways cannot be blamed for causing problems where the signal is so fragile. It may not have been them but from an old style of insulator often used on pole mounted mains supply transformers. I have often seen broad band interference peaking around 70 Mhz from these pole top step down transformers. One was so bad i emailed the electricity people and they attended a few days later, telling me via email that their tester found nothing wrong but they replaced the old insulators anyway. The customer rang a few days later to say the TV had been great since the electricity people had done that. Now days the main interference problems are from LTE mobile phone frequencies. So much so that most antennae and amplifier etc have a filter or some form of rejection built in with “LTE compatible” proudly written on the box.
10
Thanks so much for publishing this, Jo. I think you have nailed it with this comment:
“The BOM appears to be tacitly confirming Jennifer Marohasy’s findings, but saying even though the temperature differences are real, they’re small enough to be within tolerances. Skeptics say that same thing about the Planet.
Yes. Most sceptics don’t deny that the climate is changing, but rather explain that the magnitude of the change is not catastrophic, and could even be mostly natural.
The Bureau, meanwhile, claimto know that Australia’s climate has warmed, on average, by 1.47 ± 0.24 °C since national records began in 1910. Oh, and its a catastrophe that we can avert by closing coal mines and investing in wind farms.
What the parallel data is likely to show that they’re ‘1.47 ± 0.24 °C’ while suggesting a high degree of precision and accuracy is mostly nonsense.
In reality the probes are all over the shop.
Also, it is worth keeping in mind that the more significant of the artificial global warming trends is probably generated through homogenisation. But what does any of this mean when the base readings/the observational data is so unreliable.
And of course, there is also the issue of poor placement, UHI, and the list goes on.
850
You are doing a great job exposing this Jennifer.
Unaveraged real noise from rapid air temperature changes that the glass thermometers may not have responded to so well and the electrical noise being superimposed onto that could explain a lot of it. They select the wildest believable outliers instead of the short term mean.
481
Thank goodness The Australian is taking an interest and putting pressure on the BOM.
If only the Opposition would put some pressure on Tanya Plibersek the Minister in charge. But they are too afraid apparently of being called a denier.
Imagine how different this would look if there was an association of Scientists or Meteorologists who were shaming the BOM for the scientific scandal of hiding their data.
680
There is an organisation or perhaps more correctly, a loosely formed club called (appropriately,j Frosterly. I think each capital or State office has one.it’s made up of retired BOM and related staff who are interested in weather and climate. They have irregular meetings and discuss scientific issues.
It would be interesting to get invited to a meeting to discuss this matter, and see what the response is?
I am mindful that retired scientists are often more likely to have an open mind!
430
Unfortunately our opposition parties are like having a watchdog that hides in its kennel and whimpers.
350
Utterly useless. Not just cowards but they’re actually perverting the course of democracy in this country by not providing fearless and substantive opposition.
20
Seeing the reluctance of the opposition to declare any real policies opposing the madness, leads me to believe that they are all “on board “ the same climate change train!
Same policies, only different salesmen!
360
The alp/lnp/greens uniparty works exclusively for globalists nowadays, trashing our standard of living in the process.
180
The opposition had no appetite for it when they were in govt and issues with the BOM were raised on their watch.
They probably now don’t see attacking the BOM as a vote winner. Obviously have given up hope of the sensible left and sensible right being united on practical issues.
10
Correct me if I am wrong as I try to reduce the story to something people could not fail to understand. Starting at the beginning.
If your measuring device, in this case a thermometer, reads to the nearest whole unit, in this case a degree, then for one reading, your average is that reading.
if you use that same system to take ten readings, each to the nearest whole degree, then it is valid to cite the average of those ten readings to the tenth of a degree.
It is not, however, valid to use that average to predict subsequent readings to the tenth of a degree.
200
More like measuring the crest of the highest wave at the beach each day as high tide. Then drawing a trendline back to old measurements that filtered out the fast waves, to declare the “highest eeevah and the long term change in sea level. Peak detected noise has become part of the measurement. The fast responding, super accurate and well calibrated gauge is more of a tool misused than a faulty device.
190
Just reading your comment again Ted1. This part of it is very very good.
Everyone involved in this discussion needs to understand that.
10
Where’s the evidence that individual weather stations are unreliable? Accurate thermometers have existed since the 1880s. Even if there were, homogenisation would detect and correct any outliers. The day’s absolute high is irrelevant if you are averaging at annual time scales.
539
“The day’s absolute high is irrelevant if you are averaging at annual time scales.”
No the noise sources are mostly larger during the day. So the maximum is shifted up more than the minimum is shifted down, Thus the long averages are perverted.
The un-averaged daily data being randomised also degrades correlations with the real causes, falsely making the vague fits all CO2 theories seem more likely than reality.
260
The more you “homogenise” (to urban warmed sites, and new thermometers reading high), the closer you get to a straight line with an urban warming trend.
This hides the fact that shows up clearly in UAH and STAR, that the only warming in the last 45 years has come from two El Nino events..
Thus has absolutely NOTHING to do with changes in atmospheric CO2
360
Simon asks: “Where’s the evidence that individual weather stations are unreliable? “
Doh. The evidence is hidden in a cupboard at the BOM of course.
That’s why the BOM fight tooth and nail to hide it.
170
How do you know what this supposed report says if you haven’t seen it? If you believe there is an issue, why not do your own study? Run glass and digital thermometers side by side in a standard weather station. Log the daily mean, min, and max. Are they significantly different over long time periods? It would make a good high school science project. Citizen science at its finest.
67
These studies HAVE been done in several places.
Uniformly they showed that electronic thermometers give higher maximum readings than mercury thermometers.
If you had the vaguest understanding how either of them worked, you would know that that HAS to be the case.
81
Simon >”How do you know what this supposed report says if you haven’t seen it?
It’s not “supposed”. It’s real. We have seen it. Here it is:
An updated long-term homogenized daily temperature data set for Australia
Blair Trewin, Karl Braganza, Robert Fawcett, Simon Grainger, Branislava Jovanovic, David Jones, David Martin, Robert Smalley, Vanessa Webb
First published: 08 June 2020
https://rmets.onlinelibrary.wiley.com/doi/full/10.1002/gdj3.95
30
Simon >”If you believe there is an issue, why not do your own study? Run glass and digital thermometers side by side in a standard weather station. Log the daily mean, min, and max. Are they significantly different over long time periods?”
That does NOT address our issue. Our issue is BOM’s 1 second sampling interval. If you don’t understand the issue why not at least try to get to grips with it?
You might start by reading Jennifer Marohasy’s 2017 essay:
In Australia, faulty BoM temperature sensors contribute to “hottest year ever”
Guest essay by Dr. Jennifer Marohasy 2017 October 19
https://wattsupwiththat.com/2017/10/19/in-australia-faulty-bom-temperature-sensors-contribute-to-hottest-year-ever/
30
Simon >”If you believe there is an issue, why not do your own study? Run glass and digital thermometers side by side in a standard weather station. Log the daily mean, min, and max. Are they significantly different over long time periods?”
What you suggest is what the BOM study did. But “Long time periods” are NOT the issue. The Marohasy essay previous should be perfectly clear on that.
See BOM study previous:
3.5.1 Transition to automatic weather stations
Table 1. Differences between automatic and manual temperatures at locations with parallel observations, and tolerance check results on the automatic probes during the automatic observations period
[Example]
Mildura Dec 1997 – May 2000
Difference (automatic – manual) (°C)
Maximum temperature −0.22
Minimum temperature −0.17
Mean temperature −0.19
Except this was a statistical difference over a 2 1/2 year period. It was NOT over a specific 5 minute period in which was recorded a PRT spike in a 1 second interval, or 20s, or 60s.
Jen Marohasy explains:
“Except to ensure consistency with measurements from mercury thermometers there is an international literature, and international standards, that specify how spot-readings need to be averaged – a literature and methodology being ignored by the Bureau. For example, the UK Met office takes 60 x 1-second samples each minute from its sensors and then averages these. In the US, they have decided this is too short a period, and the standard there is to average over a fixed five-minute period.”
20
>”In the US, they have decided this [60s] is too short a period, and the standard there is to average over a fixed five-minute period.”
NOAA Measurements: Air Temperature
“USCRN stations are equipped with three independent thermometers which measure air temperature in degrees Celsius. The station’s datalogger computes independent 5-minute averages using two-second readings from each thermometer. These multiple measurements are then used to derive the station’s official hourly temperature value.”
https://www.ncei.noaa.gov/access/crn/measurements.html#:~:text=Each%20USCRN%20station%20measures%20surface,to%20obtain%205-minute%20values.
30
Simon, I am already paying for side-by-side thermometer experiments all over Australia. I’m a taxpayer. Your request that I pay twice is just a diversion to hide the BOM cover-up and deceit.
Why does the BOM hide that secret data? Obviously, the data shows the electronic thermometers are producing “global warming” artificially and they don’t want us to know.
Prove me wrong…
60
Simon,
Ken’s Kingdom website (in Jo’s LINKS above) has spent years and much effort reviewing our individual weather recording sites and how most do not conform to the BoM’s own specifications and so the weather readings they provide are questionable because they are compromised.
You have been on this site for years and this subject has been discussed several times and Ken has been referenced often, why don’t you spend the time reviewing Ken’s work instead of asking ignorant questions?
https://kenskingdom.wordpress.com/
200
Simon, “homogenisation” itself, is not a valid concept.
It is absurd to think that a supposed anomaly in one station can be “corrected” by reference to another station hundreds of kilometers away.
Even worse, the “homogenisation” process used by BoM is also a secret. No one is able to reproduce the results as they won’t publish the procedure.
If they won’t publish it, it’s not science. The procedure is a political process to “prove” “catastrophic” warming.
400
Homogenisation is possible so long as the station cross-correlations are statistically significant.
431
Well correlated and highly integrated with the transverse data from inverse correlation.
110
Rubbish. ! Homogenisation is used a method of applying urban warming to otherwise untainted sites.
180
WRONG… Surface stations are highly affected by local heat, mostly from human urban development.
This would NOT be detected by the fake homogenisation routines because a large proportion of sites are compromised.
The “outliers” are the ones that are unaffected.
Yes, those unaffected sites do get adjusted by homogenisation to show fake trends.
Add in these new thermometers with their 1 second high readings.. and the whole system is totally unfit for finding out anything about the wider climate.
If BOM “cared” about the finding the truth about “climate”, they would have set up a set of pristine sites (plenty of room in Australia) like the USA did.
Apart from the 2015 El Nino bulge, USCRN shows no warming… possibly even some recent cooling.
But BoM don’t care.. they need to keep using sites that they know are compromised, so they can play around with the numbers, to get the result they want.
320
Can’t you read?
190
As far as I am aware, “data homogenisation” is only used by the BoM and the World Meterological Association also has an entry for it.
https://community.wmo.int/en/climate-data-homogenization
You simply CANNOT legitimately alter previously recorded data based upon other measurements hundreds or even thousands of kilometers away. Most people know this, even those working in other government weather bureaus, themselves corrupted by The Narrative.
NOTE: Geospatial data can be “homogenised” but that is a different thing. That involves georeferencing visual data taken by different sensors, radar, photograhic etc. and different methods e.g. aircraft or satellite, and taken at different angles etc..
100
Simon >”Where’s the evidence that individual weather stations are unreliable? Accurate thermometers have existed since the 1880s”
Not the issue Simon – you’re just deflecting, either by intent or ignorance.
The issue is the transition from relatively low sensitivity liquid in glass (AiG, MiG) to high sensitivity electronic (PRT).
The latter were only introduced to weather stations from 2000 in NZ and 1990s in AU – not the 1880s:
Measuring the weather – a timeline [NZ]
https://www.sciencelearn.org.nz/interactive_timeline/9-measuring-the-weather-a-timeline/
Australian Climate Observations Reference Network – Surface Air Temperature (ACORN-SAT)
Observation practices
http://www.bom.gov.au/climate/data/acorn-sat/documents/ACORN-SAT_Observation_practices_WEB.pdf
Supply and use of platinum-resistance
thermometers for field use
“The transition between AiG and MiG thermometers and the electronic PRTs is provided in Table 8. Most sites show a transition to PRTs beginning during the mid-1990s.”
The AiG/MiG => PRT TRANSITION is the issue.
50
>”The AiG/MiG => PRT TRANSITION is the issue”
Jen Marohasy: Jo Nova“After the old glass thermometers were replaced with electronic ones, you’d think the bureau would want to check that the new style was recording the same temperatures as the old style would have. I mean, how could anyone compare temperatures in 1896 with 2016 if the equipment changed and the two instruments were not the same?”
The AiG/MiG => PRT issue.
These are fundamentally different methods of temperature measurement. They do not record the same result at the same time (certainly not in the 1 second interval) therefore the timeframe in which there is agreement must be established – that’s 5 minutes (300 seconds) in the meteorology domain.
I worked in a materials testing lab long enough to know this. Same with weighing stuff. Electronic scales I used measured to 9 decimal places of a gram, took up to 10 minutes to settle, all windows doors and scales enclosure shut, no movement in the lab. If the sample was out of spec – repeat process and get the same result, or else …. (e.g. $100s of 000s in repercussions for road surfacing).
The weight analogy to weather temp is a bit like kitchen scales to precision laboratory scales.
The respective sensitivity is critical.
60
>”Supply and use of platinum-resistance
thermometers for field use [pg 16 BOM pdf previous]”
“The A2669 Specification (Bureau of Meteorology 1991–2003) of the AWS required an uncertainty tolerance for converting an equivalent platinum resistance to an equivalent temperature within ±0.02 °C, and an output resolution of 0.1 °C in routine operational mode. Individual AWS digitisation modules were tested in the metrology laboratory on occasion but as with the in-glass probes there is an assumption that the combined resistancedigitisation temperature measurement tolerance of ±0.5 °C is a sufficient test for these thermometers.
In the first two decades of these probes’ use, a small number of probes failed the inspection tolerance criterion and were returned to the metrology laboratory for testing. In the majority of cases the probes’ resistances were found to be within
the ±0.08 °C laboratory tolerance requirements”
# # #
So “within the ±0.08 °C” tolerance limit for PRT.
Page 16 in respect to MiG says:
“The use of the inspection MiG calibration certificate in field inspections has a mixed history. An audit of the process in the early 2000s suggested that some inspectors were concerned about what to do with corrections <0.1°C as available on the calibration certificate, when related to the ±0.5°C tolerance limits."
And "±0.5°C tolerance limit" for MiG.
But tolerance limit has nothing to do with the respective sensitivity over time (see next comment)
40
>”But tolerance limit has nothing to do with the respective sensitivity over time”
All I can see on respective sensitivity in BOM’s document previous is on page 4:
Reading manual thermometers
“Since 1996, the A8 data collection, where both inglass and PRT measurements are co-located in the same instrument shelter, has been maintained but not digitised.”
And,
“Determination of maximum and minimum temperature data from automated monitoring systems has been relatively static since the initial development of the AWS algorithms in 1990. The primary AWS sampling rate is 1 Hz [1 cycle per second], and mean, maximum temperature statistics are generated from the valid 1 Hz samples [1 per second] over the period of interest.
# # #
Simultaneous A/MiG & PRT data recorded at the same stations but “not digitised”.
This explains the “1000 sheets of paper”.
I can see nothing other than the above PRT “1 Hz samples” in respect to time sensitivity difference A/MiG => PRT transition.
I’ll keep looking at the document though. Again:
Australian Climate Observations Reference Network – Surface Air Temperature (ACORN-SAT)
Observation practices
http://www.bom.gov.au/climate/data/acorn-sat/documents/ACORN-SAT_Observation_practices_WEB.pdf
30
Interesting snippet on page 17:
“…most Bureau-staffed stations continue to maintain both the manually read thermometers and PRTs. The manual data such as reset temperatures are recorded in the A8 field book.”
They’re still compiling simultaneous data for A/MiG and PRT in staffed stations?
That’s a lot of data they’re hiding.
60
>”I can see nothing other than the above PRT “1 Hz samples” in respect to time sensitivity difference A/MiG => PRT transition. I’ll keep looking at the document though”
Found it.
It was only 7 sites:
An updated long-term homogenized daily temperature data set for Australia
Blair Trewin, Karl Braganza, Robert Fawcett, Simon Grainger, Branislava Jovanovic, David Jones, David Martin, Robert Smalley, Vanessa Webb
First published: 08 June 2020
https://rmets.onlinelibrary.wiley.com/doi/full/10.1002/gdj3.95
3.5.1 Transition to automatic weather stations
Table 1. Differences between automatic and manual temperatures at locations with parallel observations, and tolerance check results on the automatic probes during the automatic observations period
[Example]
Mildura Dec 1997 – May 2000
Difference (automatic – manual) (°C)
Maximum temperature −0.22
Minimum temperature −0.17
Mean temperature −0.19
More on this at #20.6.1.1 here:
https://joannenova.com.au/2023/05/why-is-temperature-data-a-national-secret-bom-still-hiding-data/#comment-2668492
20
Note that in the previous Mildura example from Trewin, the Difference (automatic – manual) (°C) Maximum temperature −0.22 is a statistical difference over 2 1/2 years.
It is NOT a difference between a specific 1s PRT spike and the corresponding MiG reading.
This is the crux of the issue.
More in the Rick Will thread at #20.6.1 linked previous.
20
See also at the #20.6 thread:
In Australia, faulty BoM temperature sensors contribute to “hottest year ever”
Guest essay by Dr. Jennifer Marohasy 2017 October 19
https://wattsupwiththat.com/2017/10/19/in-australia-faulty-bom-temperature-sensors-contribute-to-hottest-year-ever/
“In Australia, our Bureau takes not five-minute averages, nor even one-minute averages. As Ken Stewart discovered when he persisted with understanding the nature of the data he had been provided by the Bureau from Hervey Bay: the Bureau just take one-second spot-readings.”
31
Thanks for all your hard work, Jennifer. I’m still trying to discover why every Aust mean temps from at least 2000 – 2017 have been adjusted up by around +1.0C. Both 2001 and 2011 were below average means yet both years were adjusted up so they no longer are.
‘The Australian area-averaged mean temperature in 2011 was 0.14 °C below the 1961 to 1990 average of 21.81 °C. This was the first time since 2001 (also a wet, La Niña year) that Australia’s mean annual temperature was below the 1961–90 average.’
But according to BoM’s Time Series, they not below average. This has been changed as the TS used to show both years below.
http://www.bom.gov.au/climate/change/#tabs=Tracker&tracker=timeseries
Is this an ACORN adjustment or has the BoM been adjusting the 1961-1990 temp data?
230
Sorry. 0.1C – 0.2C; not 1.0C. Posting too early in the morning.
30
Hi Jennifer
I worked for a CRI in NZ many years ago
One project was to make a thermal insulation testing rig as caoex was never available.
The issues with both resister type sensors and thermal couples are immense, they both pickup all sorts of noise. Minute by minute averaged data is very revealing.
Another issue is what happens to the data before it is recorded the potential for data manipulation is always present.
Keep up the good work
110
Thank you HB,
Can you post any related data here?
Many of us would love to see comparison data.
Geoff S
40
Been 20 odd years so data files long since archived I hope I don’t work there anymore
from memory about + or – 0.2 deg C for no apparent reason
Suspected electrical equipment cell phones variations in power supplies and emissions from the likes of florescent tubes
Seems to match up with what Richard C is reporting
are data collection was basic a datataker logger made in Australia I recall
40
The Bureau, meanwhile, claim to know that Australia’s climate has warmed, on average, by 1.47 ± 0.24 °C since national records began in 1910.
https://ibb.co/Gd3zQ6r
Looks to me that current temperatures are pretty much the same, or a bit lower, than they were in 1910.
Graph ends in 2006ish, but we know there has been very little warming since 2002. https://ibb.co/HDpypLR
60
In school, if you “provide your answer” but cannot show your work and the method by which you arrived at it, the result can only be considered to be luck, at best, and cheating at worst. If the BoM will not “show its work” then the answer provided must be considered invalid.
490
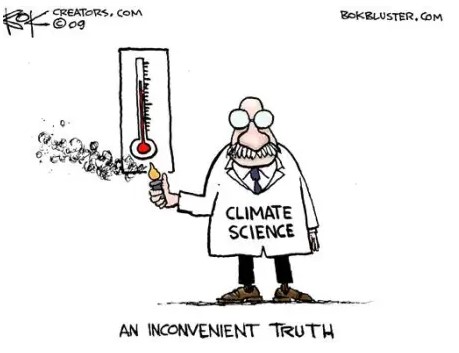
Great cartoon.
I cannot believe still that people are fantasising about the impact of a few degrees in average air temperature. Great. Cant’ wait.
Nothing will change at the equator or the poles. Floating ice makes no difference at one end and the other is at -50C anyway. And in the middle we should cheer the end of the Ice Age which made Europe and North America habitable. So what are we doing? Worrying about warming?
By the way, the oceans have 1400x the heat capacity of the air. Water temperature does not change summer to winter below the surface. +1C means +0.0007C in water temperature eventually. Run for the hills!
340
The concept of an ‘average world temperature’ using surface based thermometers is one that is impractical, and unrelable. There are too many things to go wrong.
And the John Christy/Roy Spencer UAH satellite temperatures (University of Alabama) dataset makes more sense to me, but it is ignored . .
221
Of course, the real issue here is not really the details of the applied science the Bom utilizes, it is the fact that the management and some of the climate practitioners appear to be following the IPCC AGW political agenda of a developing catastrophic climate emergency, rather than empirical scientific methodology.
Jennifer and her colleagues in the IPA, have for years been trying to expose the faults and inconsistencies in the BoM system, so that Australia can have a reliable historical climate database instead of the current ACORN mess, and also a decent process to produce better climate forecasts than produced by the new computer models that are simply not up to the task. Australia deserves better.
Any models or systems predicated on the AGW paradigm that blames CO2 for global warming, are systematically going to fail because the fundamental science is wrong! The world is experiencing cycylic natural warming that is beneficial not threatening. How long is it going to take for the climate alarmists to be reined in by the reality of their continual failures by their political masters?
350
“instead of the current ACORN mess,”.
I repeat Admiral Titley’s concise summary: “Every time they run the numbers they get a worse result”.
Failing to see that this means that 1. Mostly or always they got it wrong, and 2. There is a bias in their method.
They tell us: “An ensemble of models shows…”.
If just one of their models was sound, they wouldn’t need two.
220
Thanks Jo and Jennifer for all the effort that goes into detailing the inaccuracies pushed at us by our national weather service.
Some comments here seem to accept that there is a rising global temperature, but a simple analysis of sea levels tells the Truth.
Sea levels have fallen by 1.2 metres over the last two thousand years and have rarely been as stable and unmoving as they are now.
Basic logic around this point is that the poles accumulate ice that comes from the oceans and if the ocean levels are stable then the corollary is that world temperature is basically going nowhere in a hurry.
There is a thing that is Real Science, but the B.O.M. has no involvement with that at all.
Welcome to 2023.
390
The lack of averaging over a short period also annoys me. Today’s high at our local aws is an example of the noise this creates in our temperature records. The highest temperatures recorded at the 30 min intervals for the day was 18.2, the bom max reported 18.9, 0.7 degrees higher than the 30 min records. Where did that 0.7 come from, a gust of wind, a car parked near the aws, why did we get 0.7 higher than the 30 Min averages.The bom always reports the Max temp higher than the 30 Min records, I’ve not once seen the Max reported the same as the half hour records
300
Starting May 6, cold nights will begin in southern Australia.
https://earth.nullschool.net/#2023/05/06/0300Z/wind/isobaric/850hPa/overlay=temp/orthographic=-230.44,-31.96,1126
100
Started here yesterday. Cold again today. Frost predicted for Saturday.
Cheers
Dave B
60
Same in the Blue Mountains. Very cold nights close to zero coming up at the weekend.
60
On Sunday morning 30th April it snowed at Perisher ski resort.
70
Imagine as a “scientist” doing this knowingly and still thinking you are the good guys. The cognitive dissonance must be soul crushing. At least I hope it is.
280
i’ve often wondered that myself. Almost Faustian and a thoroughly compromised organisation. Such conflict of mind one would say , but perhaps they genuinely believe it is noble cause stuff.
60
Cognitive dissonance leads to learning. Not much of that evident in any government organization.
It reminds me of a girl I once taught who knew evolution very well at school and creationism very well at home. I asked her once how she reconciled the two. Her response was that school’s school and Home’s home. I’m not sure how long after school the impermeable barrier in her mind held out.
30
Climate Data. Noun. Corrupted versions of real world atmospheric observations obtained by manipulation and adjustments to match predictions by climate models.
Climate Model. Noun. Flawed computer code used to divinate the future behaviour of the Earth’s atmosphere.
Ergo: don’t bother.
150
The B.O.M. may block F.O.I.s,
To hide that they need to revise,
Electronic temp. claims,
Of our planet in flames,
Which are really just one second highs.
320
One of you best, Ruairi. Jennifer should adopt it!
50
As only 2% of people live in the bottom 1/3 of the planet and the BOM has inherited the best old data from the 19th century, we should be leading the world in the fight against fake data. However the reverse is also true, that the international political pressure must be immense for Australia to promote the invention of imminent Armageddon which is destroying Western democracies and pouring trillions into arming China.
This is fuelling the biggest military build up in history. And who is the enemy? Us. This happened before WWII as well as we supplied the iron ore for Japan, aided by ‘Pig Iron’ Bob Menzies.
And the fifth column and career opportunists in the BOM are directly responsible. It’s all fake science, very dangerous and utterly indefensible. But people need their jobs, so no one speaks out. And no one in the Australian Universities, as Dr. Peter Ridd found. People too scared for their jobs to tell the truth. And a cabal of leftist pro China governments and billionaires around the world. This is despite the openly conducted launch the first world mass biological weapon from Wuhan and millions of deaths.
This is how the Art of War is conducted in a nuclear age. Undermine your enemy from within, starting with their own institutions, traitors and Lenin’s useful idiots.
390
Good one!
150
Siliggy, your comment about rf getting into the cable is potentially very important, as if the input to the receiving amplifier is not properly protected against rf interference, it can lead to quite large and seemingly random input offset errors. This would be consistent with Jennifer’s comment about “all over the shop”. I had exactly this type of problem years ago (I’man electronicengineer), and I traced it to a CB radio broadcaster in the neighborhood. I wonder how many weather stations at airports have rf devices nearby, like aircraft, or control towers, or radars….
90
Like using unbalanced leads for live music.
You get interference from lights, motors, phones… you name it.
110
If it they refuse to publish it, it’s not science, it’s propaganda.
The only exceptions to this would be science as relates to certain military secrets or commercial secrets (but not consumer safety data such as for covid vaccines).
131
Sorry fat finger, see Green.
60
It is relatively easy to build a mathematical model of a mercury or liquid-in-glass thermometer as follows.
1) Text. https://everipedia.org/wiki/lang_en/Mathematical_Modeling_of_Mercury_Thermometer
2) Video. (Unrelated to above.)
https://youtu.be/JhBcLLu83yM (Note, hard to understand English, but plenty of text on screen.)
Text of video: Wikipedia
https://ies.ipsacademy.org/wp-content/uploads/2020/04/5.-Dynamic-Charecteristics-Mathematical-model-of-First-Order-System-for-a-Liquid-Filled-Thermometer.pdf
Note, the above models are real ones. Real modeling is probably unfamiliar to the BoM as what they call “models” are just mathematical games to produce political requested results and are not validated and can neither forecast or hindcast.
A comparison should be made between a validated model of a liquid thermometer, real data from a liquid thermometer and an electronic thermometer and run side by side. It will easily be demonstrated that the electronic thermometer will produce “hottest ever” results, as indeed is the political requirement for this data.
If the measurement technique used for any physical measurement hasn’t been validated and compared with a previous measurement technique, it is not a valid measurement. All data the BoM has collected with electronic thermometers is essentially meaningless.
150
Correction: The word Wikipedia above is surplus and not meant to be there.
50
210
And here we are!
40
Another problem is that except for about less than one handful of politicians in Federal Parliament, they are all scientifically illiterate, as well as in many other ways.
And the “opposition” Liberals (pretend conservatives) fully follow “The Narrative” anyway.
The last Liberal in power that questioned The Narrative was PM Abbott and that ultimately resulted in his removal as PM as warned about by Lord Monckton in the following 3.5min video before his removal:
https://youtu.be/NG0WcjGHkEw
You will recall that it was former WEF graduate and employee Greg Hunt that was behind the Cabinet’s refusal to allow Abbott’s request for an inquiry into data fraud at the BoM.
https://www.abc.net.au/news/2015-09-24/environment-minister-greg-hunt-killed-idea-of-bom-review/6803572
210
Can anyone define what the real temperature is at any location?
The claim is that somehow the thermometers are inaccurate by a fraction of a degree, and that this inaccuracy is based on an analog system based on manual reading and recording. Those who know the story of Student and the statistical test he developed would know the probability of errors in that system.
So you are comparing 2 systems both of which approximate the real temperature, and you want me to pick one over the other?
Next you will be telling me that UAH temperatures which use the an opaque measurement system, are routinely adjusted for drift, and have never been compared to an analog thermometer in the same location at the same time (weather balloons are ruled out because of that), are better than any SAT
And then there is the ongoing misunderstanding between weather and climate. worldwide, (and even the sainted UAH ) temperatures are rising when compared to the climate averages.
That is what the records are telling us.
321
It’s not about “accuracy” per se, but relates to the difference in time constants for the two different measuring systems. The mercury thermometers don’t react to random momentary heat noise, such as from a passing vehicle, or wind gust over a hot rock or structure, but electronic thermometers pick up these random, non-representative temperature variations and record them as “highs”, thus falsely generating a series of “hottest eeevvveeerrr” temperature “records”.
280
Or random cold noise? this dead cat will not bounce.
It does not matter, the temperature will always be an approximation.
For example, go outside, stand in the shade, and tell me (without instruments) what the temperature is. Now do the same experiment but limit your answer to Hot, Cold, or Comfortable.
which is of more use to you?
yet you are worried about an alleged difference which human senses could not detect, between 2 measuring systems.
12
Yet you demand we spend a Trillion dollars to cool the world by 0.01C — too small to detect with electronic equipment let alone to feel with our skin?
Call the Hypocrisy Ambulance, it’s an emergency!
90
“yet you are worried about an alleged difference which human senses could not detect”
LOL.. you mean 1.5C urban temperature increase in 100 years.
You have just destroyed your own fantasy of CO2 catastrophe…
.. and the manic and irrational fantasies that lead to political idiocies like Net Zero and destruction of reliable electricity grids.
Well done ! 🙂
30
“Or random cold noise?”
From car exhausts, jet engines… ok, whatever your fantasies.
—-
“which is of more use to you?”
Well.. most people in the world choose to live in warmer climates… How’s Siberia working out for you?
50
The cat is alive, well and dangerous.
That should be “and” cold noise. The extreme minimums are driven down by a lower amount because there is less noise that time of day. Less real fluctuations of air temperature, less thermal noise etc generated internally from system components because the electronics is cooler and less external electrical interference.
The (min+max)/2 daily average goes up and the diurnal range max-min goes up.
10
“And then there is the ongoing misunderstanding between weather and climate”
Perhaps you misunderstood the point.
Current temperature can be measured with a thermometer…. that is current weather temperature.
To measure absolute changes in “climate”, you need a reference climate temperature measurement system that is constant and fixed in terms of reliable measurement .
This is the total OPPOSITE of what surface station sites are.
The surface station sites are provably very strongly affected by local conditions that are always changing, population growth and densification, air-conditioners, new bigger buildings with heating and cooling systems that absorb heat and affect temperature readings. Thus an unreliable reference.
The surface sites are totally unfit for anything to do with climate.. period !!!
UAH and STAR operate on KNOWN accurate science… (just because you don’t comprehend it, is immaterial and irrelevant)
They are highly consistent, which is what is needed for “climate”, and are basically unaffected by small local urban perturbation.
They are the only system apart from USCRN that is actually suitable for “climate” measurements. (UAH USA48 trend matches USCRN, thus validating UAH)
[wee edit. – LVA]
100
Peter says:
“That is what the records are telling us.”
My cousins next door had a record player when I was young and I was able to hear what they were telling us.
81
“temperatures are rising when compared to the climate averages.”
Thankfully (LIA was apparently very unpleasuant)
UAH and Star data, unaffected by local urban heat changes, shows very clearly that that change in temperature has come ONLY from ENSO El Nino events…
… hence is absolutely nothing to do with the beneficial increase in atmospheric CO2.
There is basically zero warming in the last 45 years except those two strong El Nino events.
That is what the non-urban affected data tells us.
The change to 1 second thermometers, just makes the surface data even more nonsense for “climate” purposes than it already was.
70
“which approximate the real temperature”
Surface station sites only give the temperature at that site at that point in time.
Because most are tainted with urban heating effects, they DO NOT approximate the real temperature of the wider area.
Now change to 1 second thermometers that respond to air-conditioner breezes, traffic, car and jet plane exhausts, and you now have something which is even further from an accurate representation of the real wider-area temperature.
Your argument is meritless.
60
This is particularly true of the weather station at the Sydney Observatory which provides the temperatures for “Sydney”. Sited in a small, walled in, garden and close to the back wall, this site is only metres from the six lane Bradfield Highway approach to the Harbour Bridge and situated centrally atop of the Cahill Expressway circular ramp to the Bridge. How it can possibly provide accurate temperature records is beyond me. And to add insult to injury this year they positioned a loose solar panel in a position to shine the noonday sun directly onto the unit in a desperate attempt to get the temperature above 37°C, which it had not done this year. What a farce.
40
This is not the basis of the story. The BoM did what a reputable scientific group should do when they make a system change – compared the old and the new concurrently. Where they have failed is providing that comparison for public scrutiny.
They made a claim that the difference between the two concurrent systems readings were not statistically significant. But after years of seeking the comparative data involving tribunal hearings, a small portion of the concurrent data was released. Evaluation of the concurrent sets of data showed statistical differences.
Then BoM was not truthful about the availability of the parallel data ibeing in the public domain. That is the key hear – why not provide all the data for external scrutiny. We all burn in hell if there is another 0.5C degree increase in average temperature so it is vital to know how long we have- fractions of a degree really matter here.
The peak solar intensity is moving northwards resulting in the Southern Hemisphere being in a sustained cooling trend for the next 8,000 years. So far only Antarctica and the Southern Ocean are exhibiting that change in cooling trend but it will progressively work north. It will get harder for the BoM to maintain a warming trend in the data. The urban heat effect; the relocation of weather stations from regional post offices to regional airports; the increase in size and frequency of aircraft at airports then the change to electronic instruments have all added to the measured warming trend over the post WW2 era.
The climate prognosticators in the NH have the sun working with them to get a warming trend. The BoM have the sun working against them and they are running out of “homogenisation” scope to tease out a warming trend.
70
Rick >” The BoM did what a reputable scientific group should do when they make a system change – compared the old and the new concurrently”
Thread #4.2.6 referencing a BOM document (linked below) shows that yes, BOM are STILL concurrently recording with old (A/MiG) and new (PRT) systems. But where’s the documentation of any old vs new comparison?
>”They made a claim that the difference between the two concurrent systems readings were not statistically significant”
Not the issue. PRT is 1 Hz (1 second) sampling. Convention is the average of 300 seconds (5 minutes). This is critical for Max “highest ever” records.
>BoM was not truthful about the availability of the parallel data ibeing in the public domain. That is the key hear – why not provide all the data for external scrutiny”
Exactly.
Concurrent data is still being compiled (see page 17 below). They may compare even now but where’s the comparison analysis?
Where’s the comparator data?
Australian Climate Observations Reference Network – Surface Air Temperature (ACORN-SAT)
Observation practices
http://www.bom.gov.au/climate/data/acorn-sat/documents/ACORN-SAT_Observation_practices_WEB.pdf
20
>”where’s the comparison analysis?”
It was only 7 sites:
An updated long-term homogenized daily temperature data set for Australia
Blair Trewin, Karl Braganza, Robert Fawcett, Simon Grainger, Branislava Jovanovic, David Jones, David Martin, Robert Smalley, Vanessa Webb
First published: 08 June 2020
https://rmets.onlinelibrary.wiley.com/doi/full/10.1002/gdj3.95
2 DATA AND METADATA
There has been a transition from manually read, liquid-in-glass maximum and minimum thermometers to automatic weather stations with electronic temperature probes over the last 25 years. 98 of the 112 ACORN-SAT locations now use automated instruments, with a further three in parallel observations programmes between manual and automatic instruments as of mid-2019. The question of potential systematic differences between temperatures measured by manual and automatic instruments is addressed further in section 3.5.”
3.5.1 Transition to automatic weather stations
Previous assessments (Trewin, 2012), using nearby stations which had retained manual observations to assess the impact of the 1996 changeover to using automatic instruments as primary observations, had found no significant systematic change to either maximum or minimum temperatures.
To further explore this question, an assessment was carried out using data from ten locations where automatic and manual observations took place at the same time at the same place, or in very close proximity. At nine of these, manual and automatic instruments were in the same screen, whilst at the tenth, they were in different screens 3 m apart. The parallel observations revealed anomalous data for part of the comparison period (most likely associated with faulty or out-of-tolerance instruments) at three of the ten locations, leaving seven available for analysis (Table 1).
Table 1. Differences between automatic and manual temperatures at locations with parallel observations, and tolerance check results on the automatic probes during the automatic observations period
[Example]
Mildura Dec 1997 – May 2000
Difference (automatic – manual) (°C)
Maximum temperature −0.22
Minimum temperature −0.17
Mean temperature −0.19
# # #
Except this was over a 2 1/2 year period. It was NOT over a specific 5 minute period in which was recorded a PRT spike in a 1 second interval, or 20s, or 60s.
10
For reference:
In Australia, faulty BoM temperature sensors contribute to “hottest year ever”
Guest essay by Dr. Jennifer Marohasy 2017 October 19
https://wattsupwiththat.com/2017/10/19/in-australia-faulty-bom-temperature-sensors-contribute-to-hottest-year-ever/
“On a hot day, the air is warmed by turbulent streams of ground-heated air that can fluctuate by more than two degrees on a scale of seconds. So, if the Bureau simply changed from mercury thermometers to electronic sensors, it could increase the daily range of temperatures, and potentially even generate record hot days approach 50 degrees Celsius, because of the faster response time of the sensors.
Except to ensure consistency with measurements from mercury thermometers there is an international literature, and international standards, that specify how spot-readings need to be averaged – a literature and methodology being ignored by the Bureau. For example, the UK Met office takes 60 x 1-second samples each minute from its sensors and then averages these. In the US, they have decided this is too short a period, and the standard there is to average over a fixed five-minute period.
The Weather Observers Handbook 2012, for example, states that if averaging is not over a five-minute period it affects temperature extremes. An example is even provided. Dodge City, Kansas, has a long temperature record dating back to 1875. The hottest day on record stood at 43.3 degree Celsius. Then there was a heatwave in 2011, the highest reading from an electronic sensor was 43.9 degree Celsius. But when it was found this record was from readings that had only been averaged over only one minute, the new record was scratched – because when the same readings were averaged over the ASOS standard of five minutes, the maximum temperature was 43.3 degree Celsius – a tie.
In Australia, our Bureau takes not five-minute averages, nor even one-minute averages. As Ken Stewart discovered when he persisted with understanding the nature of the data he had been provided by the Bureau from Hervey Bay: the Bureau just take one-second spot-readings.”
[See Image by Jo Nova]
Also,
Example of an Artificial Temperature Spike – Image from Ken Stewart
https://i0.wp.com/wattsupwiththat.com/wp-content/uploads/2017/10/australian-temperature-spike-mboro-15-feb.jpg?w=450&ssl=1
10
It’s not a matter of picking one over the other. As Bwian said, “You are all individuals. You are all different”. BOM seems to be the bloke in the crowd – “I’m not”
That’s the moral of the story, which almost everybody misses.
UAH and RSS use multiple satellites, with new satellites coming into the mix and old ones being retired. As noted, the satellites also drift. The calculations are used to reconcile them with each other and an external reference.
Reconciling readings from different instruments is complicated, even with extended parallel running. The data from those parallel runs is important to determine the behaviour of the instrument types.
50
‘ … and you want me to pick one over the other?’
Yes, we have no other alternative. A conspiracy of silence requires an audit, to end the corruption.
50
“and have never been compared to an analog thermometer in the same location at the same time “
WRONG.. again!
UAH USA48 compares very well with the only pristine surface data in the world, USCRN.
Apart from a slightly different surface and atmosphere response during the 2015/16 El Nino, they have basically the same near-zero trend.
(trends were almost exactly the same up to 2015, now coming back together since the El Nino effect faded)
UAH is well validated against untainted surface data!
40
Peter >”The claim is that somehow the thermometers are inaccurate by a fraction of a degree, and that this inaccuracy is based on an analog system based on manual reading and recording.”
No, not the claim. The claim is the difference in sampling time – 1 Hz (1 second) for PRT which is NOT equivalent to the the convention that the average of 300 PRT samples (5 minutes) is equivalent to A/MiG.
The respective BOM tolerance limits: ±0.08 °C” for PRT and ±0.5°C for MiG can be found at #4.2.6.2 but that’s NOT the issue.
>”So you are comparing 2 systems both of which approximate the real temperature, and you want me to pick one over the other?”
No, it’s the TRANSITION from one to the other that’s critical. See Rick Will at #20.6.
Also repeating what I wrote at #4.2.6.1:
The AiG/MiG => PRT issue.
These are fundamentally different methods of temperature measurement. They do not record the same result at the same time (certainly not in the 1 second interval) therefore the timeframe in which there is agreement must be established – that’s 5 minutes (300 seconds) in the meteorology domain.
20
““temperatures are rising when compared to the climate averages.””
Actually, current temperatures are WELL BELOW the Holocene average.
Please get your facts correct, so we don’t have to be continually correcting them.
20
‘Can anyone define what the real temperature is at any location?’
https://i0.wp.com/wattsupwiththat.com/wp-content/uploads/2023/05/Chart2-1024×658-1.png?ssl=1
10
Thanks Jo for this posting. If Australian temperatures are being exaggerated then all that green stuff like shutting down our coal fires power stations may not be justified . .
140
With the infiltration by the Left into science, a part of communist Rudi Dutschke’s 1967 plan of der lange Marsch durch die Institutionen (The long march through the institutions), censorship of any and all views that don’t fit The Narrative is standard in all fields, e.g. climate and covid.
We will discuss it in the next open thread but many readers will be disappointed that Dr John Campbell has just had a video censored on YouTube and has been banned for a week (SEE https://www.youtube.com/live/f7keo_YDugQ ).
100
A link to the Rumble back-up here
https://rumble.com/DrJohnCampbell
The Andrew Bridgen one
https://chiefio.wordpress.com/2023/04/19/w-o-o-d-19-april-2023-ukraine-drags-on-us-being-trashed-dimocrat-cities-crime-spree/#comment-163914
40
As far as I can see Plibersek has never had a proper job, and only has useless degrees in (a) “journalism” and (b) politics and public policy.
And yet she has Australia’s future in her hands.
140
David, silly Tania couldn’t even attempt an answer about the level of co2 in the atmosphere.
Alan Jones asked her the question a few years ago and she had to admit she didn’t know the answer. That’s the level of donkey we have as the minister in 2023. AGAIN unbelievable but true.
And today she also BELIEVEs that we’re facing a mass extinction event.
140
Thanks to The Australian for publishing John Abbot on the same topic today, https://www.theaustralian.com.au/commentary/bom-makes-heavy-weather-over-temperature-data/news-story/6150371bb0df94614f2d7708e1d1b225
PLEASE GO OVER AND MAKE A COMMENT IN THE THREAD FOLLOWING THE ARTICLE IF YOU HAVE TIME :-).
John writes: My request, three years ago, to obtain temperature data from the Bureau of Meteorology should have been a straightforward process, but what I encountered in pursuit of that information was a determination to obstruct and obfuscate.
The recent saga – sparked by that FOI request and Graham Lloyd’s report in The Australian last month – illustrates some of the deficiencies in the system. In practice, it is quite easy for government agencies to prevent the release of documents, and entities such as the Office of the Australian Information Commissioner are often not effective in assisting the public if a government agency is determined to prevent access.
Arguably I am in a better position than most to traverse the roadblocks within the FOI system. I have qualifications in science and law, and I have published in academic journals about accessing climate information through FOI. But even with these potential advantages it has taken 3 years of persistence to obtain any records.
The saga involved a request for daily maximum and minimum temperature measurements at several sites in Australia. The request was for parallel temperature data, where measurements were taken using both the older liquid-in-glass thermometers and the more modern automated platinum resistance probes which have been introduced during the past three decades.
It is important to know the temperature measurements from the different types of equipment, if reliable continuous temperature records are to be constructed for each site so that temperature changes in recent decades can be accurately compared with earlier records extending back to the start of the industrial era.
Small differences in temperature measurement between the two types of equipment, perhaps 0.2C to 0.5C are not negligible in the context of global warming where the public is constantly being told that a rise of 1.5C above pre-industrial era will have dire consequences.
The original FOI request for parallel temperature data for Brisbane airport was made in December 2019, as well as other sites at later stages.
One of the tactics used is to allege that the documents requested do not exist. The documents requested did exist as they were referred to in BOM reports that list the sites at which parallel temperatures have been collected and the time periods. The proof is that we have finally received parallel temperature for Brisbane after more than 3 years, showing claims to the contrary were nonsense.
Another of the tactics used to prevent, or severely limit, public access to government held documents is to erect cost barriers. This was indeed the case with the BOM. The agency involved is entitled to calculate an approximate processing cost in providing the documents requested under FOI.
However, FOI legislation allows an applicant to request a fee waiver, for example on grounds of hardship or public interest regarding the information sought. The BOM rejected my fee waiver request on public interest grounds. The BOM stated that the parallel temperature data sought was only of personal interest to me, and that I stood to gain financially because I could use this information in the course of my employment. It is astonishing that the BOM could take the position that accurate quantification of atmospheric temperature changes over the past century has very little or no general public interest when the public is constantly being told that there will be drastic consequences for the planet if the threshold of 1.5C atmospheric temperature increase is exceeded.
An applicant is permitted to request a review by the Australia Information Commissioner if unsatisfied with decisions made by a government agency regarding accessing documents under FOI. In July 2020, I requested a review by the Information Commissioner on two counts – existence of the documents requested and secondly the issue of fee waiver on public interest grounds. The OAIC agreed with the BOM on the non-existence of the documents and has so far made no finding on the second count after nearly two years.
The UK Met Office has very effectively enlisted the assistance of the public in digitizing historical weather records. Recently it completed the digitization of 1.8 million sub-daily and daily weather observations which were recorded in the UK Met Office Daily Weather Reports during the 1900–1910 period. The data were rescued from scanned images of the original documents by 2,148 volunteer citizen scientists. The BOM has historical parallel temperature data in written pages that require digitization and analysis. If the BOM is incapable of achieving this internally it should encourage the participation of citizens rather than obstruction. [ends]
And I love the title they have given it: BoM makes heavy weather over temperature data. :-).
380
Excellent post Jennifer. You have explained very clearly what it is you are trying to achieve.
No sensible person could fault your reasoning. I just wish our politicians would take more notice . .
190
Small differences in temperature measurement between the two types of equipment, perhaps 0.2C to 0.5C are not negligible in the context of global warming where the public is constantly being told that a rise of 1.5C above pre-industrial era will have dire consequences.
Explain how the asserted small difference (is it higher or lower, is it consistent, is it seen in all sites) has an impact on climate forecasts.
For instance if your assertion is correct, then you would expect to see a change of 0.2-.0.5 degrees in the daily records right after the new gear was introduced, but the available data does not confirm this.
as to climate, and the world – that 1.5 degree figure is for the world, using all the measurements, not just those in Australia. They all say the same thing, it is getting hotter.
11
No Peter. If the changes happen in a mild year, No, that’ll swamp the signal. We may not see much difference until extremes happen. But actually, we don’t know do we, and why is that, because the BOM withholds the data that shows how fantastic these thermometers are.
The BOM won’t show us Peter. Why do you suppose?
20
Your grasp of mathematics and what is actually going on, is extremely limited, to say the least.
These changes are being fed into “the story” that the world is heating up, when in reality, it is still in a cooler period of the Holocene.
These “stories” are being used to frighten the weak minded and ill-educated (like you) and to push crazy anti-CO2 agendas that will destroy western society as we know it.
“that 1.5 degree figure is for the world,”
NO, it is for heavily urban affected sites, that are totally unfit for identifying global climate change.
And the 1.5C “value” was squeezed out of someone’s nether regions.. it is fantasy-based nonsense.
“They all say the same thing, it is getting hotter.”
Only at El Ninos.. Ocean warming events which are totally unrelated to CO2.
And the current temperature is well below the Holocene average… the world is still in a cool spell.
That is what reliable data tells us.
The surface data is totally unfit for “climate” purposes… but great for propaganda for the weak-minded.
10
“it is getting hotter.”
Please show us where Australia has got “warmer” in the last 23 years…
Hint… IT HASN’T
https://ibb.co/hLRPMRS
Seems you are misinformed, as usual !
10
They fear the data will get posted on tiktok 🙂
60
Note that TikTok, owned by the Chicomms, by far the biggest emitters of carbon dioxide in the world, is now banning any criticism of the anthropogenic global warming fraud narrative.
The BoM and the Australian Government in general will be most pleased.
50
It’s that nasty “C” word again. Forget the Anthropocene, we’re living in the age of Consensus, where science becomes reduced to decree by authority and where practicing real science is banned, along with the real data.
80
Yes, consensus:
30
Will TikTok also censor those that insist that men are women and women are men?
I think not.
It’s all about the agenda.
30
We should all understand that the requested, complete digital data should be available immediately, if they’re a professional scientific group.
So what’s the problem if the data is available? This should take just a few minutes of their time.
If they can’t manage to complete this very simple task they should be defunded ASAP.
80
It shouldn’t need to be requested.
Something as important and potentially as civilisation-changing as the validity of the BoM’s temperature record which we are being asked to destroy our economy for, should be open to public, scientific scrutiny. It should be in a clearly designated place on their website.
If they are confident in their methods, what have they got to hide?
60
Now, now David. We all know that it takes time to bake a cake. And rebaking all the old cakes requires unmaking them all first.
20
Never forget that the Mann hockey stick graph was once the most important proof of anthropogenic global warming and caused Mann to sue Tim Ball and Mark Styne.
Now Steve McIntyre and another data analyst have looked through the rear vision mirror and found that the entire process is very doubtful indeed.
https://wattsupwiththat.com/2023/05/01/mcintyre-reverse-engineering-a-hockey-stick-shows-bogus-methodology/
60
Like the BoM, Mann refused to disclose his raw data or methodology in fabricating the “hockey stick”.
Apart from Neville’s reference above, also see from 2005:
SEE LINK FOR REST
The Hockey Stick lie is still being followed to this day. It is probably the most influential lie of the entire anthropogenic global warming fraud.
80
That’s dissecting one of the PAGES papers, rather than one of Michael Mann’s.
10
Trees respond to increased atmospheric CO2 far more than to slight changes in temperature.
Mickey’s graph clearly shows that trees were struggling from a deficit of CO2 for hundreds of years …
… then once the slight warming out of the LIA caused CO2 to be released from the oceans, the trees started to prosper.
Human released CO2 also gave the Carbon Cycle, that supports all life on Earth, a much-needed boost.
20
Any real scientist knows that before you measure anything you must assess the situation.
Some world temperature perspective.
In the last 130,000 years or so the world has gone through temperature variations and physical environmental changes that would astound the average person.
Way back in the last interglacial the physical environment was similar to now but perhaps a little warmer.
Then Orbital Mechanics bit hard and over the next sixty or seventy thousand years the temperature fell and kept falling. At the peak of this “chilling out” the area at New York, as an example, was under a continuous ice field that was almost a mile deep. The oceans had lost 120 to 125 metres of depth which was trapped in the massive world icefields.
I could go on about the big melt and ocean restoration that began about 25,000 years ago but the main point is that the world has been through temperature hell that makes the supposed BOM variations pushed at us basically non threatening even if they were true.
There are criteria for measurement in science that the BOM has, ignored, bypassed and misrepresented as being valid.
e.g. Mercury thermometer readings cannot be mixed with or compared with electronic measuring devices.
World atmosphere is a Chaotic System and this must be front and foremost when presenting temperature analyses.
100
Apart from orbital periodic changes which warmists seem unfamiliar with, they totally deny variations in solar output as having anything to do with climactic variations, even though the sun is a variable star.
70
The models include those things.
03
WRONG, as usual..
… the models specifically discount solar as having any affect.
20
Sorry Adrian – your reply means you agree with me that they include them and find that they don’t cause the warming. Show me a well cited published model that does not include solar input and orbit affects. Just one will do.
01
Pay attention.. They clearly discount solar in all their predictions.
They say it has no effect. Blame all the warming on CO2.
Haven’t you read any of the IPCC literature ! ?
Perhaps it is time to educate yourself, instead of making comments based on total ignorance of what you are discussing.
10
So. My challenge was too hard because the answer is there are none.
00
RE: Mercury thermometer readings cannot be mixed with or compared with electronic measuring devices.
Actually, they can be compared. But. Only if the digital measurements are integrated over the same dynamic response characteristic of an “in glass” thermometer.
The dynamic response of a glass thermometer is readily modeled mathematically, and can be approximated digitally with the proper filters.
If the sample window for a glass thermometer response is 60 seconds, then the digital samples ought also be averaged over the same 60 second window with a sampling significance of 1 per measurement. Not some “peak seeking” bias. Otherwise it is comparing apples and oranges.
It isn’t that it cannot be done, it is simply that it has not been done. Mostly because of politics and ideology.
60
From one Lance to another, i gave you a thumbs up for that but will now proceed to argue with much of it including the question. The BoM obviously asked themselves the same wrong question and came up the same wrong answer. They claim to then have matched the modeled dynamic response of the mercury self recording thermometer.
The question is wrong because there were two manually read self recording thermometers. The two different types have two different exponential “integration” rates. If they have matched the dynamic response of the mercury maximum thermometer then they MUST be getting the alcohol minimums wrong. If they are not getting the minimums wrong how can they be getting the maximums right? The question should be why are there not two differently matched resistance thermometers being independently logged?
But things get harder than that. The response times of the thermometers have nothing whatsoever to do with any form of 60 second window. While a glass thermometer cannot measure time, it’s response can be longer or shorter than 60 seconds and changes with wind speed. So any “window” would also need to change duration with wind speed, a third dimension. That is the wind speed inside the Stevenson screen not at the anemometer. So an unknown third dimension. The response time of resistance probe also changes with wind speed but differently because it has different aerodynamics. The response time of both types of thermometer change with humidity. No doubt the humidity and wind speed effects interact non linearly with each other, requiring a sort of nonlinearly reacting 4 dimensional time window. Response times are measured in multiples of time constant which is 63.2 % of a step change. The exponential curve takes about 5 time constants to get to 99%. But the two thermometers time constants are really an approximation of a single thermal path of warming or cooling. In reality they interact with the Stevenson screens much longer time constant that can be cooling while they are warming, adding another i don’t know number of dimensions to the problem. The problem now being a multipole or multi order exponential decay reacting to overlapping simultaneous multiple effects. Plus multiple random noise sources.
Simple really.
20
Siliggy >”But the two thermometers time constants are really an approximation of a single thermal path of warming or cooling.”
I’ve seen screeds of guidance re PRTs and the one thing that stands out is to achieve “linearity” i.e. to approximate the thermal path as you put it.
I decided to avoid those technicalities in favour of addressing what I see as the crux (BOMs 1s sampling).
But good to see your discussion (ticked)
20
There is a small nonlinearty and several different standards of correction for it. It is only about 1/2 a degree at worst if uncorrected, but they do correct for that. What i meant about thermal paths was ways heat can travel into and out of the thermometer. For example it can arrive as energy from sunlight hitting the steel pole underneath the Stevenson screen. Then waft up through the floor boards past the probe tip. It can then leave by warming the rear body of the probe and conduct its way out via the mounting bracket to the screen wood, from where it can be washed off by rain. That is one path but there are obviously more.
00
I went to check something about 10 years ago. I wanted to see the SD of the difference between the average of min and max readings and that of averaged half hour readings. The average temperature is physically meaningless when it’s not the temperature of the same large pocket of air.
Two things that I noticed were ;
the half hour readings were not exactly every half hour. The times were a bit all over the shop.
The other was how close the average of the daily readings was to the average of the official min and max readings, but while the min was the same as the lowest reading, the max would be up to two degrees higher than the highest half hour reading. I only looked at a few days at a couple of sites, but that is something that needs to be investigated.
80
Do you think anyone from the BoM lurks here?
I suspect they do.
30
This has parallels with vaccine hesitancy. The BOM and all the other climatista around the world are trying to prevent “climate hesitancy”. Because, just like COVID policies you cant have the ordinary people not believing in man made climate change. So, this is no different to Pfizer hiding research documents for 70 years, so our BOM will likely not disclose any of their methods unless compelled, which is highly unlikely. Forget about the politicians, they’re all on the same ticket and only a few appear to be scientifically literate anyway. The present opposition (which were the government up until a year ago) are not likely to criticise because they were in power for the last 10 years. It’s up to independent people like JM and JN to actually broadcast this information, because although some in the MSM might pick up this story they still tend to stick to the narrative.
70
OT – just watched Jo on Mark Steyn’s show. Great interview with some great science communication with Jo. “Sciency” enough without boring the pants off most viewers. 19 000 underwater seamount volcanoes you say Jo, WTF, why is this not widely reported in the MSM?
90
Hi Ross, how do I find it?
20
See Jo’s Wednesday blog. I found it on Twitter because I follow Mark Steyn
00
” why is this not widely reported in the MSM? ”
It’s all about the narrative.
00
If the BoM are confident in their methods, what have they got to hide?
Obviously they know their methods are flawed, even worse, they are deliberately lying.
70
It’s probably a matter of national security, like the Pfizer CONtract…
30
A bit off topic, but could anyone tell me why it is that the 2 best blogs on the net are run by Australian ladies, but the moment a Australian lady gets into parliament she turns into a bleeding idiot, if she wasn’t one before election?
31
Possibly because they are different people? You seem to be suggesting that these parliamentary ladies (sic) were once just like the bloggers and, in fact, as are all Australian women… I mean ladies.
02
I hope that’s more rhetorical than not.😇
Look closely at the person, life, interests, politics etc before getting elected and you have your answer.
Lust for power and money, ineptness in any real job, deep seated prejudices and biases, and more all get exposed once elected don’t they…
40
There’s never a whistleblower when you need one…
20
More snow in the mountains of California and the Great Lakes.
https://i.ibb.co/JrFWZ7s/mimictpw-namer-latest.gif
20
We know, they know that we know, we know that they know that we know, yet they continue to play these silly games.
10
The temperature anomalies are influenced by stationary lows and highs, which are formed as a result of blocking circulation in the tropopause, over which humans have no influence, and the weakened solar activity is suspect.
Let’s take a look at the winter in Europe 1708-1709. The anomaly in Europe is -8 degrees C, while in Iceland the positive anomaly is +3 C. You can clearly see a stationary low over Iceland with warmer air from the south.
https://i.ibb.co/gJvCr7W/800px-Winter1709.png
https://earth.nullschool.net/#2023/05/02/0600Z/wind/isobaric/250hPa/orthographic=-134.57,-28.82,281
10
A small amount of warm water has accumulated below the surface of the Pacific. Does this indicate an El Niño?
https://www.longpaddock.qld.gov.au/soi/
http://www.bom.gov.au/cgi-bin/oceanography/wrap_ocean_analysis.pl?id=IDYOC006&year=2023&month=05
00