By Jo Nova
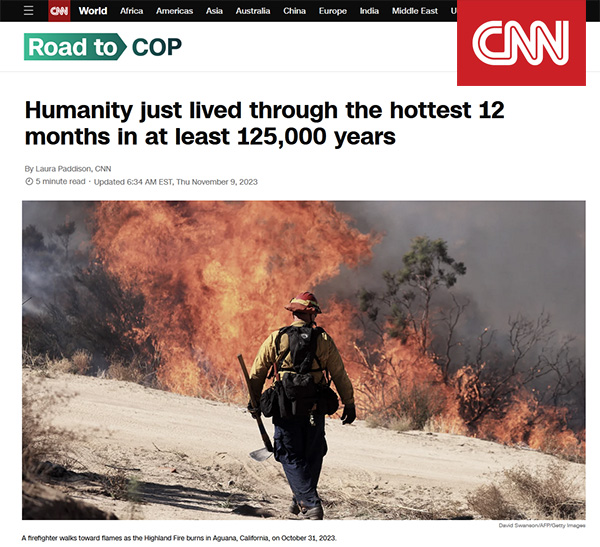
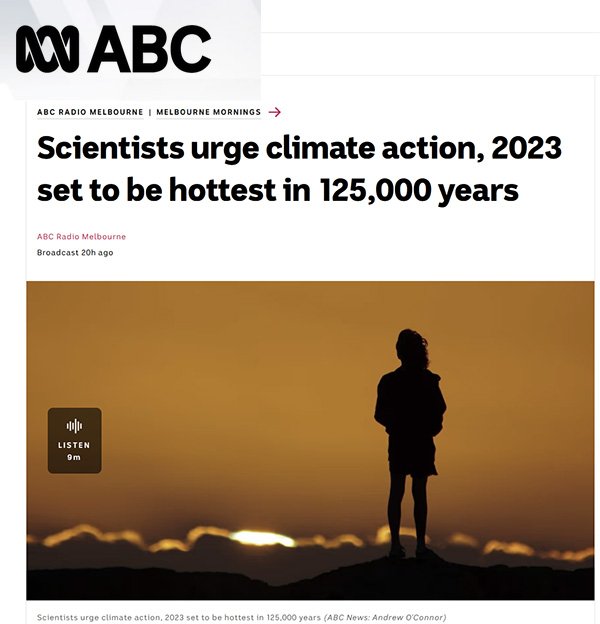
Hottest 12 months in 125,000 say EU Soothsayer scientists
UPDATE: This graph shows the ice-core data up until 1855.
Think for a minute about how stupid this claim is that no single year, not one, in the last 125,000 years was warmer than the last 12 months. Cavemen are rolling in their graves.
It’s “virtually certain” said two journalists at Reuters. It was broken by 0.4 degrees!
Homo Sapiens have had satellite data for 44 years, which only leaves 124,956 years of extrapolation to guess at the rest. Not one journalist at the ABC, Sydney Morning Herald, CNN, or anywhere, asked the “scientists” — how would you know? Do tell us, professor, what exactly was the temperature from November 6,789 BC to October 6,788? And to a tenth of a degree, and globally. I heard it was hot?
Try to imagine what kind of miraculous science makes these headlines make sense? Did the EU team find neolithic newspapers hidden in caves in Turkey? Could they reconstruct temperatures from 10,000 BC to 1978 to a tenth of a degree Celsius. And not just Turkish temperatures but ones in Timbuktu and Peru too? Those goat herders needed a satellite program. Perhaps clay pots powered with goat dung?
It’s as if thousands of hotter Holocene years never existed
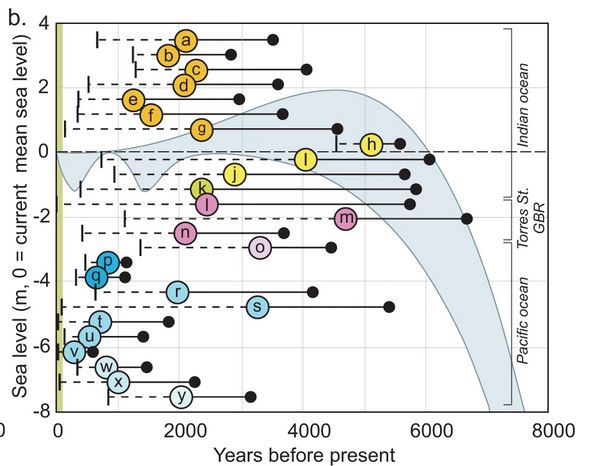
Studies all around the world show sea levels were as much as 1 – 2 meters higher 6,000 years ago, and have been falling for thousands of years. For example, studies on mangroves in Brazil show sea levels were about 2.7 meters higher in the mid-Holocene, and mangroves grew 34 kilometers further inland. (Fontes et al 2017). How does that happen if the world was cooler then?
NoTricksZone lists sea level studies all over the world and CO2 Science lists other proxies. 6,000 years ago the world was so much warmer, the Sahara was lush green and wet. Even the sacred, revered ice cores from both Greenland and Antarctica show it was warmer. The deepest oceans around Indonesia were 2 degrees warmer 10,000 years ago. And 6,000 boreholes drilled around the world agree.
Glaciers in Europe were so much smaller, that as the world cooled and they grew, they swallowed up thousands of pieces of evidence. In the recent warming some 4,000 new tools, bridles, pieces of leather have melted out of Norwegian glaciers alone.
Many Pacific Island have only existed for three or four thousand years — emerging into the sunshine as sea levels fell from the Holocene peak.
This pattern of falling sea levels all over the world doesn’t fit the climate models. Instead of just admitting the models are wrong, researchers call their failure the “Holocene Temperature Conundrum”. We’re going to have to fight for the Holocene — the modelers want to erase it to solve the conundrum.
Shock news for alarmists, poor dears,
And sure to cause climate stress tears,
As 2023 beat,
All records of heat,
Kept for 125,000 years.
–Ruairi
REFERENCES
Alley, R. B. (2000) The Younger Dryas cold interval as viewed from central Greenland. Quat. Sci. Rev. 19, 213-226
Fontes et al (2017) The Impacts of the Middle Holocene High Sea-Level Stand and Climatic Changes on Mangroves of the Jucuruçu River, Southern Bahia – Northeastern Brazil, Radiocarbon , Volume 59 , Issue 1 , February 2017 , pp. 215 – 230. DOI: https://doi.org/10.1017/RDC.2017.6
Huang, S. P., H. N. Pollack, and P.-Y. Shen (2008), A late Quaternary climate reconstruction based on borehole heat flux data, borehole temperature data, and the instrumental record, Geophys. Res. Lett., 35, L13703, doi:10.1029/2008GL034187 [PDF] Long blog discussion on boreholes.
Kench, P.S., Liang, C., Ford, M.R. et al. (2023) Reef islands have continually adjusted to environmental change over the past two millennia. Nat Commun 14, 508 doi.org/10.1038/s41467-023-36171-2
Lewis, S.E., et al., Post-glacial sea-level changes around the Australian margin: a review, Quaternary Science Reviews (2012), http://dx.doi.org/10.1016/j.quascirev.2012.09.006 [abstract]
Hamish McGowan,Samuel Marx, Patrick Moss, Andrew Hammond (2012): Evidence of ENSO mega-drought triggered collapse of prehistory Aboriginal society in northwest Australia, Geophysical Research Letters, Vol 39, Issue 22. DOI: 10.1029/2012GL053916 [Abstract]
Rehn, E. et al (2021) A late-Holocene multiproxy fire record from a tropical savanna, eastern Arnhem Land, Northern Territory, Australia [PDF]
Rosenthal, Y., Braddock K. Linsley, Delia W. Oppo (2013) Pacific Ocean Heat Content During the Past 10,000 Years, Science 1 November,Vol. 342 no. 6158 pp. 617-621 DOI: 10.1126/science.1240837 [Sciencemag.org ]
Yacoub et al., (2023), The African Holocene Humid Period in the Tibesti mountains (central Sahara, Chad): Climate reconstruction inferred from fossil diatoms and their oxygen isotope composition
Kuper and Kropelin, (2006): Climate-controlled holocene occupation in the Sahara: motor of africa’s evolution. Science 313, 803e807. https://doi.org/10.1126/ science.1130989


ALL part of the WEF and UN
EVIL PLAN.
Long past time Australia de-clutched itself
from ALL things associated with the UN.
Long past time we shed ourselves of the coetaneous politicians
who follow this mantra.
GOD, please help Australians
641
That means for 124,999 years the temperature was colder than now. The Earth is cooling.
291
Our own human history has shown MASSIVE AMOUNTS OF WATER LOSS in our environment.
Sea-level rise is another BOGUS scientific term to scare the majority of our politicians policies on making society more idiots to actually using their brains in problem solving.
91
Iojo. Please don’t panic. Hardly anyone believes in sea-levels rising…and practically no-one over ten years of age believes in global whatever due to CO2.
Feel free to check out home prices on the coast in Oz…especially direct waterfront….to maybe be stunned that DEMAND is far out-stripping supply. Whenever one of those charities running Lotteries, Raffles and Art Unions puts up a $5 Million Home…guess what…it’s ALWAYS waterfront!
Essentially: so what that some nutters are spreading BS? Practically no-one takes it for real!
Now, as well as there being no evidence whatsoever that anyone is worried by imminent inundation, my morning strolls through the ‘burbs also tell me there are about 3 fossil-fuel burning vehicles per home. I also see “record passenger numbers’ at the airports, and on cruise ships departing Oz. And very very serious “unrest” when supply chains (ie fossil-fuel powered ships and trucks) are inter-rupted. this latter is kinda weird since the masses are alleged to accept that burning fossil fuels is a bad thing. They don’t.
BTW: Do I have to drag out the CSIRO Ski Club Annual Report yet again? “No adverse developments in club operations expected in the foreseeable future” means “No adverse events expected”!
110
There is not such thing as water loss it just changes from place to place the same amount of water is here now as when creation started it is called the water cycle sometimes it is stored as ice sometimes in cloud sometimes in the sea but the actual amount never varies just think about it for a little while and calm down
00
And has been for some thousand years, as per previous interglacials. Pattern
Rapid warming
Slow cooling, with warm periods interspersed
Each warm period cooler than the last
Ice age
91
It’s about time the great unwashed ran a sally at the educational institutions and purged these arrogant perpetrators promoting these fabricated climate fantasies🤬🤬🤬
11
What a laugh – I might as well throw away my Geology degree where I studied the Quaternary and Palaeoclimates – Have a look at the sediments of the Yarra River in Melbourne and the Holocene is written all over them. There really is precious little intelligence down here upon the Earth!
710
“There really is precious little intelligence down here upon the Earth!”
And Scotty is not there to beam yo up!
80
That’s interesting ,
I may take a stroll along the lower Yarra river today.
What should I look for?
130
If this is the hottest in 125,000 years then I’m all in favour of Global Warming!
What a bunch of wanker scientists. Leave the scaring of the population to Hamas & their breed of fellow mid east loonies. All the “scientists” are doing are providing more derision &
comedic ammunition for the belittling of a once respected & useful profession!
542
Sadly, they get well funded to spout this bollocks and so, many ditch their principles to take the cash.
191
‘Leave the scaring of the population to Hamas and their breed . .’
Are you really serious ?! What the F*ck has global warming got to do with Hamas . .
58
Geoff,
Do you always get the “ wrong end of the stick “ ! Not a good look!
111
Ask Greta she said it does LOL
00
Peter C – you would need a drill to look into the deep sediments that filled the old course of the Yarra up to 100 metres below present sea level – the last of which – the Fishermens Bend Silt that were baked and eroded a second time when sea level fell again during the last glaciation period. Since then as Sea Level rose to its current level the old channels filled with the soft Coode Island silts that have never been above sea level and now underlie much of the Yarra Delta.
Actually, if you go to WA you can sea the raised beaches along the coast that are now well above sea level from a time when sea level was much higher than now! At least they are visible from the surface.
40
As I have said before, warmists are staticists, for lack of a better word. They fundamentally don’t believe in natural variation of the climate. In the past, within recorded history, there have been periods of both wonderful warmth and miserable cold.
Civilisations have thrived during the naturally warm periods of the Minoan, Egyptian, Roman and Medieval eras.
Plus, we are coming to the very end of a rare interglacial. As the world cools, it will be impossible for civilisation to survive without coal, gas and nuclear power stations (and real hydro where possible, not SH2).
The idea that the earth and universe is static is a very primitive one and articulated by Aristotle in “In the Heavens” 350BCE.
It is only in the last 100 years or so that the ideas of Alfred Wegener (1880-1930), a real climatologist, geologist, geophysicist, meteorologist and polar researcher came to be accepted that the earth is not static. Among other ideas he conceived of continental drift which led to plate tectonics.
However, as early as 1840 Louis Agassiz (1807-1873) hypothesised that much of North America was once buried under glacial ice up to 3km deep and that climate must change.
Milutin Milanković (1879-1958) also discovered natural cycles in the climate.
Warmists have to do a lot of catching up with modern thinking.
601
“It Is Difficult to Get a Man to Understand Something When His Salary Depends Upon His Not Understanding It”.
Sums up everyone and everything that has the word “Climate” in the title or job description
800
Incidentally, that quote is from Upton Sinclair, 1934.
341
Sinclair was a devious commo but also an astute judge of human nature, and compelling writer … dangerous combination all things considered.
170
Maybe you should ask Jo where she gets her blog funding from. Sea level rise lags temperature by thousands of years.
Let’s see evidence of a time period within the last 125,000 years when the global temperature actually was warmer than today. You won’t fond it in the paleo-climatic records. https://xkcd.com/1732/
441
Sorry, the Roman and Medieval warm periods are missing from your little cartoon.
300
There there, there is even a pointer to the MWP. It was not a globally synchronous event. Randall Munroe is very scientifically literate and he always researches his stuff. It really can be Difficult to Get a Man (or woman) to Understand Something When His Salary Depends Upon His Not Understanding It.
229
What a misleading claim since that doesn’t say anything about the well known MWP in the first place which was distinctly warmer than NOW in many areas of North America.
180
‘ … not a globally synchronous event.’
The hemispheres are often out of sync and its fair to say that the LIA came to the Southern Hemisphere later and ended around 1900.
Not to sure what happened with the MWP, RWP etc. I’ll get back to you on that, New Zealand glaciers should give us some indication.
20
On the evidence it appears the MWP was universal and pretty much in sync.
https://agupubs.onlinelibrary.wiley.com/doi/full/10.1029/2001GL014580
The LIA began in the NH and the only effect down south was a drop in sea level (1300 AD), around the time of the Renaissance temperatures fell sharply in NZ.
60
El Gordo
There is ample evidence that the MWP was across the globe from China, Greenland, South Africa etc etc. Simon is following the usual Leftist pattern where the ordained Leftist theory, which has no connection with reality, is trotted out to support their ideologically based claims.
And he also ignores the reconstruction of Holocene temperatures which show temperatures, across the globe, far higher than now in the last 10 000 years. For the Leftists, the old saying “don’t let the facts get in the way of a good story” rings very true.
70
Its an academic exercise and clearly climate change is not Simon’s area of expertise, which is a pity.
30
You posted a cartoon, Simon. The intended audience for that is the useless idiots, not the thinking community.
292
…thumps forehead with palm of hand.
61
BTW, Simon, Jo doesn’t get finding from Big anyone, not like warmists get from Big Green and Big Government and some of the world’s most wicked people.
Now, look at:
See https://www.ancientportsantiques.com/wp-content/uploads/2019/06/CCCC-Vinther.png
Based on data from:
VINTHER, B., et al., 2009, “Holocene thinning of the Greenland ice sheet”, Nature, volume 461, (p 385-388).
Also see:
https://www.ancientportsantiques.com/ancient-climate/temperature/
The main Holocene warm and cold periods are listed very schematically as follows[2]:
Around 6200 BC: cold peak: ‘8200 BP Cold Period’
Around 6000 BC: warm peak (‘Holocene Thermal Maximum’)
Around 4900 BC: warm peak
Around 4500 BC: warm peak
Around 3800 BC: warm peak
Around 3300 BC: warm peak (initiation of Harappa-Indus Valley civilisation)
Around 3000 BC: warm peak (initiation of Egyptian and Sumerian civilisations)
Around 2900 BC: cold peak (‘Piora Cold Period’)
Around 2300 BC: cold peak
Around 2200 BC: warm peak with severe drought (initiation of Minoan civilisation, start of First Intermediate Period in Egypt)
Around 1900 BC: cold peak (‘Early Neoglacial Anomaly’, ENA) (migration of the Harappa-Indus Valley civilisation)
Around 1800 BC: warm peak (start of ‘Second Intermediate Period’ in Egypt)
Around 1600 BC: warm peak (initiation of Mycenaean and Hittite civilisations, and of New Kingdom in Egypt)
Around 1200 BC: warm peak (Sea Peoples raiding the eastern Med, end of Bronze Age)[3]
Around 1100 BC: cold peak, possibly triggered by the Hekla 3 volcano eruption (Iceland) that obscured the northern hemisphere
Around 1000 BC: warm peak (start of ‘Third Intermediate Period’ in Egypt)
Around 700 BC: ‘Iron Age Cold Period’
Around 500 BC: warm peak (initiation of Greek civilisation during a period of rising temperatures starting in 700 BC)
Around 200 BC: cold peak
Around 0 AD: Roman Warm Period (initiation of Roman civilisation during a period of rising temperatures starting in 200 BC)
100-200 AD: cold period: decline of Roman Empire
Around 400 AD: warm peak: Byzantine civilisation
400-900 AD: ‘Late Antique Little Ice Age’ or ‘Late Neoglacial Anomaly’, LNA, possibly triggered by a 536 AD volcano eruption that obscured the northern hemisphere (Migration Period, Arab Conquest, European Dark Age)
900 -1350 AD: ‘Medieval Warm Period’ (initiation of European Renaissance)
1350-1850 AD: ‘Little Ice Age’.
281
“BTW, Simon, Jo doesn’t get finding from Big anyone, not like warmists get from Big Green and Big Government and some of the world’s most wicked people.”
Now Simon fair’s fair – who subsidises your commentary?
171
Strange. That graph you refer to bears little resemblance to the one in Simon’s cartoon. Just in the past 6000 years the temperature went from a high of 2.5 degrees to a low of approximately -1.4 degrees. If Guetteres is to be believed we will boil at 2 degrees above -1.4 or 0.6 degrees. No wonder the ancients were melting copper and iron. Seems we could add another 1.9 degrees to the current temperature and still flourish. It should be no surprise that the elites don’t want history to be taught and to keep their non-scientists producing BS.
171
That’s because it’s a misrepresentation: https://www.carbonbrief.org/factcheck-what-greenland-ice-cores-say-about-past-and-present-climate-change/
013
The authors responded to that fake “fact check” (sic):
40
Simon, I normally don’t respond to [Snip]AD but today I’ll make an exception…
101
..bangs head on desk.
60
Simon we could use sea level as a proxy, it was higher during the Holocene Thermal Max, so obviously temperatures were warmer than now.
This hottest year evah is an anomaly caused by a volcanic eruption, Hunga Tonga-Hunga. The effect may hang around for a couple of years, which should give you plenty of time to get a grip on the science.
191
I see that you didn’t address her post at all thus you failed before you started.
The three papers used for this bogus cartoon chart has been long discredited thus worthless.
Marcott himself discredited the big red uptick on his chart (His thesis chart does NOT have it) which is statistically invalid anyway since the data points are not even close to the proxy data points thus can’t be made to line up.
Shakun didn’t post the entire CO2 data into his paper (He stopped just before CO2 and temperature trends deviated from each other which would have destroyed his paper) and used so many proxies that doesn’t line up with each other enough to make a valid proxy chart anyway.
The GISP2 chart shows a very different chart that makes clear each succeeding Warm period peak is lower than the previous one.
LINK
110
Having lived on the site of a Roman camp on the North Wales coast I can attest to the severe weather for much of the year (~1970). I had the advantages of a slate roof, glass windows and central heating. Maybe the 20ieth Legion were super humans.
00
Last month was supposed to be the hottest October evaaahhh but we had the heater going many times and the aircon once , the pool usually gets use in mid to late October but still too cold .
Yesterday was the first day we needed both air conditioners running , I think when the scientists start crying wolf about the climate heating up it just means summer is finally here .
521
I also had heating going much of the time in Melbournistan and didn’t use cooling once.
261
Interesting timing from CNN as the northern hemisphere heads into winter.
220
“It’s “virtually certain” ”
Obviously..
As they live in a virtual world. However in the real world things are very different.
401
And we’ve hust had hard evidence tha Canberra is part of that virtual world.
And just a well I’m not a betting man as I’d have taken odds that the pairing there was CNN and PIK/Rahmstorf
60
From an arm-chair it is easy to make academic claims which fail to stack up in the real world but I’m certain Irish monk, St Brendan, sailed a wood and leather boat to Newfoundland via Iceland in the 6th C. It’s a savage trip in to-day’s climate. Tim Severin built a replica boat and over two summer seasons sailed the same course as St Brendan logged. I can recommend Severin’s, “The Brendan Voyage” (McGraw Hill Co). I have no doubt that the Irish regularly visited the Hebrides, Shetlands, Faroes and Iceland and most likely reach North America on occasions but having sailed around the Irish Sea myself during a few summer holidays, I very much doubt St Brendan experienced 1970s weather. His log describes mild weather with gentle winds but also an occasional mostly melted iceberg in the Labrador Current which was entirely alien to his sea-faring experiences.
We need to call out our MSM for spouting utter drivel more often.
00
Talk about misinformation!
And the mob believes it through lack of education. I’m sure a 4 day school week will fix it all.
310
Yes, maybe we should encourage the proposed “missinformation” bill……
…then at least we could legally challenge the media repeating this type of crap.
240
The problem being that is such bills usually make exceptions for MSM. The whole point of such is to silence critics and shut down debate, while allowing the indoctrination narrative to continue unabated.
90
Ironically if the misinformation bill passes,ACMA will decide to allow such ludicrous hottest year ever claims and disallow all the commentary on the Jonova blog.
80
For some reason … Global warming inspired sea level rise is an existential threat to the Torres Strait islands and Tuvalu, but cannot be distinguished from the background noise on the coast of NSW or near Hobart … despite NSW and Hobart being prime candidates to fulfill all the IPCC’s climate catastrophisms.
Meanwhile, much further south, the impacts of climate change are suggested to be a 5 sigma event (a one in 7.5 million event) – whilst Antarctica itself continues it’s long cooling.
It is almost as if everything is being thrown at the wall, ALL the time, just to see if something may stick
462
You obviously haven’t noticed that sea levels rise immediately upon the mention of a Labor PM bearing Australian tax $$$ visiting a Pacific island. The rise is generally proportional to the member of $$$ he bears..
The rise in levels must be the highest in history as I believe he’s bearing in the region of $2 billion.
What’ll he do if the population of the Moreton Bay islands start complaining about rising sea levels. I know! Nothing for you lot, just Australian voters!!!
361
Now that China is on the ropes, pummelled by the spectre of economic collapse, there is little to fear from Beijing’s largesse going forward.
112
How many of these “Pacific Island Nations are composed of Atolls?
Atolls are basically coral structures built in the upper rim of oceanic volcanoes. For this to occur, the coral polyps can only successfully colonize a “rim’ of an inert / dormant volcano the out-gassing of your basic volcano is NOT conducive to life support for any but the most bizarre microbial critters. For an atoll to emerge far enough out of the water for trees and birds to become established, either the underlying “substrate” / old volcano, was uplifted, OR the sea-level FELL. OR BOTH
The catch is that most crater / caldera rims are not nice solid granite or basalt structures but mostly composed of “volcanic ash” / pumice.Take a walk up to the crater of Vesuvius to see this feature in 3D. (And “smellivision”)
Last time I looked, actual oceans are made of water. This stuff MOVES, sometimes at surprising speed. Even slight motion in the ocean will steadily “wash” the stacked ash “cinder cone” . Coral can ONLY settle and propagate in a relatively narrow band of water temperature and turbidity. The trick to atoll-forming is for enough polyps to latch onto the cinder cone and SURVIVE long enough to start the whole “concretion” thing. All the while, the ocean is steadily sluicing away the cinder cone. Thus, the busy little polyps have to build UP at least as fast as the cone is subsiding.. That ocean levels relative to “land height” have changed over time is made starkly evident bu a dive on a serious reef, Like the enormous one on our doorstep. Strap on SCUBA gear and step off the fringing reef in any of several islands.you can descend STRAIGHT DOWN to below 60 feet (18 Metres for you younger folk, ten Fathoms for the herd-core salties.) At about 30 feet, the reef wall is a LOT less “colourful, for the simple reason that the available light at that depth is barely enough to keep the hardiest polyps alive. At 60 feet, the coral is decidedly “dull, even on the brightest day or under a good dive lamp..
SO: did the “land” sink at a rate with which the polyps could keep up? Or, did the ocean rise at a similarly suitable speed, or was thera a “combination of vertical movements And also bear in mind that when the corals FIRST started colonizing the piece of ocean floor, the Australasian plate was a LONG way further SOUTH than it is today. Inquiring minds want to know, just because……..
Final catch: At what point does the accumulated mass of coral press hard enough to start pushing the ‘inert” cinder-cone substrate DOWN. While there are nutrients in the water, the coral will keep building.Then, there is the FACT that reefs built on cinder cones are built in a geologically active zone. IF the plate on which they reside is slowly sliding sideways, it WILL eventually travel CLEAR of the “hot-spot” that formed said volcano. This plate movement is NOT alwayd purely lateral. Folding, faulting, subduction and uplift come into play
As for other reefs: What happened to them in the Ice Ages, when the “tife went out”? 24 hours out of the water and coral DIES.
140
PM Elbo is ripe for the plucking, Tuvalu and Kiribati play ol’ Elbo like an old violin, to tune of billions of $$$$$$$$$.
Funny how the ocean is rising there and nowhere else.
71
2023 could very well set the record high temperature for the satellite era. The peak solar intensity is moving northward and, with the high proportion of land in the NH, we should expect to see average global temperature rising.
Average temperature will continue to trend up for hundreds of years until the snowfall overtakes the snow melt. There will be new snowfall records set through the boreal winter for centuries to come. The lates in Anchorage:
https://uk.news.yahoo.com/dogs-trek-record-breaking-snow-211456226.html
Greenland plateau in January has the fastest rising monthly temperature. Trending up at 9C/century. But that just means there has to be more snowfall bringing heat from the oceans because there is no sun in January. Consistent with the increased snowfall, Greenland is gaining elevation at 17mm per year. No climate model predicted this.
Cooling of the land during glaciation is simply a result of the atmospheric lapse rate as the difference in the average elevation of land increases above sea level. Also the top of ice mountains are never going to get much warmer than 0C. The ocean temperature does not cool until the ice shelves start calving at a rate sufficient to overtake solar input.
Anyone wanting to understand climate needs to understand how Earth’s orbit changes taking care to really understand what precession means.
300
NH snow cover
160
Yep, you cannot have warmer ocean surface in September and less snow across the NH in November.
At some point in time, the modellers will get to understand that higher ocean surface temperature means more snow. Then they may come to realise that, at some point, the snowfall will overtake the snow melt as now being observed on Greenland with gains in elevation and permanent ice coverage. They are then not too far from realising that the ice cometh.
310
More well polished excrement from the MSM. They don’t even try to hide it anymore . The masses are still buying it in record amounts (even though it stinks of corruption).It even has a futures market (full of fools) .
270
“Hottest in 125,000 years say EU scientists”
Even if that statement was remotely true – So What? Please tell us what the issue/problem is then.
Trillions and Trillions of dollars are being wasted when all that humans need do is to adapt to any warming. Mother Nature will surely adapt at no cost.
Think of where else all of that money could have been spent actually helping humans – Health Services, Education, Research, Clean Water, Growing More Food, Better Housing, Better Infrastructure, etc, etc, etc.
Unfortunately, the Climate Alarmists are still in control. Not for long hopefully.
340
All these records are broken by fractions of a degree, that would be imperceptible to the average pleb.
240
Everyone forgets, the argument is not whether or not the globe warms. The only argument which is the basis of the induced hysteria but these days never addressed, simply taken as fact, is that HUMAN sourced CO2 is the cause of all global warming. To argue that the earths temperature is rising or falling, even when the reasons are given in such erudite and educational terms as seen on this blog, is a means of allowing the claim about CO2 to go to the keeper.
THE question, always avoided, is solely about the effects of CO2.
It is this claim for which our own governments destroy our economy. It is the most destructive claim ever placed on a modern society. It will be more destructive on society than any war because what we are doing to our country is never going to be repairable by the replacement system being forced on us by our own governments. Our potential enemies ignore the claims and their economies flourish, gaining hugely economically by building and supplying the means of our own demise. They know eventually they will never have to fire a shot.
190
It’s taken 125,000 years for an increase of 0.4 degrees. If we assume that’s degrees C, it will only take a bit more than 250,000 more years to reach the dreaded 1.5°C at which the climate models predict the earth as we know it will be destroyed.
Or, I heard on the radio a week or two ago, someone saying it has already reached the 1.5°C. I believe that’s in the last 50 years or so. That means, in the 124,950 years to about 1973 the temperature decreased by 1.1°C. Of course we won’t hear about that.
270
That’s why Australia’s BoM is engaging in data fraud by the scientifically invalid process of “homogenisation” to cool the past and warm the present. Homogenisation is scientifically invalid because it is a secret process which is not reproducible and they refuse to publish it, therefore, by definition, it is not science.
Tony Heller has documented how NASA and NOAA do that as well (but don’t call it homogenisation).
290
They also didn’t properly accp7nt for the change from mercury thermometry to digital thermotery. Different time constants leading to dramatically different readings.
170
accp7nt was meant to be be account.
60
Show yer workings… go on!
30
I am finding that discerning truth from lies has become a constant challenge. Our society seems to have evolved into a looney park side-show with distorting mirrors and frustrating mazes, the legacy media playing their part, keeping people brainwashed and sanitized against the truth; the government-big business cartel relentlessly attempting to control every aspect of our lives as a trade-off for security. I joined the resistance a long time ago but it seems to be needed more than ever.
260
I pretty much go with whatever is being labeled a ‘conspiracy theory’ or ‘misinformation’ is truth.
And the first 10 or 15 Googly search responses are lies.
Also, I don’t follow the horses or ‘The Science’.
200
Ah,’the science.’ Whenever they (Labor, Greens, Teals and David Pocock say ‘the science’) I cringe. Example, David Pocock: “the science says more ambition is needed” (first paragraph). The science speaks!
120
Pocock?
I see what yer doing there.
I will not bite.
No. Not me.
This is a science blog. Decorum is required.
When Pocock speaks, do the chicks listen?
(Darn you Trump … stop controlling my fingers!)
Hillary’s deprogrammers are coming for me.
50
They wouldn’t waste the energy loudly trying to discredit a story that was completely false.
On the stock market there’s a saying … “Don’t buy the rumour until it’s been denied at least once.”
110
After scientists at the University of Auckland investigated the claim that Tuvalu and other Pacific Islands were sinking, and concluded it was incorrect, Australia has now offered ‘sanctuary’ to Tuvalu Islanders because the island is predicted to ‘disappear’ by 2050. Don’t hold your breath.
211
Even the ABC fact checkers found Craig Kelly correct when he said Tuvalu was growing. I can see nothing to worry about Tuvalu disappearing after looking at the latest BoM published data of sea levels there.
170
Have been watching the sea level rise for the past 4 hours… if it doesn’t stop and retract in the next 2-3 hours then you’ll know we’re doomed. Stay tuned for breaking news…
160
Where is the humor about being regularly “mooned”?
50
Tuvalu, once depopulated, would make a very nice Diego Garcia II .
These things can come in handy, and could be cheap compared to a new aircraft carrier.
Just saying.
40
And, pray, would the flag be Chinese on the “Airstrip 2”?
Err,for example ….
Auto.
00
“Did the EU team find neolithic newspapers hidden in caves in Turkey? Could they reconstruct temperatures from 10,000 BC to 1978 to a tenth of a degree Celsius. And not just Turkish temperatures but ones in Timbuktu and Peru too? Those goat herders needed a satellite program. Perhaps clay pots powered with goat dung?”
Good humorous work Jo. Nice to see you getting your hand in to apply for that ACMA exemption against the proposed stupid misinformation definitions (Babylon Bee style?).
Since all leftist/CC/woke deliberations, conclusions and pronouncements are just so political science with so little physical science, you are assured abundant funny material to keep your site going indefinitely – or until we are saved.
200
More BS and FRAUD from the stupid, lying con merchants,or so called Albanese govt concerning Tuvalu battling so called SLR. In fact the majority of Tuvalu island have increased in size over the last 40 years. But the delusional Albo loony has spent or WASTED about 1.4 billion $ in the last 48 hours promising all Pacific island groups that they’ll be saved from their DELUSIONAL SLR idiocy.
Here’s the link and the abstract of the Kench 40 year Tuvalu study.
https://www.nature.com/articles/s41467-018-02954-1
“Abstract”
“Sea-level rise and climatic change threaten the existence of atoll nations. Inundation and erosion are expected to render islands uninhabitable over the next century, forcing human migration. Here we present analysis of shoreline change in all 101 islands in the Pacific atoll nation of Tuvalu. Using remotely sensed data, change is analysed over the past four decades, a period when local sea level has risen at twice the global average (~3.90 ± 0.4 mm.yr−1). Results highlight a net increase in land area in Tuvalu of 73.5 ha (2.9%), despite sea-level rise, and land area increase in eight of nine atolls. Island change has lacked uniformity with 74% increasing and 27% decreasing in size. Results challenge perceptions of island loss, showing islands are dynamic features that will persist as sites for habitation over the next century, presenting alternate opportunities for adaptation that embrace the heterogeneity of island types and their dynamics”.
161
So where’s their so called dangerous SLR or their so called dangerous global warming? The Dutch Donchyts’ study found that the world’s coastal land had increased faster than their so called dangerous SLR over the last 30 years.
That’s about 13,500 sq klms more land in the last 3 decades.
Here’s the Abstract and link.
“Earth’s surface gained 115,000 km2 of water and 173,000 km2 of land over the past 30 years, including 20,135 km2 of water and 33,700 km2 of land in coastal areas. Here, we analyse the gains and losses through the Deltares Aqua Monitor — an open tool that detects land and water changes around the globe”.
https://www.nature.com/articles/nclimate3111
121
Data analyst Willis Eschenbach also proves that the rate of so called SLR acceleration and deceleration has not changed since 1900.
Just look at the 1940s etc and the same today. And he uses the three most quoted data sources for his graphical link.
Don’t forget that SL expert Daniel Fitzhenry also pointed this out for the Fort Denison, Sydney SLR since 1914.
Here’s Eschenbach’s graph since 1900.
https://wattsupwiththat.com/wp-content/uploads/2021/05/30-year-trailing-sea-level-acc-3-datasets.png
121
Here data analyst Daniel Fitzhenry supports Eschenbach’s SL data graph, using the Fort Denison tide gauge BOM data since 1914.
This Bolt interview with Daniel Fitzhenry is very helpful and only takes about 5 minutes.
AGAIN where’s their so called dangerous global warming or dangerous SLR since 1900?
https://www.youtube.com/watch?v=9mjOmsqIibk&t=1s
131
Ah, but Adelaide had the hottest day early in November for 126 years on Friday. Nice of the BOM to find the records they normally ignore.
Of course it made me wonder what were the temperatures later in November 1897 or whether October 1897 had a hotter day?
100
And didn’t the local “News” on TV make a huge song and dance about that little convenient BoM factet? It’s almost as though there’s some kind of agenda.
10
Jo states “as if Cavemen could measure the temperature to a tenth of a degree”
They couldn’t but even if they could their data would have been lost long ago.
But longer-term data from U.N. climate science panel IPCC includes readings from sources such as ice cores, tree rings, coral deposits and isotopes traditionally measuring two isotopes of oxygen—one heavier than the other,
More recently however a newer technique “clumped” isotope paleothermometry,that requires nothing but information found in stable isotopes themselves. In the clumped approach, paleoclimatologist Seth Finnegan of the California Institute of Technology in Pasadena and his colleagues measured the conventional isotope ratio in sediments from approximately 445 million years ago.
Using the clumped isotope technique, Finnegan nailed down the timing and magnitude of ancient climate change. Around 445 million years ago—near the end of the Ordovician Period—he found that temperatures fell quickly by 5°C and glacial ice built up fast until the ice sheets were more massive than during recent ice ages
https://www.science.org/content/article/how-read-prehistoric-thermometer#:~:text=Paleoclimatologists%20have%20long%20used%20isotopes,other—preserved%20in%20marine%20microfossils.
56
Around 665 million years before present the world was a snowball.
Do you honestly believe that world temperatures haven’t been this high in 125,000 years?
40
“Do you honestly believe that world temperatures haven’t been this high in 125,000 years?”
As it is not my area of interest I have no idea but I’d rather take the word of those whose area of interest it is rather than the word of those whose interest it isn’t
45
That “interest” might be financial, reputational or other venal source
31
I don’t know but it seems the experts do.
43
Two journalists from Reuters tell a yarn and you believe it.
There is no such thing as a climate expert, different disciplines tag along if they can find a niche. I would dearly like to enrol at a university that taught the subject of climate change, but nobody is qualified to lecture.
60
Shock news for alarmists, poor dears,
And sure to cause climate stress tears,
As 2023 beat,
All records of heat,
Kept for 125,000 years.
130
Here Anthony Watts and panel talk to Dr Roy Spencer about their new study on the global Urban Heat Island effect.
The interview starts at 21 minutes and is very interesting if you have the time.
https://wattsupwiththat.com/2023/11/10/climatetv-urban-heat-island-effect-dramatic-new-findings/
120
How the con has been constructed: the word “global” is used in completely unscientific ways. Quoted from the EU article.
Globally, the average surface air temperature in October was 1.7 degrees Celsius warmer than the same month in 1850-1900, which Copernicus defines as the pre-industrial period.
Global temperatures have only been available since 1979-80, via satellite proxy measurements (oxygen microwave emissions). The temperatures from Octobers in 1850-1900 were not only measured in a completely different way (mercury bulb thermometers) they were in no sense remotely global, comprising a few data points in cities in advanced countries, and blank everywhere else, including oceans.
In order to make this claim, they would need to take only datum points for October 2023 from thermometers in the same cities as for 1850-1900. Did they? I think not.
Further on in the article.
Copernicus’ dataset goes back to 1940. “When we combine our data with the IPCC, then we can say that this is the warmest year for the last 125,000 years,” Burgess said.
The longer-term data from U.N. climate science panel IPCC includes readings from sources such as ice cores, tree rings and coral deposits.
Now we are splicing on a third temperature set, taken in completely different, also extremely sporadic, locations, that have no possible resolution down to a specific month. In order to make this claim, they would need to take datum points for October 2023 from ice core/coral/tree ring data in the same locations as for those dating from 123000BC. Did they? I think not.
Conclusion: Frankenscience that makes flat earthers look like Nobel prize winners.
140
Well the HADCRUT temperature database started in 1855 with ONE thermometer in the whole southern hemisphere, and the same for 1856 & 1857. After that the figures were added from Sydney and Melbourne. Not sure whether they were Stevenson Screens.
Obviously Climate Scientists were able to
makeupextrapolate the temperatures for the entire Southern Hemisphere.120
Even if you took temperature readings today in the same city locations as in 1850, the urban heat island effect would distort any real data, and the bedwetters would claim to be correct that their world is heating dangerously.
90
“Conclusion: Frankenscience that makes flat earthers look like Nobel prize winners.”
I’ll have to remember that one.
70
The lies and falsehoods are getting blown out of all proportions. It will end with the great deflation and the wrath of the people.
70
“It is only in the last 100 years or so that the ideas of Alfred Wegener (1880-1930), a real climatologist, geologist, geophysicist, meteorologist and polar researcher came to be accepted that the earth is not static. Among other ideas he conceived of continental drift which led to plate tectonics.”
Not that Wegener was initially ridiculed for his theory of plate tectonics…
90
Odd that after dissing the reconstruction, the post then uses reconstructions to prove that the first reconstruction was wrong.
As to satellite data, exactly what is being measured, how is it calibrated, is there instrument drift, and finally, were any floating cities (like in Star Wars) included?
416
Look at the quality of the proxies and look for possible differences. Than you may have an idea, why the one reconstructioon seems to be wrong and therefor dissed.
90
Oh I see, you just pick the one that you like. So sciencey
315
Academic ideas are floated only to be shot down if they don’t match observation. Jo’s references are there for discussion if you have the time.
In regards to UAH, the bugs have been ironed out and its fit for purpose, it perfectly captured the heat spike over the past few months.
Do you believe that temperatures haven’t been this high in 125,000 years?
31
Since you didn’t make any specific example, you offer nothing for anyone to ponder over.
70
Why do you think the Australian Government wants to introduce censorship legislation? They don’t want the truth -about anything- to get out.
121
And it is reasonable to suggest that if censorship – of the truth – works, or is seen to be advantageous, in Australia, it will be applied (a ‘level playing field’, anyone?) elsewhere, including the UK, the USA, etc.
With all the control that that demands.
Auto
00
A very few Leftists are waking up to the lies on the Official Narrative, but even though they have realised their errors, they will receive no forgiveness from me because:
1) The damage done is too severe and probably not repairable in one lifetime.
2) They were repeatedly told the truth and responded with endless abuse and often physical violence against the truth tellers.
91
.
Plus the Siberian Taiga forests were up to 200 km further north, during the Holocene Maximum, some 8,000 years ago.
It was most definitely much warmer at that time, especially in polar regions. This was mainly due to a larger obliquity angle, which was at a maximum about 8,000 years ago.
R
70
Sahara Expert Says Desert Shrinking, Calls Alarmist Tipping Points “Complete Nonsense”
90
Referred link from the above posted link:
New Study Finds The Early-Mid Holocene Sahara Had Lakes With Depths Of ‘At Least 300 Meters’
60
Many more studies that prove SLs were much higher in the earlier Holocene.
https://notrickszone.com/2017/05/08/10-new-papers-sea-levels-1-6-meters-higher-4000-6000-years-ago/
60
Our Tuvalu-an new chums seem a healthy lot. Buy insulin stocks!
https://search.brave.com/search?q=obesity+tuvalu&source=desktop
40
“It’s “virtually certain” said two journalists at Reuters. It was broken by 0.4 degrees!”
For pity’s sake.
70
“Virtually certain” means certain in their virtual world.
Never remove the goggles!
50
I wonder how they managed with the change that occurred about 65,000 years ago. Prior to that, what is now known as Australia was uninhabited.
30
AGAIN another new SLR and coastal study for our ignorant blog donkeys. This study looks at the SE coast of Australia since 1650 and then compares the 1970s storm’s effects on the coastline over the last 40 + years.
Here’s the abstract of the Tamura study and the key points.
https://agupubs.onlinelibrary.wiley.com/doi/full/10.1029/2019GL083061
“Recurrence of Extreme Coastal Erosion in SE Australia Beyond Historical Timescales Inferred From Beach Ridge Morphostratigraphy
T. Tamura, T. S. N. Oliver, A. C. Cunningham, C. D. Woodroffe
First published: 18 April 2019
https://doi.org/10.1029/2019GL083061
“Abstract
“Extreme storms present a major risk to coasts. Increasing populations worldwide, together with sea level rise, exacerbate concerns for coastal settlements, but the low frequency of extreme storms makes an assessment of risk difficult. In southeast Australia, the severest beach retreat on record relates to a series of extratropical cyclones in the 1970s, but the relatively short observational record hinders assessment of how frequent these events are. At Moruya in New South Wales, four decades of beach monitoring has provided new insights into response of beaches to extreme storms. We augment this recorded history with morphostratigraphic analysis of beach ridge evolution by using ground-penetrating radar and optically stimulated luminescence dating. We find an episode of extreme retreat over 550 years, proving that the 1970s extreme event is a recurrent phenomenon. Our high-precision morphostratigraphic analysis provides evidence with which to better plan coastal adaptation.
“Key Points
“Short observational history in SE Australia hinders assessment of whether extreme beach retreat in the 1970s is an isolated or recurrent event
“High-precision morphostratigraphic analysis of beach ridge evolution augments 40 years of beach profiling at Moruya in NSW
Extreme beach retreat is found to have occurred around 1650–1700, revealing that the 1970s event is a recurrent phenomenon”.
40
AGAIN the BOM cyclone trend for the Aussie region has declined since 1970 or the last 50 + years.
Here’s the BOM graph and anyone should be able to understand it.
http://www.bom.gov.au/cyclone/tropical-cyclone-knowledge-centre/history/climatology/images/figure1.png
40
They seem confused ?
Either it is , or it isnt, a recurrent event ?
Just hedging their bets i guess to ensure continuation of research funds !
But a lifetime of monthly trips to the coast at taxpayer expense is not a hard carreer to want to hang on to !👍
But they could have gat the same result by just chatting to some of the older locals down there who would have assured them .. “ she’s sweet mate, same as’ ”
40
AGAIN Ken Stewart links to many more SLR studies for the Aussie region and finds much HIGHER SLs in the earlier Holocene.
The early Holocene was much warmer than today as the studies prove.
Of course this persisted for many thousands of years of warmer temperatures.
https://kenskingdom.wordpress.com/2021/08/23/the-worlds-biggest-thermometer/
40
More proof that Antarctica has cooled since 1999 ( for last 24 years????) and West Antarctica has cooled by about 1.8 c over the same period.
Here’s a link to the new 2023 Zhang et al study and just supports what the Turner BAS UK study found about 4 years ago.
https://notrickszone.com/2023/11/06/new-study-finds-most-of-antarctica-has-cooled-by-over-1c-since-1999-w-antarctica-cooled-1-8c/
40
But let’s be fair. The people writing these stories are probably about 25 years old.
One of my favourite hobbies is looking up the author of ABC stories, it rarely disappoints (for a laugh).
81
Klimate Katastrophe? REGULAR or SUPER?
https://www.youtube.com/watch?v=cKUz5Vjq9-s
30
Imagine when the Govt disinformation bill is passed. This whole commentary thread will be deemed misinformation and banned.
40
Don’t worry, my bits will stay.
14
Someone should explain to journalists that even the finest resolution proxies (ice cores) cannot be matched with the instrumental record because it doesn’t span enough time. Ice averages CO2 concentrations over 60 years at least, other proxies over much longer periods.
Look at what looks like the Hadley Centre reconstruction averaged over 60 years : tenths of degrees and even one degree peaks vanish :www.woodfortrees.org/plot/hadcrut3gl/mean:720/plot/hadcrut3gl
20