Surprisingly, the World War I era temperatures are still changing. Mornings that seemed nippy at the time are now susceptible to frosts.
Someone should warn the farmers — except they’re all dead.
Thanks to Chris Gillham for independently and laboriously going through the new unannounced changes in another cycle of BOM’s hidden revamp of Australia’s history. ACORN 2.2 is the latest version of the Australian Climate Observation Reference Network of “the best” 112 weather stations across Australia.
Bureau of Meteorology ‘cools the past, warms present’
Graham Lloyd, The Australian
“The bureau has now remodelled the national temperature dataset three times in just nine years,” Dr Jennifer Marohasy said.
In the last five years the ACORN re-revisions by the BOM have discovered another quarter of a degree of warming that we didn’t know about from the last hundred years. It’s not clear why the BOM doesn’t want to tell the world how good they are at correcting thermometer records from 1913. It seems like a remarkable skill.
The minima just keep getting cooler
Chris Gillham plots the longest running stations from the ACORN 2.2 set against the old raw readings:
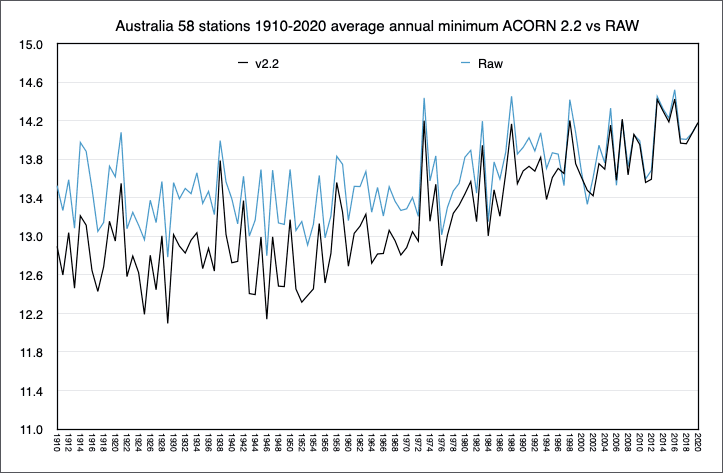
Who knew all those old thermometers were so wrong?
Graham Lloyd:
Independent analysis of the latest changes show they added 0.06C to maximum warming and 0.11C to minimum warming from 1910-19 to 2010-19.
A series of updates to the ACORN data have added 0.228C mean temperature warming if comparing 1910-19 with 2010-17 (2017 being the final year of ACORN 1)
Clearly, the cheapest way to stop global warming would be to sack everyone at the BOM.
The Bureau admitted to Lloyd that they changed 25 sites in the latest round, most of them because of statistical revelations:
The bureau said changes were made to 20 sites on the basis of statistical analysis. According to the bureau, statistical analysis is used to identify an abrupt warming or cooling at a particular site, relative to other sites in the region.
The BOM refuses to tell us exactly how they do this — admitting that they can’t train anyone outside their sacred guild. Which reminds us of the old axiom, “if it can’t be replicated, it isn’t science”.
Apparently the future of life on Earth depends on their data, but it would take too long to train someone outside BOM to check it. Tell us again, how much does climate change matter?
Here’s the BOM explanation of the need for adjustments:
“A significant change relative to other sites indicates a non-climatic driver, which sometimes has an easily identifiable cause (e.g. a new building near a site) and sometimes does not (often these will relate to local vegetation or land surface changes)”, the bureau said. “In carrying out this statistical analysis, the bureau uses 10 years’ worth of data from multiple sites to quantify the size of the change. Adjustments are only applied where a significant change has been identified.
So instead of researching the site history as deeply as they can, the BOM use statistical trickery analysis to figure out local site changes using some other thermometers “within a thousand miles”. What they don’t do is full historical research and documentation of the sites first. (Like the ones here, here and here, thanks Bill Johnston). So it’s possible that if, say, 10 sites got similar changes at the same time (like changing to a new small screen) the other better sites in non-changing screens could be slowly “corrected” one-by-one by the junkier sites with the right statistical algorithm. Now, perhaps the BOM have ways to make sure that doesn’t happen — but they won’t tell us what they are, they don’t publish the detailed documentation of either the full site histories or the methods they use to correct them.
As Chris Gillham notes, the BOM say the new adjustments didn’t change the long term trend. But a lot of little changes in the same direction would. The new adjustments might have also made a few local hottest ever headlines much easier to get. Suddenly the modern contenders for the longest heatwave, warmest night, and hottest summer all got a head-start.
The mysterious process of homogenization
The Bureau “homogenizes” a site according to a mystical method that uses an inexplicable group of sites that are in the same region, or at least in Australia somewhere. For example, lighthouse readings off the Bass Strait have been corrected with help from Hay, 600 kilometers away, on the other side of the Great Dividing Range. A thermometer in Ballarat has been used to correct one at Bruny Island off the South coast of Tasmania. The BOM has also corrected Alice Springs using measurements in Collarenabri nearly 1,600 kilometers away. (Thanks to Ken Stewart for that tip). When I said “a thousand miles” I wasn’t joking.
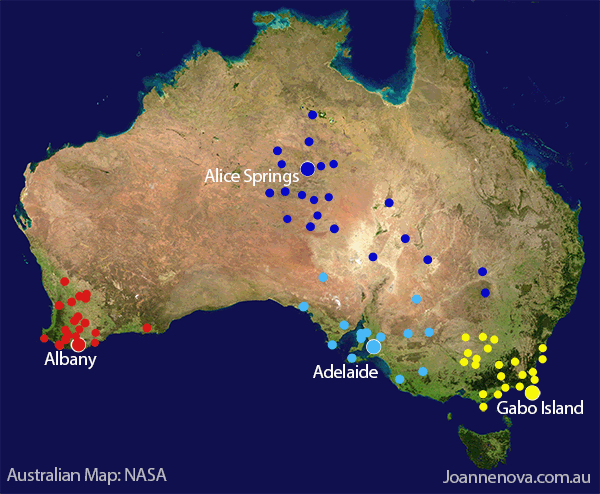
All the sites marked in black, for example, have been used to homogenize Alice Springs
Congratulations to Chris Gillham, Jennifer Marohasy and thanks to Graham Lloyd.


Cross correlations between physically distant sites is unsurprising. If you don’t like Acorn, use NOAA, NASA, HadCRUT, Berkeley Earth, or Copernicus.
376
Or stick with real data, and discount the present for urban heat effects.
The cross correlations of site huge distances apart is a farce… allows them to pick and choose so the stable stations are infected with urban warming from bad stations.
It has been shown that some 45% of Australian sites are totally unfit for historical climate purposes.
740
The original thermometer for Brisbane was housed at the old Wickham tce windmill site, then in the 80’s, due to ‘urban heat island’ effects, it was moved to Brisbane Airport, I wonder what effect this had on average readings, because what do you find at airports, hectares of concrete and asphalt and jet exhausts.
230
According to BOM – “ The Bureau of Meteorology has attempted to place as much information and data on these webpages to allow a proficient end-user to effectively reproduce a homogenization analysis of the raw or base temperature data. Given the complexity of the task, complete replication of every analysis step and analysis decision is unrealistic. However, as shown by the independent results of Australian surface temperature produced by international datasets, the temporal and spatial patterns analysed from the Bureau’s implementation of ACORN-SAT are reproducible. This is detailed in the ACORN-SAT FAQ 15.”
That would support your view Simon, and would question this statement from the post “ The BOM refuses to tell us exactly how they do this — admitting that they can’t train anyone outside their sacred guild.”
474
Real science is not just attempting to, it is giving the public enough information to completely repeat the work. Anyone with the skills and time.
More complexity means a bigger chance to screw up and not notice. The best that you could say about these people is it’s suspicious that they only check their work if they get a result that they don’t like.
580
“they only check their work if they get a result that they don’t like.”
I’d be pretty sure that they keep running their “algore-rithms” until they do get a result they like.
Its called “tuning”.. seen it done many times, usually to try to get models closer to measured reality.
In BoM’s case, its the opposite, where they seem to try to get their final result as far away from measured reality as they possibly can.
100
” AlGore-rithms”, I saw what you did there. LOL
40
Peter, The BOM gets a million dollars a day but they can’t write up their methods and decision-making so someone outside can replicate their process. That equals, no published method. It’s not science.
The Forum noted that the extent to which the development of the ACORN-SAT dataset from the raw data could be automated was likely to be limited, and that the process might better be described as a supervised process in which the roles of metadata and other information required some level of expertise and operator intervention.
So only people paid by the BOM can possibly understand the reasons thermometers need to be adjusted. It’s only a bunch of thermometers Peter, not quantum entanglement.
Dear Simon, why not use UAH instead — the only dataset with 24 hour coverage and across the whole nation, that agrees with millions of radiosondes, and which doesn’t rely on faulty data from faulty sites with a magic method to “analyse”.
551
Did you look at the link, the original data, the method, and the agreement with other climate datasets are all there. Even UAH (climate and not weather) agrees
119
Peter, please take a few minutes to read the BOM Technical Advisory Forum Report from September 2017. Very few of the Recommendations, if not none, have ever been implemented by the BOM.
150
“Even UAH agrees”
Wrong… UAH shows there is only warming at El Nino events
UAH shows there is zero warming from atmospheric CO2.
Its only when you mutilate the real data and destroy all the information in it that you get anything that looks like continual warming that CO2 would cause.
You do know that is what all the averaging, adjustments and homogenisation does, don’t you..
it destroys information !
\Its what the AGW meme has to do.
Destroy real information and create their own fabrications.
110
“the original data”
Yes, let’s just look at the original data..
… in almost every case it shows very little warming.
Alice Springs for eg
https://i.postimg.cc/1ty10k9m/ALICESPRINGSAIRPOR-AS-Average-Mean-Temperature-Jan-Dec-1942-2017.png
https://i.postimg.cc/LsKp5qwZ/ALICESPRINGSPOSTO-AS-Average-Mean-Temperature-Jan-Dec-1895-1982.png
Your point is ??
50
More original data for you..
Richmond and Darwin
https://i.postimg.cc/zBzV88Ph/Richmond-Darwin-1.png
https://i.postimg.cc/d0HmbH5J/Rutherglen.png
For Rutherglen, there is absolutely no known reason for these data fabrications…
…. they change cooling to warming.. they are a lie. !!
30
And yet another case of a totally unjustifiable mal-adjustment..
https://i.postimg.cc/PJCCLhsR/amberley-adjustments.jpg
20
Interesting to note that the Aus climate summary for 2021 will not be issued until February. BoM usually has it out by the second week of Jan (may need some more time to do the necessary adjustments). BoM’s Time series has the mean temp for last year at 0.56C so I can’t see the problem – covid?
BTW, all the annual mean temps have been adjusted since at least 1995 so the BoM is a law unto itself.
120
UAH is an estimate of tropospheric temperature., not the surface. There is also something wrong with its corrections for satellite drift, it does not align well with other tropospheric measures such as RSS or RATPAC.
https://www.realclimate.org/index.php/archives/2022/01/another-dot-on-the-graph/#.Yew5QnOlAac.link
210
Wrong again
Ratpac is a fudge of selected data, and RSS is “corrected” using climate models of all things… A total joke.
UAH aligns with the CERES, ERBS and unadjusted balloon data.
https://i.postimg.cc/DyckQYzC/UAH-ERBS-no-trend.jpg
https://i.postimg.cc/nhW9X9gp/CERESv-UAH.png
https://i.postimg.cc/Kc9GcSdy/radiosonde-data-1958-to-2002.gif
“Real Climate” are basically the lead scammers of AGW… wrong place to get reliable information.
UAH even matches NOAA’s own satellite
https://i.postimg.cc/bwysC9cz/UAH-vs-NOAA-satellites.png
It is GISS and its stable mates that are out of sync with real radiative data.
https://i.postimg.cc/3ryGHBc9/giss-vs-uahv6-og-ceres-90-55n.png
50
Why not build your own temperature reconstruction? You will need to know how to manage some large covariance matrices….
310
And if we want to match the big boys, we will need to learn how to make dishonest, anti-science adjustments that are meaningless when put against the real raw data.
40
Would also need to learn how to smear urban affected temperatures over vast regions and infill all the missing data with output from special “climate” models.
No thanks.
Will stick to raw data and reality. !
Look only at raw unadjusted data from reasonably stable temperature stations.
Then you get something like this…
https://i.postimg.cc/d3DYX6my/Lansner-and-Pepke-Pederson-2018.jpg
50
Clarence >”Then you get something like this… [Lansner and Pepke Pederson (2018)]”
But that would be observational science – and we can’t have that in “a warming world”.
But thanks for posting anyway, I had not seen that previously.
20
Simon >“Why not build your own temperature reconstruction?”
Why “re” construct?
As below at #1.7, actual, real, observed data is already constructed and that is where the record meteorological max/min observations are found – NOT in “re”constructed pseudo data.
But in answer to your challenge and rather than reinvent the wheel (and be bothered with “large covariance matrices”) it is literally child’s play to “build your own temperature reconstruction” with this tool:
Web-based Reanalysis Intercomparison Tool: Monthly/Seasonal Time-Series
https://psl.noaa.gov/data/atmoswrit/timeseries/index.html
With which using the following parameters it is very easy to plot absolute 2m-T showing the summer-winter seasonal cycle (absent from “re”constructed timeseries) and a Southern Hemisphere trend for the last decade of -0.267 C/decade.
In other words, although a large land mass, Australia or any other local region is not typical of the Southern Hemisphere.
Parameters:
Variable: 2m Air Temperature, 1000mb
Start/End: 2012, 2021
Grid Lat: -90, 0 (Southern Hemisphere)
Defaults for all else
Create Plot
Voila! Our own temperature reconstruction.
QED
30
BTW Simon, the one green tick you’ve got so far at #1.2.1.2.4 was from me, given your reasonable challenge. Which turned out to be a doddle.
21
Simon >“Why not build your own temperature reconstruction?”
Karsten Haustein’s been doing that for years:
GLOBAL AND REGIONAL CLIMATE ANOMALIES
NCEP Global Forecast System and Reanalysis
http://www.karstenhaustein.com/climate
Getting a bit awkward for Karsten since he works on “the World Weather Attribution project, which aims at quantifying the role that anthropogenic climate change plays in extreme weather events”.
The overview panel shows a global mean dT=0.364 for 22nd Jan 2022. But if you click on the panel and keep clicking you can see the dT for every monthly average going back to 2015. Mostly warmer (considerably for El Nino) until Jan 2015 dT=0.223.
So after 8 years and an excursion to dT=0.818 in Feb 2016 the planet got a whopping 0.14 warmer with a week still to go in Jan and looking at the forecast probably back to 0.22 and no gain whatsoever.
Scroll down to GFS 0.5deg forecast vs NCEP CFSR reanalysis 2m air temperature anomalies:
Mouse over Robin: 7 Day 168 forecast anomaly global: 0.218K.
Almost the exact Jan 2015 dT=0.223K.
That’s got to irk a Warmy surely.
10
Yes, its one great big number fudge.
Unfit-for-use stations used to mal-adjust stations with decent records.
GISS et al take BOM’s adjusted data, and often do even further “adjustments”
None of it is real once they have finished.
Of course they are reproducable if you use the same flawed methodology with the same aim of increasing temperature trends…
… and know the data you have to try to match to to help your comrades-in-frord along. !
360
As an engineer and scientist who spent 40+ years making all kinds of measurements there used to be an iron clad rule that you could never change recorded measurements except when you identified an error at the time of the measurement. In standard practice, corrections made at the time were done by crossing out the erroneous result so that it remained legible and writing in the correct value with a note explaining the change (initialed by the person making the change).
In cases where an older result was brought into question, the acceptable process was to investigate and estimate the likely increase in the claimed uncertainty of the result. If possible the preferred solution was to redo the measurement.
I am personally aware of incidents where accredited laboratories providing data to government regulatory agencies were investigated and fined for improperly altering originally recorded data in final reports. In one case the use of “white-out” alone was considered sufficient cause to pursue disciplinary action. I know of one case where a laboratory manager was convicted of fraud and received a prison sentence for altering data to show compliance rather than failure to meet a regulatory limit.
500
Very similar rules exist in Surveying.
Only the original data, in pen, not pencil, any numbers corrected at the time, still legible.
White out will get you sacked !
Of course, nowadays, data is mostly recorded inside the machine.
260
Your treatment of recorded data is correct but you gave the game away when you said engineers and scientists. You must realise by now that the folk at BoM are not engineers because engineers have to get it right or otherwise bridges collapse or planes fall out of the sky. They are not scientists either or they would keep the old records and would not fiddle with them. They are an old breed wearing white coats called charlatans. These folk would sell their souls to keep their jobs and are totally lacking in ethics. They prostitute themselves to help the government sell the lie that CO2 causes runaway warming because the government are gullible fools who cannot bring themselves to admit they are wrong. That does not excuse the charlatans at the BoM who take a million dollars a day fraudulently.
290
Rick C
This has been replaced by the ‘Memory Hole’. These people can say what they like and it will be tomorrow’s ‘Flash & Bytes’ wrapper.
The other protection they have is they are impervious to examination by elected representatives and enjoy the protection of publicly funded legal protection.
110
“when you identified an error at the time of the measurement. In standard practice, corrections made at the time were done by crossing out the erroneous result so that it remained legible and writing in the correct value with a note explaining the change (initialed by the person making the change). ”
Exactly the same procedure is de riguer when filling out my proof of pasteurisation log in the dairy factory.
Anything less is unacceptable , and will result in a non-compliance notice.
50
All original measurements remain recorded without changed.
02
PF,
Some of us have done our own studies, collecting more information on sites than BOM seem to know about. Like, I have spent time with Dr Bill Johnston spending hours searching through historic paper records held at airports and BOM offices Slow, patient work, but revealing again original, unadjusted data when you get lucky.
Peter, in the majority of cases where these rediscovered facts are blended into existing data, the result is that overall, there has been less warming than the BOM claim. Not by a little bit, but by a lot. FWIW, my overall impression is that about 0.4 deg C of Australian warming 1910 to 2020 is the maximum claimable by using hard science, not the 0.8 to 1+ deg C that BOM estimate.
Now 0.4 deg for a Century is not an existential threat. But it is the maximum we can find using hard science that can be replicated. Houston, we have a problem, Geoff S
500
Mr Fitzroy, this debate has been going on for years,
https://jennifermarohasy.com/2014/08/whos-going-to-be-sacked-for-making-up-global-warming-at-rutherglen/
180
That would support your view Simon, and would question this statement from the post “ The BOM refuses to tell us exactly how they do this — admitting that they can’t train anyone outside their sacred guild.”
And this from your quote from the bOM would completely demolish any point you thought you had:
Given the complexity of the task, complete replication of every analysis step and analysis decision is unrealistic.
A single talented blogger can replicate the errors of what BOM does.
70
They have had bigger corrections in the past 10 years than they differ now. That is hardly reassuring. NASA’s GISS for individual sites differs between versions by a degree e.g..
https://realclimatescience.com/wp-content/uploads/2019/03/NASAGISSReykjavikTemperature_shadow.jpg
Now, GISS (NASA) is close to Berkley Earth. They differed a lot with v2, which differed from the raw data significantly.
210
And no-one should trust GHCN for anything resembling reality
https://i.postimg.cc/Ss9Y8zxF/alice-springs-temp-adj.png
Compare that to actual measurements.
https://i.postimg.cc/LsKp5qwZ/ALICESPRINGSPOSTO-AS-Average-Mean-Temperature-Jan-Dec-1895-1982.png
https://i.postimg.cc/1ty10k9m/ALICESPRINGSAIRPOR-AS-Average-Mean-Temperature-Jan-Dec-1942-2017.png
Again we see that the only warming, comes from data fabrication !
380
Cross correlations from physical different sites… seriously? One with maritime and the other with continental seems incongruous. This homogenization process achieves one thing; obfuscation.
320
Using Ballarat to ‘correct’ Bruny Island, yeah that’d work.
280
Well they both start with B I suppose.
240
Yes, perhaps they could throw Bundaberg in there as well, just to make it even more interesting.
100
Simon >”If you don’t like Acorn, use NOAA, NASA, HadCRUT, Berkeley Earth, or Copernicus”
I prefer actual measured data, so why would I “like” those?
Also, all meteorological temperature records (e.g. hottest/coldest day) for sites reside in the observed data at those sites – NOT in those datasets.
Actual record hottest/coldest days are in the raw unadjusted site data. This is an inescapable fact that shatters the rationale for “adjusted” datasets.
150
This poor chap was surprised.
H/t to previous post by KeithH quoting poor Harry_READ_Me and his efforts to find a coherent records
Simple question Simon. Do any of these databases reference ACORN stations?
120
Simon, Tony Heller has extensively documented data fraud from NASA and other US Government meteorological agencies.
150
If cancer researchers did this they would end up in jail. “Climate scientists” do it and they are given tenure.
520
Being a bureaucracy and controlled by politically charged alarmists makes the BoM problematic.
340
“All the sites marked in black …”
Does blue equal black?
Asking for a friend with a color monitor.
220
Yes I did not see any black dots on the map either.
100
Being color blind, I can assure you, they are black.
80
Blue is the new black.
50
They look blue to me.
20
Maybe they removed the black ones ‘cos it’s racist?
40
I’ll knell to that.
00
No lie is too outrageous in the “Climate Change” world, just like in the Covid/Vaccine world. So far they seem to be getting away with it. Constant rubbish in climate and blackmail in vaccines.
350
“It’s not clear why the BOM doesn’t want to tell the world how good they are at correcting thermometer records”
GISS seems to know the same trick !
https://notrickszone.com/2022/01/19/japans-own-data-show-no-warming-for-tokyo-but-nasa-tampers-changes-trend-to-warming/
180
I think you will find that the data manipulation procedures is pretty much common, with variation between Had, GISS and BoM, and probably adapted by others, such as NZ, and who knows who else.
It was devised by a guy name Stott, (iirc) who did stints with HAd, CRU, BoM, (and GISS ?).
He was certainly one of the AGW troupes.
BEST uses a similar format, based on “regional expectations” (whatever that means)
In basically case where it is used, near zero trends are “magically” transformed into rapid warming trends. !
Designed for purpose. 😉 !!
110
BEST is very different, it uses a breakpoint detection algorithm. It was sponsored by Koch Industries using scientists with no vested interest in the results. The end result was a temperature record almost identical to the others.
222
Koch got conned for one year, as did many others, even Anthony Watts.
Koch withdrew funding after one year.. BEST are now funded mostly by a big grant from “anonymous” (I wonder who that might be)….. of course their final fabrication matches what is needed.
BEST even found a way of ignoring the UHI effect, saying it basically didn’t exist.
Their “breakpoint” nonsense is a statistical farce that makes up breakpoints when there are natural climate changes and whenever there is a cooling trend. The aim is always to meet that “regional expectation“.
ie. its homogenisation and data tampering, just under a different guise.
110
“with no vested interest in the results”
Muller had constantly stated that he “believed” CO2 caused warming
His daughter, who basically ran the group, was a die-hard warmista.
Zeke Hausfather (sp?).. another rabid alarmist, part of the inner sanctum of AGW cult-leaders now.
Then Mosher, a non-scientist paid mouthpiece.
Need I say more. !!
20
Muller was never a skeptic.
His daughter — Elizabeth Muller (Director of BEST) ran a “Green government” consultancy. Just how impartial was BEST? It was a PR scheme from beginning to end. Fakery and lies for marketing purposes.
40
Glad you had those links handy. 🙂
10
There’s a discrepancy between the climate summaries and the time series graphs for temps over at least the past twenty years. For instance, 2001 and 2011 annual mean temps for Aust were below average and showed up on the TSG as so until recently. Now they have been adjusted up so they are no longer below average (probably as a result of ACORN2.2).
I also noticed that the NR area of NSW was shown as an above average mean for December yet only one site in the area was actually above average.
140
My query too about announcing our area above average when it was demonstrably otherwise. In fact, our area has had 3 months in the last 18 that have been above the average. But hey, who would know or even care.
80
The only ACORN site is Yamba in the NR area. It was the only site above average for Dec max means. So the whole area seems to be based on one site. I’ll keep an eye on it to see if Yamba is below average and check the the NR’s temp record then.
90
Ian, I’m looking at Armidale, Narrabri, Tamworth, Glen Innes and Moree. All indicate temperatures lower than average with variations between nocturnal and diurnal varying. Of course this all indicates ENSO as the dominant force.
70
Glen
Check your district for Jan and see if it adds up. In the NC area, all max means are below except Yamba – again. Will be interesting.
00
So they allege they haven’t changed the “long term trend.” Ah hah.
Perhaps they will not notice the cooling trend which should start to make itself felt around the middle of this decade? The GSM may not do much cooling until around 2025, I’m picking. It may be sooner, but it won’t bandy things around when it starts. Watch the Southern Hemisphere Winters — they will become less than pleasant just as the Northern Hemisphere winters have.
Zharkova et al are picking a food shortage starting around 2028,
(a famine no less) so there will be cooling before then. We will all have to be alert for it and its start.
190
Cooling has already begun in south east NSW, BoM forecast this in their summer prediction and they are on the money. The Southern Annular Mode is a major player.
40
Factor in also the fertiliser problems this year because of spiking gas prices and you have a perfect storm approaching.
70
Tonga’s Hunga Tonga-Hunga Ha’apai volcanic explosion will have only a small effect of cooling (if any) so far but that could change quickly if it goes off big time.
60
The volcano cannot achieve anything that cannot be adjusted out. They will probably say that any temperature drop is from a volcano and therefore is to be adjusted – like they do with isostatic adjustments to sea level: isostatic changes cause an actual fall in sea level, so they are adjusted out.
110
Sophocles, did you notice Jim ‘Climategate’ Salinger jumping on his soapbox last week claiming Tonga’s eruption would cool Earth’s temperature by (insert any random fraction of an irrelevant number).
Intriguing how all these self-appointed high priests – Bourla, Tedros, Faux-xi, Salinger – are now trying to cover their past tracks. If it smells like a rat…
10
Because of its explosive nature it was quite unique in the modern era.
https://www.nature.com/articles/d41586-022-00127-1
40
I would say it is time to lodge an FOI request for that data set model, including the full end too end data management plan, that tracks lineage, and records all of the transformation steps and linkages to the peer reviewed scientific papers that drive the need to change historical datasets.
That data management plan should exist, and if it doesn’t then they have no way to describe the end too end data process which is what I presume is the case.
BoM is not transparent with its data, as they have shady data management practices and are not willing to conform with data standards, and often make up their own, for National Security reasons.
Unfortunately the mass of city dwellers who believe everything the ABC and the Government Parties say means they accept this sort of change as “it’s the science”.
160
Speaking of Giles ( the place, not you 😉 )
Giles is a remote, isolated very well maintained, urban free station, back of beyond, in WA near the NT border.
Probably one of the most consistent stations in Australia, if not the world.
https://i.postimg.cc/gkPyFPXW/Giles-temps.png
As you can see, essentially zero warming since the mid 1950s when it was installed.
Orange is daily max, yellow is mins.
The blue/grey break is change of equipment to electronic.
00
The questionable practices of temperature records homogenisation by the BOM have been going on for a long time and the questions have been asked for a long time but are still not answered.
In 2012 I attended a conference of the Australian Environment Foundation in Sydney.
One of the papers was “Is the temperature or temperature record rising? – Dr David Stockwell” and it adessed exactly this issue. It was the first time that I had heard about it.
https://www.australianenvironment.org/testimonials
90
Unfortunately the link doesn’t get to the actual paper/talk.
Would be nice to see the original, if possible, please.
50
In any other world, this is known as tampering.
170
Jo,
Whilst they’re spending time doing this they somehow have forgotten how to forecast. One of the problems is the computer generation of models and their failure to look outside, as most of them probably have little experience of what certain clouds look like and what the sky should be telling them. No greater example of this was the morning of the 18th of June 2013. Early that morning a Qantas B737 left Sydney for Adelaide and a little earlier a Virgin B737 left Brisbane for Adelaide – when bothe aircraft were about to descend into Adelaide they were told that Adelaide had closed with fog.
Both aircraft then diverted to Mildura which was also deteriorating with fog and were then low on fuel. After the Qantas aircraft landed in minimum visibility, the Virgin aircraft made two approaches landing off the second approach without seeing the runway and 15 minutes fuel left. Fog does not form in 20 minutes which is all the notice both aircraft were given and the BOM had no idea what was happening at Mildura either. Even after a long investigation no one at the BOM received any disciplinary action for this disgraceful lack of competency and other similar forecasts have happened at Adelaide since.
Even the Director of the BOM has no meteorological experience having an agricultural science degree, just like Dr.John Skerritt the Head of the TGA who is not a doctor but can tell us all about vaccines and drugs. Also the new head of CASA is a public servant with no aviation experience. Wonderful world we live in with this sorts of regulators.
200
I know of a captain of an Australian airline who after nearly being caught a few times with dodgy weather bulletins, now has local contacts that he phones to ‘take a look outside’ near the airport before departure, always takes the maximum diversion fuel possible for Perth and Adelaide, without getting an invitation to ‘tea and a biscuit’ from the Chief Pilot.
90
“Even the Director of the BOM has no meteorological experience having an agricultural science degree, just like Dr.John Skerritt the Head of the TGA who is not a doctor but can tell us all about vaccines and drugs. Also the new head of CASA is a public servant with no aviation experience. Wonderful world we live in with this sorts of regulators.”
Apparently these administrators have ‘transferrable skills’, skills like being able to BS to the assembled throngs and still keep a straight face and being skilled in in sex discrimination and other hurt feelings and how to run a safety dept without actually spending a cent on actual safety.
120
As a farmer, I can tell you that 20km makes a difference in climate.
Farmer sayings:
-Once you get North/West of that road it doesn’t rain enough in Spring.
-They always get storms near the river.
-That’s frosty country.
-Not far away but it’s just hotter there for some reason.
260
The new technology is a problem.
‘BoM claim that Onslow 50.7 yesterday matches the 50.7 at Oodnadatta in outback South Australia, on January 2, 1960.
In their “climate change dreams”. Oodnadatta was from a liquid in glass thermometer in probably an older style large Stevenson screen while Onslow would be from an AWS with a fast reacting electric platinum probe.’ (Warwick Hughes)
230
As such the Bureau should adjust Onslow’s reading downward. Ha!
100
el+gordo
BoM claim that Onslow 50.7 yesterday matches the 50.7 at Oodnadatta in outback South Australia, on January 2, 1960.
The 50.7C reading Onslow Airport was 13th January 2022
Original Onslow Station http://www.bom.gov.au/jsp/ncc/cdio/weatherData/av?p_nccObsCode=122&p_display_type=dailyDataFile&p_startYear=&p_c=&p_stn_num=005016
Station:Onslow Number: 5016 Opened: 1886 Now: Closed 20 Jul 2012 Lat: 21.64° SLon: 115.11° E Elevation: 4 m
Highest Daily 49.2C 1st Jan 2010
Onslow Airport http://www.bom.gov.au/jsp/ncc/cdio/weatherData/av?p_nccObsCode=122&p_display_type=dailyDataFile&p_startYear=&p_c=&p_stn_num=005017
Details
Station:Onslow Airport Number: 5017 Opened: 1940 Now: Open Lat: 21.67° S Lon: 115.11° E Elevation: 11 m
Shows Highest Daily 49.2C 11th Dec 2011 in Yearly Statistics but 50.7C for 13th Jan 2022
20
Onslow Airport has just had a massive upgrade of runway, aprons, car parking ..
… the whole airport building has been extended.
I wonder where the weather station is located wrt these big infrastructure changes.
20
More on the Onslow Airport upgrades and temperature “record”
Really hard to identify exactly where the actual weather station is, but if its anywhere close to the new work, there are going to be big heating effects
https://i.postimg.cc/cLgfvf7m/Onslow-airport.jpg
20
That Onslow 50.7 reading could have just been a puff of really hot air that lasted seconds just as the electronic gismo recorded it.
60
Wow, by casual observation of the graph it was measured at the time to be about 0.8˚ cooler in 1910 than now but thanks to BOM we now know is was actually 1.4˚ cooler. Its not that today has got warmer after reprocessing but the past has got cooler! Imagine that,especially considering the stagerring amount of bricks, bitumen and concrete being produced and in place now compared to 1910, the huge increased likelihood of heat island effect on thermometers going forwardin time from 1910 not to mention that those crankly old alchol/mercury thermometerys with implicit damping of short term fluctuations have been replaced by electronic wizardry that can record every puff of hot air as Gaia farts a willy willy that passes by the instrument./sarc
Just risible stuff isn’t it? And they wonder why there are “climate skeptics” out there.
Methinks President Xi would be mightily impressed by BOM staff as faithful loyalists to the cause of undermining ‘western democracy’ and pursuing a defined agenda for the greater glory of communal idiocy.
101
“The mysterious process of homogenization”
There’s no mystery, it’s a straight out case of obfuscation and lies.
140
I hope it gets cold enough to snow so we can go skiing at our place. We’d invite Greta over for a crow sandwich and some humble pie.
80
Greta would confidently tell you that global warming causes global cooling, and would therefore expect you to consume the crow and humble pie.
00
because of statistical revelations.
Lies, damn lies, and statics.
50
Apropos of nothing much, Bourke, Walgett and Moree are at around the same latitude, located on rivers, and are all in open plains. Walgett is equidistant between Bourke and Moree, around 200 km. from each.
These 3 should be ideal for cross-correlation, but they have discrepancies in the raw figures in Jennifer’s graphs during the Moree PO period.
Both Bourke PO and Moree PO showed cooling trends for the maxima, while Walgett council depot was near enough unchanged.
Bourke and Walgett minima are near enough unchanged, while Moree has a cooling trend.
Pre-War, all 3 areas were almost exclusively grazing. Post-War, Moree became more of a farming area, initially wheat, with flood-irrigated cotton from the 1970s. Wheat farming around Walgett was probably 15 years behind Moree. These differences in land use changes may have led to differences in minima and maxima.
140
Talking of Bourke, Jennifer Marohasy asked a pertinent question.
‘It is claimed that temperatures weren’t reliably recorded until after the installation of Stevenson Screens and that this didn’t occur at most weather recording stations in Australia until 1910. A Stevenson screen was installed at Bourke in August 1908.
‘But is the absence of a Stevenson screen really a good enough reason to ignore 40 years of data carefully collected by successive postmasters at Bourke?’
80
I heard this from Keith Frearson, the professor of statistics at Monash University in the 1960’s
“There are lies, Damned Lies
And Statistics”
Our expert crystal screen gazers at the BOM are excellent tellers of lies, damned lies and goddamned statistics.
Yes, sacking all them would save the country a lot of money, time and energy !
50
You are talking of “The Empixellated”
00
Let’s look at the bigger picture.
At the heart of all this is Rudi Dutschke’s “long march through the institutions” which was a plan conceived in 1967 for the Left to gradually infiltrate all government, political, legal, academic, cultural, corporate and other institutions throughout the Western World. As of today, that plan has succeeded.
The Left don’t believe in objective reality. To them facts are flexible and can be adjusted to suit whatever is their current political or ideological objective.
In the case of the BoM, senior management are simply fulfilling the Left’s present ideological belief that there is anthropogenic global warming and so they are altering the facts to suit their agenda.
The agenda is one of economic destruction of the West to be replaced with the domination of other ideological systems including Marxism and its associated removal of individual rights (except for the Elites) we once enjoyed in the West.
The Left’s war against objective truth has been extensively written about by what few objective scholars still exist.
For example see the following article by Charles Haywood. I will post some excerpts. We are talking about liberals in the US sense not Australian or European although Australian Liberals are muchbthecsame as their US counterparts now.
https://theworthyhouse.com/2018/11/04/on-the-subjective-mental-state-of-liberals/
[..]
By liberal, I do not mean classical liberal, or even the American moderate Left that until the 1960s was ascendant in the Democratic Party. Rather, I mean left-liberal, or progressive, the ideology of cultural Marxism, of the Frankfurt School, now dominant in the Democratic Party, as it has been dominant for some time in the academic world and in other worlds controlled by the Left, such as the media-entertainment complex. What goes on behind their eyes? To a neutral observer, the externally visible political actions of today’s liberals are irrational and incoherent. The simplest explanation for their behavior is that liberals are people of low intelligence, and that they are not educated (whatever degrees they may have). An alternative simple explanation is that they desire evil and hide that desire, so their actions and stated reasons do not match. But, while both are possible explanations, it seems unlikely that that any of this is how they perceive the world and their actions. So again—what are the qualia of a liberal?
[..]
The first quale is that liberals do not see reality as it is. What their eyes perceive is not the truth, because everything is filtered through an ideological lens, which removes anything that contradicts their ideology before it can enter their minds. Reality is totally subordinated to political ends, which are derived purely from abstractions.
[..]
The second quale, related to but distinct from their divorce from reality, is that liberals use key words, first inside their heads and then spoken out loud, only after mentally assigning them new meanings designed to serve their abstract political goals. For example, in current political discourse, we constantly hear that anything not Left, and especially Trump, is “corrupt” and “illegitimate.” These words are used because liberals know that anything not in agreement with them is bad, and they know that the words “corrupt” or “illegitimate” designate bad things.
[..]
The third quale, again related but distinct, is emotivism ruling rationality. Any matter perceived by a liberal that affects his political worldview is not analyzed objectively, nor are his conclusions supported logically, but rather with unbridled emotion. Occasional efforts at rationality are made, but upon any examination or challenge, emotion swamps any such attempt. Why? Well, we can’t really tell directly, of course, but this phenomenon seems to let the liberal avoid the consequences of denying reality, to serve to indicate tribal affiliation to other liberals, and to signal virtue and righteousness to the world at large, as well as to the liberal himself.
[..]
The fourth quale is breathtaking arrogance, blended with a nebulous, yet unshakeable, conviction of their own moral superiority, both tied to the belief that history is a wave and liberals are destined to ride it like the Silver Surfer. The origin of this is not anything rational, such as an analysis of the past and measured predictions about the future, but an insatiable desire to lord it over supposed inferiors, feeding the human desire to feel that one is on a higher plane than others. This characteristic is often the most evident in particular political discussions, such as those surrounding global warming. It is reinforced, as with the anti-reality quale, by liberals’ living in a walled ecosystem, where they can daily reassure each other that yes, indeed, we are superior.
[..]
SEE LINK FOR REST
132
Excellent.
There is another way of understanding the mind-set of our betters, precisely articulated in the work of Dietrich Bonhoeffer on the subject of “Stupidity”.
https://medium.com/lessons-from-history/bonhoeffers-theory-of-stupidity-explains-the-world-perfectly-957cbb3fbac1
Ultimately, Bonhoeffer warns: “We must abandon all attempts to convince the stupid person.”
Stupidity is NOT a correlate of intellect – a person working the fields might have had little education and a small IQ and yet NOT BE STUPID.
On the other hand, a university professor with half a dozen degrees and a membership in MENSA might be utterly stupid.
150
Just had a read on Rudi. Very interesting, thanks.
10
Somebody should stop Kellogg giving science degrees to the BoM
40
What I find disturbing is the cult of Climate Change. A person I met yesterday asked if I disagreed with Global Warming. But it hardly mattered because their new fear is Climate Change. Apparently Global Warming and Climate Change are not connected!
In this way the political masters of the UN/China/EU/Democrats/Labor parties have segued the so obviously failed Global Warming into Climate Change.
And Climate Change can mean anything, it certainly means the oceans are rapidly warming when the sky is not. NASA said so. And all is the result of man’s pollution. Specifically fossil fuels, manufacturing and farming. And like all catastrophe theories, none of it is based fact. And without facts, there is no science.
So the BOM can stop fiddling the historic data. It’s all Climate Change now. Cooling and warming are both climate change. And who can deny that? For the BOM, it’s a living and perhaps with all the automation of data collection and analysis and reporting, there is nothing else to do? But organization like the ABC/SBS/CSIRO/BOM/BBC/EU/UN are not allowed to shrink, are they?
120
However I do find amazing that both the CSIRO and NASA have reported massive increases in vegetation, about 15% since satellites started around 1978 which coincidentally is the growth in CO2 over the same period. And the BOM and CSIRO and Scott Morrison do not draw the obvious conclusion. Nett zero is complete nonsense. More CO2, more tree food means more trees, as expected. Ask any farmer.
Consider that in the fake equation of Nett Zero, we try reduce CO2 output . So we stop using fossil fuel, stop agriculture and grow millions of trees. We stopped all the aircraft and many of the cars for two years and CO2 doesn’t notice and keeps climbing. And still the trees keep growing?
How can CO2 go up and tree cover go up simultaneously in the climate science world of nett zero? Wasn’t it one goes up and the other goes down? What people have started to call a Zero Sum game? But it’s obviously not true.
What would be the point of planting hundreds of millions of trees when millions of trees have planted themselves in places which were recently barren. Incidentally in the same time the world population has doubled and I have heard that the amount of land used by agriculture has not increased at all. So this is nature at work. CO2 goes up, trees go up.
And as I have written so often, in the world of real fact based science warming oceans means more CO2 because 98% of all CO2 is dissolved in the ocean and this which means lots more trees. It is so obvious that CO2 is determined by ocean temperature. As is all life on earth. At least the ancient Greeks worshiped the oceans. The BOM/IPCC worships the sky and El Nino is a real nuisance. And now they fiddle the historic data to keep the faith and justify Nett Zero, a disastrous idea which even the CSIRO and NASA have unintentionally debunked.
What the world needs is more wealth, more food, cheaper energy, cheaper faster travel, more commerce and when you look after everyone, eliminate poverty and hunger, there are fewer children and it all balances out. Nett Zero is the most disastrous ideology since Communism.
And Climate Science is Climate Science Fiction a fantasy maintained by the high priests who live well on the public purse.
170
Nature and the Guardian reported the massive phytoplankton bloom in the Pacific immediately after the massive Australian busfires, but said it was caused by extra ‘nutrients’. Like the BOM they have to avoid the idea that CO2 is good, so it is only mentioned at the bottom that the massive output of CO2 happened. But they imply CO2 was not responsible for growth in phytoplankton which was so obvious even from space.
This is part of the de facto conspiracy to blame bushfires on man and find no compensating benefit. And that all CO2 is bad.
The funny thing is that phytoplankton provide about 1/2 of the world’s oxygen. And to do this, they need CO2.
Any scientist knows plants are not built from ‘nutrients’ any more than trees or people are built from ‘nutrients’ or that you could live on vitamin tablets. Trees, people, animals, birds, insects and phytoplankton are built about 98% from CO2. Hydrated carbon dioxide known as carbohydrates. The energy of the sun captured by CO2.
Just don’t tell the Guardian or Nature or the BOM. Without CO2 all life on earth would be dead. And strangely, more CO2 means more life.
And no matter how you fiddle the temperatures, the oceans and sun control them. No us. The animistic religion, the worship of Climate Change has no basis in fact. It is anti science and the BOM is going the same way. Shut it down.
120
The hotter water gets, the less CO2 can be dissolved in the water. So if you have a hot bushfire season, it is likely that nearby sea temperatures are also warmer – el Nino and all that – and therefore the water actually would hold less CO2.
Or to put it another way, if ocean temperatures rise, CO2 must come out of the water, so atmospheric CO2 rises. Or in other words, ocean temperature rises cause CO2 rises – opposite to the usual claim – but consistent with the universally observed rise of atmospheric CO2 level after global temperature increases.
60
All good but I doubt the land, even massive fires heat the water. After all you can put the fires out with water. Water cools very quickly and the heat capacity of oceans is 1400x that of the air. In summer, you head to the beach because it is cooler. And in winter, you head to the beach because it warmer.
Apart from the surface layer, the oceans are completely unaware of the seasons or the local air temperature and could care less.
Which is why when the infallible computer models have abject failure, they blame the oceans. But no one thinks to model the oceans as the driver of the weather, not the result of the weather.
These computer models are rubbish. Plant life is an effect of CO2, not a driver of CO2. Air temperatures and CO2 levels are an effect of the oceans, not a driver of the oceans.
And the strong correlation between weather and the moon is a direct result of gravity changing tides and currents in the deep ocean which changes temperatures on earth. The idea that mankind is anything more than pond scum is just megalomania.
90
The Climate Hysterics are never scientists, unless they work for the Department FOR Climate Change. This whole unbelievable story is based on the salutary story of Chicken Little. And the point, the eternal truth of the parable is that you become a victim if you believe everything you are told. Who listens to fairy tales anymore? Once upon a time man discovered coal.
60
“All good but I doubt the land, even massive fires heat the water. ”
Yes, of course, but I am saying sort of the opposite. El Nino brings warm water across the Pacific to the eastern seaboard of Australia, which in turns sets up weather patterns for hot, dry conditions that lead to a bad bushfire season. It has nothing to do with models, it is established observationally. So all that ash will fertilize the water, even though CO2 levels in the water are lower than normal because the water is already warmer.
I think it is an important point, because the argument is that rising CO2 causes heating, but if the surface water heats up (for whatever reason, e.g. ocean currents) CO2 levels will rise, i.e. heating causes CO2 to rise. And in the data, one always sees CO2 levels rise after heating.
Cheers
10
This one for you TdeF.
This new paper supports your many comments over the years re atmospheric carbon isotope ratios and non-role of the anthopogenic CO2 component in any perceived warming.
World Atmospheric CO2, Its 14C Specific Activity, Non-fossil Component, Anthropogenic Fossil Component, and Emissions (1750–2018)
https://journals.lww.com/health-physics/fulltext/2022/02000/world_atmospheric_co2,_its_14c_specific_activity,.2.aspx
. . . These results negate claims that the increase in C(t) since 1800 has been dominated by the increase of the anthropogenic fossil component. We determined that in 2018, atmospheric anthropogenic fossil CO2 represented 23% of the total emissions since 1750 with the remaining 77% in the exchange reservoirs. Our results show that the percentage of the total CO2 due to the use of fossil fuels from 1750 to 2018 increased from 0% in 1750 to 12% in 2018, much too low to be the cause of global warming.
00
According to Ken, ACORN is not to be trusted.
https://kenskingdom.wordpress.com/2022/01/19/diurnal-temperature-range-and-the-australian-temperature-record-more-evidence/
60
Love Ken’s final brief summary. Says it all.
10
A few years ago I laboriously downloaded about 130 years of temp data from my local BOM weather station which is BALLARAT. It’s a high quality station that I perceived to be free from Urban Heat Island(UHI) Effect. From that data I could very easily calculate the average daily temp for each year (up to present). That calculation is simply the average of the daily max and mins. Then graphed it etc and fitted trend lines. What did I find? Yes, the average max daily temp over 130 years has in fact slightly increased. But the surprising thing was the average daily min temp slightly decreased , but to more of an extent than the max in comparison. So the daily average temp( mean of max and min) essentially flatlines with maybe a hint of a downslope. I have now repeated that for another 6 sites in Victoria and averaged them all for the same result. A number of those other stations were lighthouses. The Cape Otway site is an especially good lication with a long history of data again unblemished by UHI effect. Conversely the lighthouses have the opposite trends to those inland sites in my selection. The max temp decreases and the mins increase but really just cancel each other out. Apart from some up and downs I can confidently say that in 130 years the trend for temps ( expressed as average daily temp) in Victoria is boringly stable with maybe a hint of a downslope.
210
Good work!
70
If you look for “ good” BOM sites which have longer records but aren’t likely affected by urban heat island effect there is no doubt that the year 1910 is important. Using that year as a start point greatly increases the number of sites. Hence, I can understand the BOM justification for using 1910 as the start point. But, that completely disregards the period 1890-1905 which were extremely hot. In particular 1896/97, which is still the hottest year in Australia. Omitting that earlier data makes the past look slightly cooler. So it’s basically statistical trickery that you can use with any natural data observations. Also, if the BOM say Australia has warmed in the last century that is essentially correct in terms of daily max temps only for the last 130 years but doesn’t give the full picture. The devil is always in the detail.
80
I first discovered data altering in 2016, and couldnt get my head around it at all. Then later in a debate about climate change with a 14 year old, I mentioned the cooling the data factor and she scoffed at the idea that they would do that, these are scientists she exclaimed. So its the perfect trick, no one actually believes this would or could be done.
111
It’s very easy to change something where the only available record was probably copied in pen and ink from a reading written in pencil on a page in a note book or a scrap of paper from the readers lunch wrap. Of course, the thermometers accuracy could not be challenged as they were mounted in a Stevenson screen! Doesn’t matter how hard they were to read with the graduations so small that the distance between markings was the same width as the marking – they were all covered in dust from the previous dust storm and you couldn’t wipe it off as you may disturb the liquid.
20
We once looked forward to promise of science.
We are now facing the threat of Scientism.
50
For newcomers here, may I suggest Tony Heller’s videos. He is on YouTube but he can’t post everything there due to Leftist censorship so find him on Rumble and Odyssey for uncensored material.
Tony Heller has extensively documented data fraud at NASA and NOAA in the US and even the BoM in Australia and other government meteorological agencies elsewhere.
60
But then again the more they cool the past the better. It shows that despite that increase in average temperature, it doesn’t bother the environment at all, and that is all that matters.
40
BoM requires an audit, they have stopped talking about global warming.
‘Climate change continues to influence Australian and global climate. Australia’s climate has warmed by around 1.44 °C for the 1910–2019 period.’
30
Remember, it was the present “Health” Minister, then Environment Minister who banned IVM and HCQ for covid treatment and prophylaxis who also stopped then-PM Abbott’s request for an inquiry into data fraud at the BoM.
Whose side do you suppose he’s on? He used to work for Klaus Schwab!
https://www.abc.net.au/news/2015-09-24/environment-minister-greg-hunt-killed-idea-of-bom-review/6803572
Environment Minister Greg Hunt has confirmed he “killed” the idea of a review into the Bureau of Meteorology over claims it was exaggerating estimates of global warming.
SEE LINK FOR REST
110
If you search in duckduck for [Frostgate ACORN adjustments]
you will find my Frostgate 1 article re Melbourne and Frostgate 2 re Adelaide – written in 2012 which refer to historic newspaper articles to illustrate how ACORN data tampering is bonkers.
90
Nice work.
10
for what eg – Acorn is in line with all the other datasets used in climate, including UAH. Surely a global change, measured with a baseline of 30 years should be consistent, no mater which local dataset is used?
114
Well it probably would look consistent… because they are all singing from the same hymn sheet.
40
I think it’s fairly evident that the BOM use selection bias in their contribution of data towards ACCORN. The fact that their corrections ( homogenisations?) always favour a warming narrative is suspicious. Here’s the trend even most skeptics would agree is correct. The earth has warmed since about 1850 up until roughly 1945. Then , there was a cooling, up until around 1980. Then a short sharp warming 1980-2000 which lead to all the hysterics regarding AGW/Climate change. Since 2000 the earths temp has plateaud.
70
Are you saying that ACORN shows basically zero warming from 1980-1996 in Australia.
https://i.postimg.cc/1t8tGzwS/UAH-AUst-1980-1996.png
Cooling in Australia from 1998-2016…
https://i.postimg.cc/xdxGjc9V/UAH-Aust-1998-2016.png
And cooling since the peak of the 2016 El Nino.
https://i.postimg.cc/J4pYpZcQ/Australia-UAH-since-2015-16-El-nino.png
You say it matches UAH, then extract the ACORN graphs for those periods and show us that they match.
Otherwise, stop making random nonsense statements. !
30
Can we agree to accept Roy Spencer’s UAH?
https://www.drroyspencer.com/wp-content/uploads/UAH_LT_1979_thru_December_2021_v6.jpg
Its easier to discuss the impact of ENSO and PDO, watching how the cycles operate. As it stands your argument is on solid ground, if the new plateau in temperatures settles above the line then you have essentially won.
That is, the extra heat in the system isn’t going away.
40
Sure, as long as we consider both the 13 month (yours) and the climate (30 year) from uah
17
UAH clearly shows that the only warming has come from El Nino events.
There is essentially no warming for nearly all the UAH data period.
No warming from 1980-1997
https://i.postimg.cc/bwG1RVwn/UAH-land-before-1998-EL-Nino.png
No warming from 2000-2015
https://i.postimg.cc/tJPLPNVG/UAH-land-after-1998-El-Nino.png
There is absolutely zero CO2 warming signal in the UAH data.
80
speaking of 30 years.
… here is the 30 year trailing average of solar input.
https://i.postimg.cc/sXCJmkNN/Kopp-30-year-trailing-TSI.png
Notice the period since 1960 !
20
Good graph, the solar connection is critical evidence.
10
Only solar energy can charge El Nino cycles.
El Nino events have been the only warming since the cold snap of the mid-late 1970s (pretty much the bottom of the last AMO cycle) that brought about the “new ice age” scare.
20
And maybe cycles in geothermal ocean floor heat releases. Who knows? It’s not like we have even measured the trends in ocean trenches.
30
Very interesting correlation between ocean seismic activity (lagged 2 years) and UAH data.
https://i.postimg.cc/rsrmj4Jr/Seismic_vs_temperature.jpg
But certainly more information is needed before we can call that one.
30
Geothermal heating is the elephant in the room, ‘it significantly alters the global overturning circulation.’
‘The large-scale features that are shown to transport anomalies far from their geothermal source all exist in the Southern Ocean. Such features include steeply sloping isopycnals, weak abyssal stratification, voluminous southward flowing deep waters and exported bottom waters, the ACC, and the polar gyres.
‘Recently the Southern Ocean has been identified as a prime region for deep ocean warming; geothermal heating should be included in climate models to ensure accurate representation of these abyssal temperature changes.’ (S M Downes et al 2016)
10
‘It is concluded, in the absence of other capable causes, and in particular given the evidence of continued ocean warming throughout the Dryas cooling events, that ice age interglacial events are probably caused by a sustained increase in the rate of submarine volcanic heating of the oceans.’ (Brian Catt 2021)
10
There are very few things we can say with certainty in climate science. One of those things we can say with certainty is we know very little about the effects of undersea geothermal activity. I don’t know if it has an effect but I’m in the same league with the experts. They don’t know either with certainty it doesn’t. It wouldn’t surprise me if it had some paradoxical, counterintuitive effect, but who knows. Maybe in 100 years they will begin to have an inkling of understanding what is going on.
There are many papers about the existence of geothermal activity under the Thwaites- Pine Island glaciers complex. But not a peep in AR6. A Mars Bar to anyone who can find any reference to geothermal activity under those glaciers.
10
‘ … we know very little about the effects of undersea geothermal activity.’
Maybe in 20 years we’ll discover the true input, but it will require commercial interests.
https://www.sciencedirect.com/science/article/abs/pii/0377027376900202
00
Earth’s surface is warming. The June insolation over the NH bottomed 400 years ago. It is now beginning to rise, up 0.6W/sq.m on average in the last 400 years. In 1000 years the June average will be 2W/sq.m higher than present. It will peak 9,000 years from now 21W/sq.m higher than present.
The flip side is that the northern winters are cooling. Right now the northern hemisphere is at a minimum of net water transfer ocean to land. Boreal winter precipitation will increase for the next 10,000 years. That means it will begin to accumulate again. The current glaciation cycle started 400 years ago.
The thing about glaciers is that they reflect a lot of sunlight before they start to melt. So there will be increasing summer sunlight but more will be reflected by the accumulating snow. This could be called a tipping point and the NH is about to enter that point.
Northern hemisphere is responsive to insolation input because almost half of the surface is land and its temperature responds almost immediately to insolation. so the northern hemisphere is going to be warming and that will dominate the trend because the southern hemisphere is mostly water and it does not respond much to insolation. The extra winter precipitation in the NH will dampen the winter land temperature decline. On balance Earth is warming until the glaciers become substantial and their ever increasing elevation causes cooling by virtue of the lapse rate. At the present time, land has an average elevation of 800m above sea level and is cooler, on average, by about 5C.
00
30 years is a random value…
… probably chosen because they knew they were in the upward leg of the AMO.
Next 10-20 years as the AMO turns down, the Sun continues into a series of minimum cycles, and La Ninas dominate….. they will have to run and hide from that 30 year time span.
50
Its half of the 60 year cycle found in ice cores and shallow sea cores.
When the AMO turns negative we should expect freezing conditions in Europe, like the early 1960s.
10
This is ten years old but it gives us a glimpse of the rhythm.
https://en.wikipedia.org/wiki/Atlantic_multidecadal_oscillation#/media/File:Amo_timeseries_1856-present.svg
Its exactly 60 years since the early 1960s, so we should expect to see fireworks soon.
20
Finally, there is evidence of Man-Made Warming! Happy New Year People.
20
—From George Orwell’s “1984″.
100
The BoM has also deleted from ACORN all data from before 1910 because it doesn’t fit the narrative.
90
When it comes to precipitation they are fairly accurate. Anyway a few ‘once in a lifetime’ records are being broken in SA, not unprecedented though.
https://www.weatherzone.com.au/news/onceinalifetime-rain-flooding-much-of-sa/535994
30
Great work Chris!
The BOM got its seven day forecast for Adelaide spectacularly right a week ago, with up to 35mm of rain predicted for Saturday. So far it’s 15mm, spot on target. The only problem is – all the district cricketers and other sports affected by rain had a mid-week reprieve when the forecast for today was changed to cloudy and only a 20% chance of maybe 0-2 mm! Even by yesterday it hadn’t changed. I go outside at 6am today and see a rainbow in the west. Check the 5am forecast and it’s for rain and up to 20mm. One of the Bureau’s “nowcasts”!
40
It is a primary rule of all science. You can interpret but never alter the data. You can interpret. You can correct, but you must not alter.
It therefore is quite unbelievable that the BOM is altering primary data sources. And if they are wrong, if their models are proven wrong, they will have ruined the meticulous hard work of thousands of good people who honestly and carefully made readings at the time from instruments which were quite good enough. If anything, it is the modern data which is likely to require more correction for things like the urban heat effect or agriculture or irrigation or capital works, not the old data.
So who approved the very idea of changing the recorded data? It could not have been a scientist. This is blatant political interference in science, an ideology you would expect in a communist state. Changing Climate history in the name of science and their friends in the UN. We are paying their wages, not the UN. As Australia has some of the best old temperature records South of the equator, is this coming from the IPCC? Cui Bono? Who asked for this to be done? Not the people of Australia.
And when is all the data from before 1909 going to be added, the data which should show it was much hotter in 1890-1910 than it was from 1990 to 2010? Surely this unbelievable effort at improperly changing real data could be directed at publishing and adding the real data from the States which was entrusted to the new BOM?
Changing real on the spot, at the time, hand recorded data is equivalent to blowing up the statues of Buddha by the religious extremists of the Taliban. It is unbelievable and even more unforgivable because they are charging the people who pay their wages for the appalling vandalism of their own heritage. The BOM did not record this data, people did. It’s not their data and it’s not science. It’s anti science.
100
Science?
What’s that?
10
Another trusted bureaucracy bites the dust WRT integrity.
Just like so many others with employed public “servants”(sic!) whose productivity and “facts”
are bound to their politics rather than to reality.
A good “enema” is required here to clean them all out.
The health departments are mostly staffed by MBBS losers who could not survive outside but there
is no excuse for such as the BOM while Defence is drowning in the diversity flood and the
avalanche of dishonest ABC stories about “what we supposedly did on the front line” created by
people who would lie down and scream if it were they who were in the same position.
It is all part of the same planned destruction of the integrity and competence of the West.
Having typed that I can honestly say that 21-22 summer in NSW has been the mildest of my life and
wearing shorts and a T-shirt in daylight Dec/Jan has had me shivering on not a few occasions.
Must be that CO2 doing all that.
Nice of Serbia to ban Rio-Tinto. Childish, but then so was OzGov.
I bet the Chinese dive in there.
40
“Nice of Serbia to ban Rio-Tinto. Childish, but then so was OzGov.”
Of course, all Govts are just a bunch of intermediate-school boys trying to one-up each other and bad-mouthing other kids they don’t like. They do a bit of wrestling and have a punch-up, then they ignore it and be mates again.
It literally is “A Great Game” to them, they have nothing to lose and the wealth & lives of whole populations to throw in the pit. I’ve never found out why people need someone to rule over them.
30
Guess it’s fun to argue over minutia.
Weather clock watching is an evolutionary neurosis.
But IMHO …
The ‘average’ earth temp navel gaze is complete doo hockey.
(The fact that the damn thing is as stable as it is, means there’s a God.)
Just stand out away from the light pollution, gaze at the stars, and then tell me again how human ‘science’ will master the universe.
I’ll wait patiently for warp drive.
And to join the peace and enlightenment of the Federation of Planets.
In futile resistance of the Borg implants.
Thank God the Borg are confined to this remote rock in the Milky Way.
At least so far.
10
Have I got it wrong but is it not logical if they wanted to adjust past temperatures to reflect site changes and the Urban Heat Island effect either modern temperatures should be adjusted down and/ or older temperatures adjusted up to make comparisons relevant. The exact opposite appear to be happening.
The fact that the BOM is not transparent reminds me of a quote attributed to I think Michael Mann and the lack of transparency with his hockey stick, “ Why would I release my data if all you are determined to do is find fault with it.” I apologise if ii have ascribed the quote to the wrong scientist but it reflects the sentiment of many activist climate scientists who feel uneasy about their work getting any scrutiny. When trillions of dollars are expensed on the basis of this science I would’ve thought taxpayers world wide are entitled to full transparency. In fact it is proper scrutiny that is used to validate science and the assumptions that underpin it.
30
Zig
The email was to Australian geologist Warwick Hughes and the author was Phil Jones at the University of East Anglia. Search this Jo Nova blog under my name plus “that famous email explained”. Geoff S
20
“I am labelled a ‘climate denier.’ Not because I am wrong but because that is the way the system works.” William M Briggs
20
Well my ‘lived experience’ is that Brisbane is having the coolest January since before forever. High 30s, low 40s day after day were normal! This year it’s been high 20s low 30s. There’ve been nights that I’ve even had to put a shirt on!
60
I’d back that for the backside of the Blue Mountains in NSW- Gone are the days of no shirt, its a T-shirt, a long-sleeved shirt over that, a pullover and jeans in the mornings during mid-January!
(Even had the electric blanket on one night!)
70
I’m on the tablelands behind you and can confirm it feels like Autumn.
00
Day/Night temperature spread fails to confirm IPCC prediction
10
The BOM are, basically, just LIARS. What is this green/ALP/socialist/Canberra bubble entity got for us next? ACORN 3?? The BOM will go to extremes to try and convince society that AGW is real. If there was a political party that would cut funding for the BOM and the ABC, I would support.
50
Pure Hocus Pocus for a million dollars a day…………………….
20
I am not a young person. When I was, I took a great many meteorological observations.
What has continued to bug me is the fact that people now claim to need to revise the observations I and many others made. Even more than a century ago, there was good knowledge about how to site the instruments in order to ensure accuracy, like housing them out of direct sunlight or rain (there was a lot more to it than that, of course). Beyond that, instruments, thermometers in particular, were calibrated carefully. I was taught to use two sets of professionally calibrated thermometers, and compare them regularly.
The same goes for other types of measurements.
An observation I wrote down 30 years ago is an accurate record of the conditions on that day in that place. And the care and accuracy I used then was also used by observers generations before me. Honestly, a 100 year old Weather Service thermometer is a wonderful precision instrument, less liable to develop errors than one used now.
What is more, calibration of thermometers is based on well known physical principals, which have not changed. As standards progress, it becomes possible to measure to more decimal places, but even antique methods were well within accepted and reasonable tolerances.
120
Well said Max.
This deliberate down-grading of the work of past station operators is really quite disgusting.
They were more diligent and precise in their work than anyone at BoM would likely even be capable of nowadays.
60
Which brings us to the point that there is a wealth of diligent observation going to waste.
https://theconversation.com/delving-through-settlers-diaries-can-reveal-australias-colonial-era-climate-72652
30
Graham Lloyd seems to have developed over the years from an AGW warming commentator to an open minded, professional journalist. Congrats Graham!
It would appear the sciences behind AGW and COVID-19 vaccines follow the same path of what constitutes modern science. Governments govern based on what their chief bureaucrats determine is the meanings of data analysis for the day. This allows the politicians in general to follow the universal campaigns arising from mainly the EU. It separates the actions of the politicians from the responsibility and outcomes for what THEY declare is the science of the day and the future. That was the meaning of the Hunt denial of Abbott’s demand to investigate the BOM. To have allowed that would have made the politicians forever liable for the disasters their edicts precipitate. We see the same lack of accepting open debate in the COVID-19 responses, just as no debate is allowed on AGW. Our own governments, in what is supposedly a thriving Democracy, are using extreme left cancellation power against anyone who disagrees with them / their bureaucrats. The governments take no prisoners, label everyone that argues as sceptics or antivaxxers (regardless of viral illness experienced) and the people take it up like lambs to the slaughter. Even the people don’t appreciate the damage being done to their privately run economies, lost jobs, kids, offspring futures etc.
30
It is fascinating this homogenization exercise conducted recently by the BOM led to such results. I have always wondered what weather stations truly reflect their mappable environment. Bendigo used to have its weather-recoding site adjacent to the Bendigo goal. It was moved in recent times to the Bendigo airport. Given the topography around Bendigo, the weather station was moved from an exposed location to that of being in a ‘shadow’ location away from the prevailing SW airflows. It is now an automatic station. So when it rains the western side of Bendigo receives nice rain/showers and the eastern side represented by the airport records significantly less. Rain gauges in the neighbourhood give testament to this simple difference from the airport in its rain shadow.
Recently I did a traverse from East Bendigo to the Eaglehawk tip. The temperature varied (quite properly) from one side of Bendigo to the other by 2C using a reasonably reliable Nissan temperature readout. On the return trip over a 30 minute period, the home temperature was repeated on arrival. A rudimentary experiment but rather telling. The question remaining unanswered is where should the automatic weather station be located to best represent the weather conditions of Bendigo.
These variations over such a short distance make a mockery of the homogenisation exercises conducted on say Alice Springs and other locations.
20
Anybody wanting to find out more re the warming influence of ACORN 2.2 vs ACORN 2.1 should go to http://www.waclimate.net/acorn2/index.html
If you just search Google for “acorn 2.2” the #1 site at the top of the results takes you to this page.
If you devote about 10 minutes or so to reading the text and charts, the page explains when and what happened for ACORN 2.2 max to warm 0.06C more and min 0.11C more than ACORN 2.1 when comparing the first decade, 1910-1919, with the last decade, 2010-2019.
I’ve even added a graphic to the page today that makes it easier to understand how most of the cooling shift was between 1910 and 1939. You can view the page on a tablet or desktop, but it gets a bit messy with a phone.
Be aware that when the BoM says, for example, that 2021 had a mean temperature anomaly of 0.56C, they mean it was 0.56C warmer than the 1961-90 average, which has nothing to do with earlier years.
The 0.06C absolute average max and 0.11C absolute average min difference between ACORN 2.2 and ACORN 2.1 is a comparison of 1910-19 and 2010-19.
The annual temperatures are averages calculated from the ACORN 2.1 and 2.2 daily temperatures for each station that are downloaded from the BoM site. They are calculated in accordance with ACORN protocols re minimum permissible days of observation per month to account for too many missing days.
The BoM could clarify by making available their annual absolute averages, not anomalies, for the 104 non-urban ACORN stations in both ACORN 2.1 and ACORN 2.2 for every year from 1910 to 2021.
20
Hi Chris,
Can you confirm that it was your data the Dr Marohasy used, and became the basis for Graham Lloyd’s article in The Weekend Australian?
00
And if I may ask another question, this time related to the Acorn data sources from Perth, I wasn’t aware that Perth Airport data was somehow included instead of data from the three locations of the Perth main sites -Mt Eliza, East Perth and Mt Lawley. Why would Acorn suddenly switch away from the Perth CBD data to data from Perth Airport, a much hotter location?
20
Hi Graeme … with regards your first question, yes.
Re your second question, I’ve sometimes wondered the same. The ACORN structure of the location is …
The airport site (9021) opened in 1944. ACORN-SAT uses Perth Regional Office until 1963 and utilises the overlap period between 1964 and 1966 to merge this into the Airport data. Regional Office data after a second site move in 1967 were not used in ACORN-SAT.
There are some fairly significant differences between the immediate climate of Mt Eliza, the shift to the inner city/urban heated Wellington St, and then Perth Metro in Mt Lawley which is site 9225 used by the media, but not ACORN, as representative of “Perth”.
Mt Lawley is much nearer the coast than the airport, so closer to where the different Perth Regional offices were observing, but I assume the BoM chose Perth Airport for ACORN because the shelter is in a more open area with less urban heating.
It remains up for debate whether AHI (Airport Heat Islands) generate their own artificial warming through proximity to large swathes of black tarmac landing strips and occasional wafts of jet exhaust detected by the one second readings of automatic weather stations (which became the airport’s primary instrument in late 1996).
Perth’s eastern urban infrastructure has also developed significantly since the 1960s and the “dome” of urban heat across a city is likely to influence a station whether it’s in Mt Lawley, which is a long-established suburb, or on open ground within the airport.
ACORN homogenisation supposedly corrects all of the differences between Mt Eliza, East Perth and the hotter airport location so that early 1900s temps are relevant to today’s observations, but that is obviously a matter of opinion.
Perth Airport 9021 wasn’t among the 25 ACORN stations updated in ACORN 2.2, so the location’s daily temp data is the same as it was in ACORN 2.1.
ACORN averages the airport’s (Mt Eliza in reality) 1910-1919 maxima as 0.66C warmer than the original RAW observations, an example of adjustment to compensate for the airport’s hotter inland day temperatures.
However, ACORN also cools the airport’s 1910-1919 minima by 2.13C, with the overall result that RAW shows 1.25C mean temperature warming from 1910-1919 to 2010-2019 while ACORN shows 1.99C mean temperature warming (or 1.29C for RAW and 2.02C for ACORN if you prefer 1910-1919 to 2011-2020).
I think a better ACORN structure would be to use Guildford Post Office, about a kilometre from the airport, as the preceding station. Considerably less adjusting would be required and in the RAW data Guildford Post Office had a mean temperature of 18.3C in 1911-40, which compares to Perth Airport’s mean of 19.1C in 2012-21 : a mean temperature increase of 0.8C.
Guildford Post Office mean annual rainfall in 1911-40 was 875.1mm, compared to the airport’s 666.0mm in 2012-21, so cooler max and warmer min in 1911-40 but reduced cloud cover being a likely contributor to the 0.8C mean temp increase.
Incidentally, Perth Airport recorded six consecutive days of 40C+ from 31/12/1964 to 5/1/1965, so yesterday’s six straight days of 40C (at both Metro and Airport) is a record in the context of Perth Regional Office and Perth Metro, but it simply equals the 1964/65 record heatwave experienced at Perth Airport.
10
It seems if there was an increase in the rate of rise in temperatures over the last 150 years created by CO2, that there would be a commensurate increase in the rate of SLR. Look at all the tidal gauges. Do you see an OBVIOUS AND SIGNIFICANT inflection point in the tidal gauge graphs? Looking at the longest running tidal gauges, like Brest, or others across the globe, where are the changes in the rate? They all have what appears to be changes on a 60 year cycle. But other than that, where is the permanent increase, that is obvious and significant. There are many papers that say there is no significant acceleration in SLR. Funny that.
I’m not talking about the satellite data. I get it and they have their own issues. I mean only tidal gauges. There is no obvious, significant and permanent increase in rate rise that would follow the supposed effect of CO2.
30
[…] The Bureau of Meteorology finds Australia is still getting colder a century later […]
00