The headline is tongue in cheek, but the message is serious.
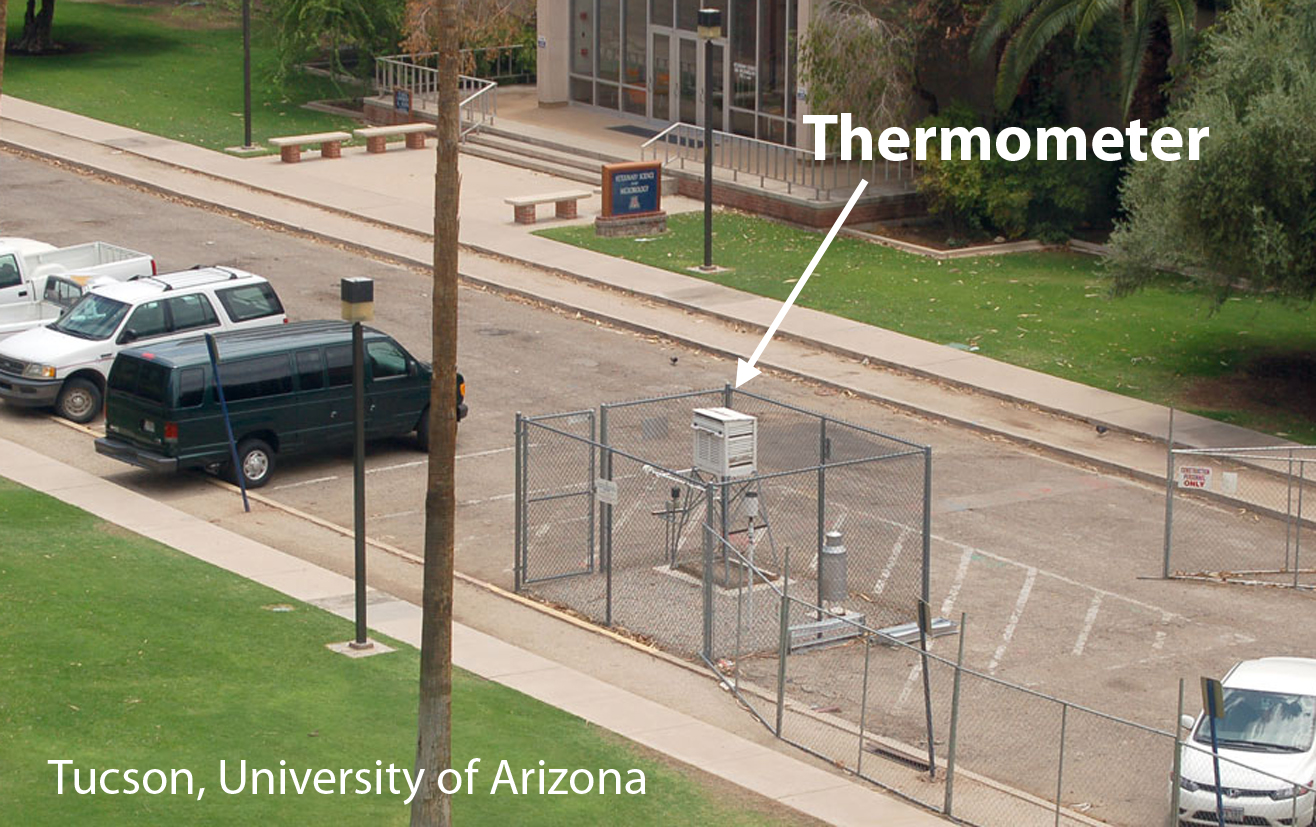
Look at these pictures of NOAA’s U.S. temperature stations. These thermometers on the ground have recorded faster temperature rises than sensors on satellites and weather balloons.
Lucky heat doesn’t rise off asphalt…
Things may have looked different at this site in 1909.
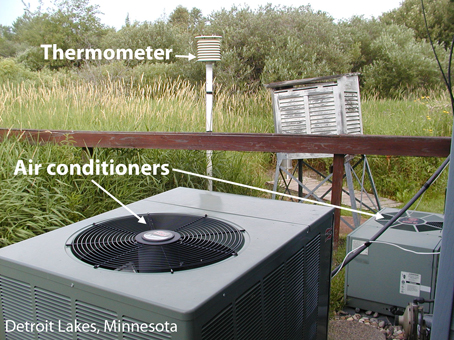
Would you trust data from sensitive thermometers in parking lots surrounded by concrete, beside busy roads and within meters of air conditioning outlets? NASA does.
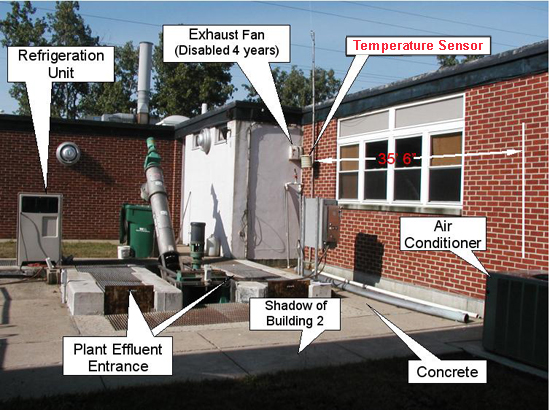
Note the small air-conditioning exhaust fans above are embarrassing enough. But industrial ones are fair game too.
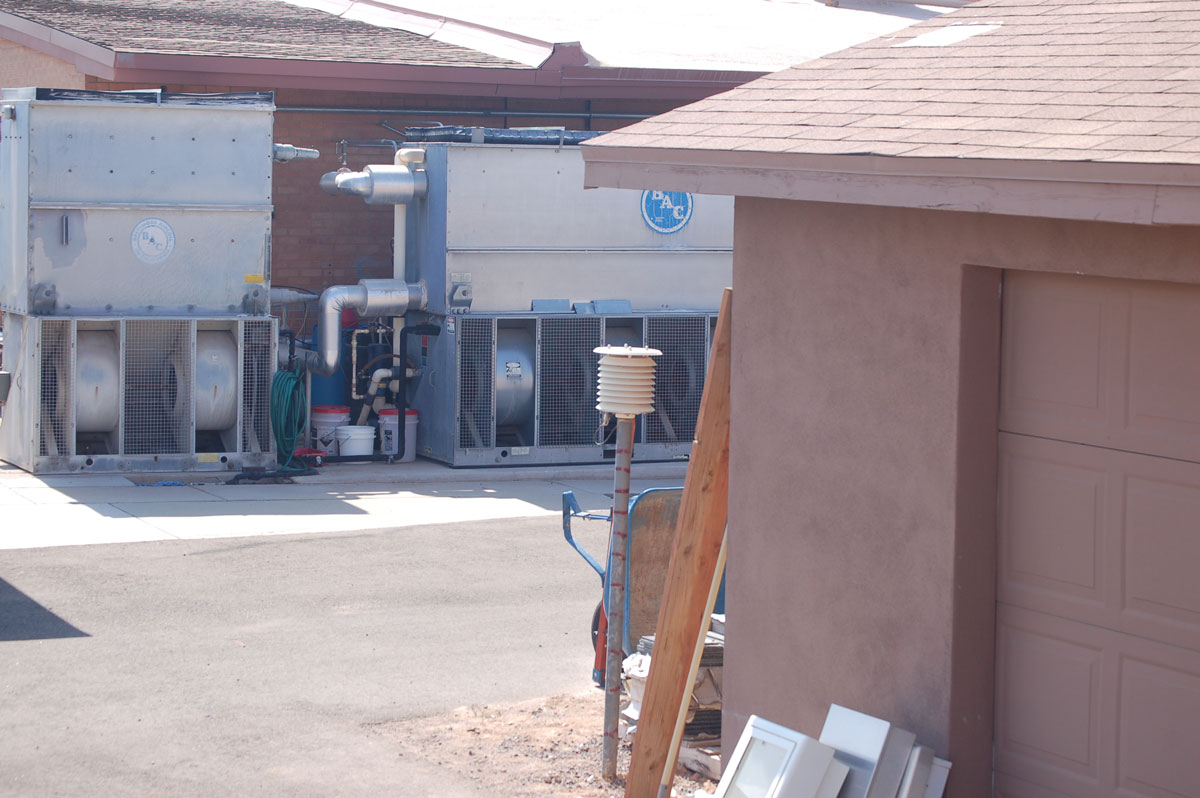
Could they put sensors near even bigger “exhaust fans” than industrial air conditioners?
Yes. They found the largest industrial exhaust fans in the world.
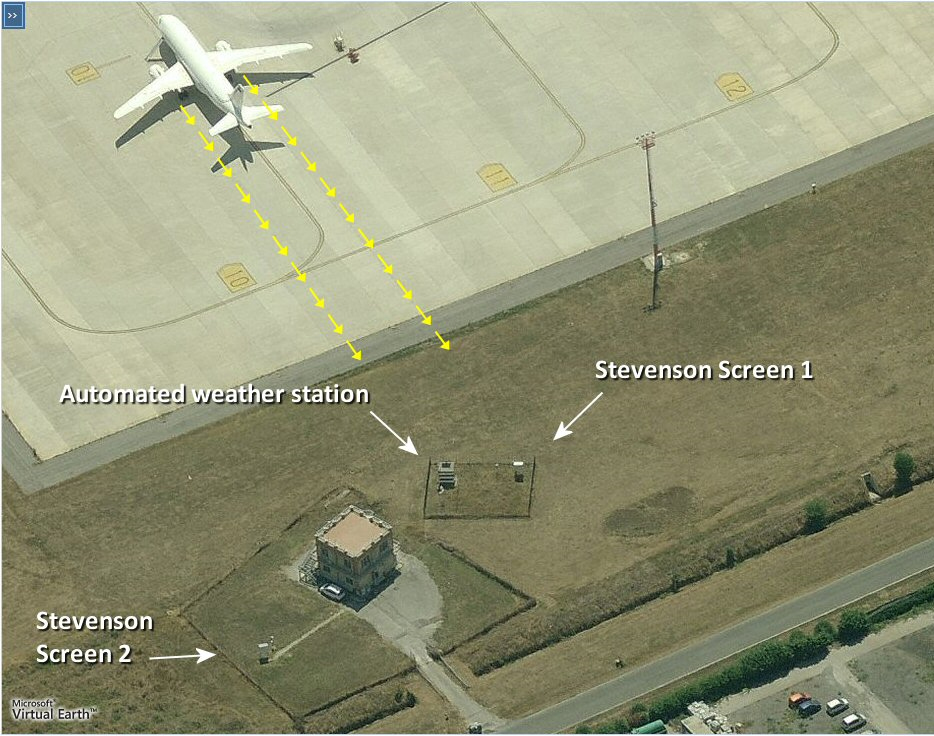
Seriously, who would put a sensor which gets periodically blasted with hot air from machines that generate anything up to 100,000 horsepower of thrust? Not to mention the two square kilometers of tarmac that absorbs heat 12 hours a day. Is there any chance that a thermometer so close to all that asphalt or concrete would record the same temperature as one in a field of cows?
I imagine that airport site is not maintained by NOAA, since it’s in Italy. But the point is very important. Of the four global temperature sets, GISS relies heavily on airports, and frequently reports higher average temperatures than the satellites do. Airports contribute 554 of the 1079 readings used to come up with “global temperatures”, and 121 of the 134 used in the US. There are thousands of other sites around the world that NOAA get data from that they don’t use.
So 50% of the global surface statistics come from sites close to giant heat sinks.
Shouldn’t we have sites on farms nearby to compare the difference?
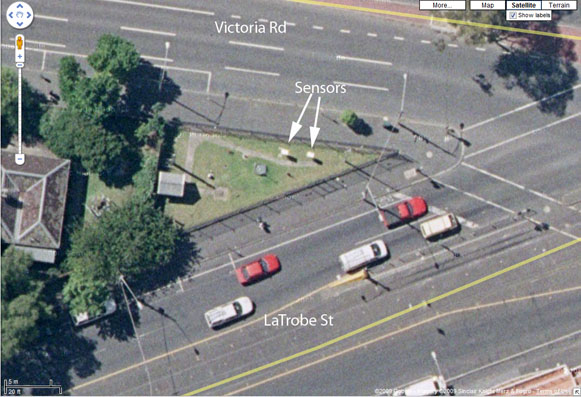
In Melbourne, Australia, one historic temperature collection point is on the corner of LaTrobe St. and Victoria Rd., sandwiched between nine lanes of traffic and a tram line. This is one of the busiest streets in Australia. These thermometers have been at the same spot since before the Ford Model T was invented.
How could recorded temperatures not rise under these circumstances?
AGW Reply: Modellers have corrected for the Urban Heat Island effect.
Skeptics say: Modellers have adjusted for “measurable and predictable data biases,” but they haven’t done a site-by-site hands-on survey to account for heat sources nearby. (These photos were taken by volunteers for a blog: surfacestations.org.)
We can’t trust thermometers in places now surrounded by engines, concrete, and air conditioners.
Source: For hundreds of other examples like this see SurfaceStations.org.
Thanks to Anthony Watts for collecting an army of volunteers together to take these photos and giving permission to use them.
Page 6 Page 8
Notes on Page 7 of The Skeptics Handbook
I put more photos here than I could fit in the Handbook. The number of shots with rampant breaches of the standards is extraordinary. These are hardly cherry picked. Watt’s survey of over 1000 stations shows that about 89% of them breach NOAA’s standards. That’s right, one out of ten sensors is sited correctly. Bureaucratic ineptitude knows no bounds. I’d like to satirize the placement of sensors, but since they put finely calibrated equipment next to reverse cycle heaters, and Boeing turbines, I mean, really, what can I say?
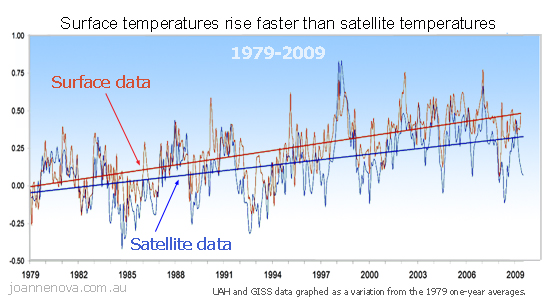
This graph shows how the recordings from satelites have not risen as fast as the recordings from the surface sensors. Since 1979 there have been millions cars, car-parks, air conditioners, extensions to runways and extra flights. At least some of the recorded “global warming” shown only from surface sensors is due to the Urban Heat Island effect.
Anthony Watts is a retired meteorologist who noticed the problem, and organized the volunteers, and site surveys. NOAA has responded to his study, curiously initially without mentioning his name. That was corrected about a month later. Discussing work by “he-who-we-shall-not-name” was more like a Harry Potter plot than an official government document. NOAA’s main rebuttal is that if you compare rural to urban stations there is very little difference. Anthony replies that the way they define rural and urban stations means that there are good and bad stations in both sets. After all, even in a small town, if the sensor is in the carpark, it’s still not reading the same temperature it would if it were over grass. They’re not comparing apples and oranges, they’re comparing two bowls of fruit salad and finding (surprise) that they are quite similar. Well, they would be wouldn’t they?
You can support Anthony with donations at his site Watts Up With That. Like many skeptical scientists he has worked pro bono, in this case to expose failings in an organization that gets $4 billion dollars a year. See my article here on grassroots unpaid workers fighting giant bureaucracies. They could use your support.
As usual, the glaring question is why newspapers won’t print photos of temperature sensors like these? How much respect would the public have for the worlds hallowed climate science experts when none of the Unskeptical scientists who claim concern for the climate has expressed any concern for the data they base their decision on? Where are the press releases from Michael Mann, James Hanson, Schnieder, and others calling for NOAA to lift it’s standards? You can be sure it would be front page news if trees had grown up to shade the surface thermometers and they were under-reporting the temperatures.
The bias in the media and the bias of researchers is loudly announced with the silence.
Links
Is the US Surface Temperature Record Reliable? Watts report.
Watts discusses Airport weather stations
NCDC “talking points” (about he who was not be named).
Watts reply to the NCDC.
Acronynms
NOAA – National Oceanic and Atmospheric Administration.
GISS – Goddard Institute of Space Studies


Another great posting Joanne! I just received this today! It’s “15 Australian Political Cartoons that U.S.Press won’t Print!” http://patriotupdate.com/exclusives/read/44/15-Australian-Political-Cartoons-That-The-American-Press-Would-Never-Print Very good laughs!
You people down under do a very good job! Loved them but this is why I presented this to this post by what you stated at the end, “The bias in the media and the bias of researchers is loudly announced with the silence.” This is very true as you can see above. I’ve never seen these and My Home page “Townhall.com” is a conservative site that would have posted these had they reached us here.
Joanne, did you hear that Senators Kerry and Boxer have their version of Cap & Trade? I haven’t read it but I’ve read some reviews and they state it’s accually “worse” than Waxman-Markey!
Keep it up Joanne, sure could use you here in Washington right now!
20
Thanks Denny, very funny stuff. Unfortunately all really good humor always has more then a grain of truth, some of these are way truer then I’m comfortable with.
20
“Beware of the people that want to save the world. They might want to save the world from you.” – myself, 2009
11
The people who use such data say they are only looking at the evidence and find man is causing global warming. They are partially right.
The measured temperature under these circumstances is going up. As a consequence, the average of all similarly measured temperatures is going up. It is also clear that man is causing the average of these measured temperature to increase. However, one slight thing is overlooked. The level of CO2 in the atmosphere has vanishingly little to do with the increase. Its the man caused change in the local physical environment of each of the thermometers that results in the increase in temperature.
Its astonishing that they can get away with such a fraud and demand that all energy production necessary for modern technological civilization be dismantled to “save the earth”.
20
I know this is off topic, but I couldn’t resist after reading Denny’s post with the 15 Australian cartoons …
Liberal Media Hypocrisy
It would be funny if it wasn’t so tragic and nauseating.
10
Anne-Kit,
Its a clear case of psychological and intellectual projection on their part. They accuse their opponents of that which they are most guilty. Their hope is that no one will notice. The repetition of a lie is supposed to generate the perception of truth. Further, they believe, perception is reality. They conclude that he who controls perception controls both the perceiver and the perceived. Hence there is to be only one story told – theirs.
20
I would be amazed to find that science was the one thing government did well. Remember Harry Brown? What ever the government tells you turn and look 180 degrees away.
10
Thanks Jo,
this point about so many temperature stations being at airports is really important. It seems to be particularly bad in Australia – I had a look at the sites used by GISS, picking out those that are still in use and that have more than 40 years of data. There are about 40 of these stations, and about 30 are airports!
20
Paul, that’s really interesting. If you have the full list, I’d like to see it. Lets get the data!
Jo
10
It’s actually worse than you think. Airport sites are most frequently used to “correct” for Urban Heat Island effect of “nearby” urban stations (I put “nearby” in quotes for a reason you will see shortly). And island airbases, like that at Diego Garcia, get “gridded” to produce the surface temperature over thousands of sqkm of ocean.
The thermometers at airports were never put there to monitor global temps, but to provide critical flight data for aircraft taking off. For the purposes of flight data, there’s nothing wrong with having them near the tarmac. Not so for monitoring “global” temperatures and calculating anomalies.
E.M. Smith did a great analysis of how GISSTemp is calculated. At least Hansen makes the data and code available, unlike HadCRU. The finding is essentially, “It’s the thermometers.” That goes from poor siting issues like those demonstrated above, to more thermometers in the tropics and mid-latitudes while reducing the number used in calculations from the Northern latitudes.
As one example, E.M. found that the UHI in Pisa, Italy was adjusted by using a “rural” station in Algeria…that happend to be a commercial airport. Hmmm.
10
I have always thought that urban temperature would be best taken at golf courses.
Most of the wheeled traffic is electric, Stevens screens could be placed in barrankas or other waste areas where grass cutting equipment does not go.
I am sure that Hansen could write a wizard algorithm to offset the odd bonk by a golf ball (an upward adjustment for the ‘heat of the moment’ effect).
An added benefit would be seeing geeks servicing the thing in plaid pants.
By the way, what ever became of Lukey. Banned? Molting? Thankfully there was a Robin to take his place.
10
After three decades of continual increase, the mean Earth temperature has been decreasing steadily since 2002, as precise satellite measurements show. As a result, the steady rise in sea level has stopped since 2005.
World climate is a regular quasi-periodic phenomenon (see Fig. 2.1 of http://www.fao.org/DOCREP/005/Y2787E/y2787e03.htm ) that is driven by solar activity with a period of 75 – 85 years (Gleissberg cycle). Because of this regularity, it can be stated with absolute certainty that the mean Earth temperature will continue to decrease until 2040.
1. There exists an extremely close correlation between the changes in the mean global temperature and the small changes in the rotational velocity of the Earth – two physically unrelated geophysical quantities – (see Fig. 2.2 of http://www.fao.org/DOCREP/005/Y2787E/y2787e03.htm), which has been ignored by the mainstream climatologists, and leaves little room for a human influence on climate. Note that temperature lags rotation by 6 years. This close correlation results from the action of an hitherto unknown form of gravitational waves, galactic vacuum density waves, on the Sun and on the Earth (see http://www.icecap.us/images/uploads/Lobert_on_CO2.pdf ).
2. The orbital periods of all Solar System planets are very close to integer multiples and integer fractions of the periods of the Hale (22.14 years) and the Gleissberg (84 years) solar cycles. (See the posts of September 26, 2009 and October 6, 2009 in http://www.pakteahouse.wordpress.com/2008/09/15/a-new-book-elucidates-the-life-and-work-of-Dr.-Abdus-Salam ). This provides further evidence for the existence of super-Einsteinian gravitational waves and of their action on all celestial bodies of the Solar System.
The Close Correlation between Earth’s Surface Temperature and its Rotational Velocity as well as the Close Correlation between the Planetary Orbital Periods and the Periods of the Solar Cycles Prove that Climate Changes are Driven by a new form of Galactic Gravitational Waves (Vacuum Density Waves).
Progress in climatological science can only be achieved if the above physical facts are looked into in full depth.
Ref.: a) The posts of September 19, 2008 September 26, 2009 and October 6, 2009 in http://www.pakteahouse.wordpress.com/2008/09/15/a-new-book-elucidates-the-life-and-work-of-Dr.-Abdus-Salam
b) http://www.icecap.us/images/uploads/Lobert_on_CO2.pdf
10
Dr. Gerhard Loebert,
could you provide references which have empirical data supporting the gravity waves and other new physics??
Thank you.
10
Joe,
have you posted anything about the decrease in weather stations used by GISS?? This post reminded me of this complementary issue.
Here is a clip that WUWT posted a while back:
http://wattsupwiththat.files.wordpress.com/2008/03/stationhistory_v10.wmv
It shows the stations by year. They steadily increase till about 1990 when there is a BIG dropout followed by more. This tends to drive home how ridiculous the idea is that we can actually compute a real global mean from sparse data!!!
Many people still think that the NOAA and GISS algorithms get close enough. They completely ignore the CHERRY PICKING done by including and excluding stations. How else did we end up with all those airports you point out??
10
Well, I’m packing up to go live on another planet – this one’s getting too weird …
Barack Obama has won the Nobel Peace Prize for, wait for it … his “efforts to reduce nuclear weapons [??? when, where? Did I miss it??] … and climate change”.
There was a time when the Nobel Prize stood for something. Alfred Nobel will turn in his grave.
10
Brought to you by the same idiots who thought it was a good idea to give the Peace Prize to a terrorist in 1994 (Arafat) and snake oil salesman Gore and the loons of the IPCC in 2007.
Of the other 204 nominees, I’ll wager that most had far more to their credit than Obama’s postage stamp resume. He’s given some speeches, but accomplished virtually nothing.
When Iran announces that they actually have the bomb and delivery means, would the Nobel Committee be so kind as to revoke the prize?
Yes, the world is upside down when giving hopey changy speeches merits a Peace Prize. Norway should be ashamed.
10
Anne,
I disagree, the Nobel Prize does stand for something. It stands for the exact opposite of the words attached to it.
This is a new age. One really does not need to accomplish anything, All one needs to do is SAY that you are going to do it. Even if you actually accomplish the opposite of your words you still get credit for “good intentions.” Especially if that opposite is actually your not so hidden agenda.
It took Carter a full term in office (1977-1981), the establishment of the Iranian theocracy, and over decades of continuous denigrating America to win the Peace Price. It took Obama being in office for only nine months to receive one. Its not because Obama has actually done anything to advance peace, he has only promised. He has promised to deliver the wealth and sovereignty of the US into the hands of its enemies and to enslave its people to its government.
The Barbarians are not just at the gates of civilization, they are in high office with the power and intent to return the entire population of the world to less than a hunting and gathering tribal existence.
20
And the ultimate irony is that these particular barbarians are the least capable of surviving such a world.
20
JLKrugerer: And the ultimate irony is that these particular barbarians are the least capable of surviving such a world.
Its not irony if they have no actual intent to survive. As I pointed out, their words are not indicators of their intent. THAT can only be judged by their actions.
Do not interpret their goals from the perspective of your own value system. They do not share our values. They seek the exact opposite: the equality of non-existence – the negation of reality. They demand that which does not and cannot exist and deny that which can and does.
They do not seek to master. They seek only to destroy. They are total nihilists desiring only destruction of anything they themselves cannot achieve. They hate the good for being good because they hate their existence as human beings as much as they hate the responsibility for being human.
20
Concur with your assessment, but still in the end, those of us who have the skills to survive, will rebuild. The sheeple in the middle will suffer most, but it’s exactly what they deserve.
You sound like you’ve read a bit of Ayn Rand, a woman who knew full well what these people are all about. 😉
20
Some people are just born to be slaves.
Leaders take their money and give it bankers,
and the crowd roars.
Whoh… reuters … ? Wait, Anne-Kit, … :-0 … that announcement was not on The Onion. O-M-G.
Announcing the new: Nobel Hope Prize : for people who haven’t actually created any measurable peace, but have given us hope that it might happen. Go O-B.
Shame about all the people who have actually done something that we won’t hear about.
But he is an excellent speaker.
11
I guess it’s now been confirmed, we live in a world of ALL style and NO substance.
10
JLKrugerer: You sound like you’ve read a bit of Ayn Rand….
Only since 1962.
20
Anne-Kit Littler:Post 15, hey, I’ll go with you if you have room! We could laugh together as we wave from Mars! I have to warn you. It gets pretty cold up there. I’ve been in -80F chill factor in Alaska and it’s “no” fun! Nothing stays warm!
10
Denny and Ann-Kit Littler, don’t worry about Mars being cold. How long could it take before man made global warming reaches Mars? We had -85 wind chill in Chicago back in 1980 or 1979. I think we may test that record this year.
10
Anne-Kit it is too weird. Those were my exact same thoughts. Nobel did not intend to award try hards but those who had achieved.
20
The Nobels, now the butt of many jokes… Andrew Bolt
Obama wins Olympic Gold!
O-B has promised to run the 100m in the 2012 Olympics in under 9.5 seconds. He’s captured the worlds attention.
10
Just back from the Annual State Conference of the West Australian Liberal*) Party. The first Policy Motion up for the vote was this:
“That the Liberal Party of Australia (WA Division) calls on the Federal Parliamentary Party to delay any negotiation with the Federal Labor Government on the design or introduction of any emissions trading scheme (ETS) until after the climate change conference in Copenhagen. We also ask that any future decision to introduce an ETS be in line with the actions taken by Australia’s major trading partners and consistent with the latest available scientific research.”
I am delighted to report that the motion was passed with a massive majority. Note the important last clause (highlight mine).
Many speakers questioned the science, not least the proposer and seconder of the motion who made impassioned statements about the lack of consensus and the growing number of dissenting scientists, not least coming out of Australia.
10
Oops, forgot footnote for non-Australians: *) Liberals in Australia are the conservative party.
10
Anne-Kit Littler – post #28
I read with your pleasure your account of your attendance at the annual state conference of the WA Liberal party. Then I read the article in the Austalian – see link below. Is this the same conference? I was just curious.
http://www.theaustralian.news.com.au/story/0,25197,26194497-601,00.html
10
Perhaps this article is more accurate!
http://www.theage.com.au/national/how-the-west-was-not-won-on-climate-20091010-grmj.html
10
Yes, Bruce, the article from The Age is pretty much a true account. I was there, I was one of the people putting questions to Malcolm, and the motion quoted above was what was passed, as it says in the article.
I don’t know where The Australian got their information from – perhaps they weren’t there?
I’m surprised, it would normally be the other way around 😉
10
Perhaps O-B will donate the cash component of the prize to NOAA so they can upgrade a few of their temperature stations. This could bring the average global temperature down at a cost of thousands rather than billions.
10
Yes. Normally the fairfax press, in particular The Age pursue the warmist agenda.
I have emailed The Australian & also ABC’s Media watch, about the conflicting reports, so something may come from it.
10
Sorry folks, the main “cause” of global warming is still CO2.
As we all know, The Urban Heat Island effect is removed from the data before processing.
As to warming temps, borehole measurements, ocean temperature measurements and satellite measurements of the lower atmosphere confirm the warming shown by the direct surface measurements.
“We can’t trust thermometers in places now surrounded by engines, concrete, and air conditioners.”
There arn’t many of those around the polar ice caps, Greenland, and in and around the glaciers.
Oh and yep, they’re all melting. Sad, yes.
10
Damien McCormick: # 35
Damien, you and I live on different planets.
10
As usual you produce not an iota of actual evidence to back up this assertion.
Really? How, pray tell, is UHI “removed” from the data before processing? You don’t know what you are talking about. How about doing your homework? Start here.
Download the code and data yourself. UHI is not “removed” it’s adjusted and there is a huge difference, especially as the methodology for “adjustment” actually makes the problem worse.
That’s just GISSTemp. At least they provide the data and code. HadCRUT is another matter.
Given that Phil Jones et al at HadCRU recently admitted that they destroyed most their original records (after being forced to come clean via FOI requests), we are left with accepting them at their word as to the statistical veracity of methodology…which Phil Jones steadfastly refuses to release for scrutiny. So you don’t really know how they account for UHI.
As those alleged measurements are calibrated against bogus surface anomalies, it winds up being circular reasoning. Nor does is prove a damn thing as far as cause and effect.
There aren’t many thermometers at all at in the polar regions or on glaciers. So that further confounds proving your point, which indeed is your burden to prove. Most of the polar and glacier data is supplied by statistical infilling, not by measurement of any kind.
Another unproven assertion. Even if true, and it’s not, it says absolutely nothing about cause.
10
Excellent Ray. Succinct and to the point. And probably accurate too. 😉
Methinks you and I cohabit the same planet that is not the one Damien is on.
10
Of course, and we all know that all published papers and committee reports and government summaries are all 100% exactly correct even if they disagree with each other.
DOE says Antarctica cools, CCSP says it warms. They’re both right!
All the contradictions are reconciled by the sixth dimensional bureaucratoid worm-hole. Thank goodness.
It’s that special law of nature that says if you put 100 faulty biased brains together all the errors cancel out.
10
Damien,
nothing like throwing out a bunch of controversial allegations with absolutely NO evidence. Do you really expect anyone but a True Believer to take you seriously??
HAHAHAHAHAHAHAHA
10
Yes, Damien really does live in a different world. It is a world of the eternal *NOW* for which the context and content of past or future are irrelevant, immaterial, non-existent, unknowable, and inapplicable.
For him, neither the past nor the future exists, did exist, or will will exist. It is only the present that exists. However, he cannot even know the present except by knowing the peer reviewe words of a sacred *other* (Blank out the fact that both the words and their peer reviews are in the past). Since the past does not exist, the fact he once “knew” something that contradicts what he now “knows” means nothing. The contradiction is between present and past and, because of that, does not exist. Only the “truth” he is now absorbing exists and is thereby absolutely true – *NOW*. In a flash, the now becomes the past and no longer exists. On to the next *NOW* – forever and always – it is the ephemeral mind at work.
Such is the power of postmodern philosophy. It creates conflict, confusion, and uncertainty where there is none and removes them where ever they do exist. Vast stretches of events and facts are erased by the simple act of refusing to recognize that they do exist. Mountain ranges of non-existent facts and relationships are brought into existence by the simple act of fantasizing they do exist. It is a world created by the equivalent of a Walt Disney or Warner Brothers Cartoon artist. Except it is not nearly as entertaining and has far more deadly consequences.
20
Ray Hibbard: Damien, you and I live on different planets.
Must do, as on this planet the areas with the least heat island are curiously warming the fastest.
http://data.giss.nasa.gov/gistemp/2008/Fig1.gif
So what planet do you live on?
10
Damien, the satellite data is not nearly high enough resolution to show urban centers and you know it. Try being honest with yourself if no one else.
Urban heat island is a local phenomenon and will bias the reading of a sensor at a given point. Nothing to do with satellite data.
10
Tel Tales – Damien, the satellite data is not nearly high enough resolution to show urban centers and you know it.
I don’t recall saying that it was.
10
So we can agree that your comment #42 is meaningless gibberish then.
10
Tel Tales, in #42 I was refering to a Global map of surface temperature anomalies.
So we can agree that your comment #43 and #45 is meaningless gibberish then.
10
Damien McCormick (Daemon): 42
Must do, as on this planet the areas with the least heat island are curiously warming the fastest.
So what planet do you live on?
I live on a planet where political agendas don’t pass for science, at least not for long. Where what is correct is dictated by data not by consensus or fanciful computer models. Your little theory is coming unraveled fast. This explains the urgency of late in passing legislation much better then any impending doom. This winter is going to be one for the records and it won’t be on your side of the argument Damien. Does one winter mean anything? Of course it doesn’t. But, it could provide enough time for enough people to pull their skull out of their ass.
10
The lack of discussion in this article on how the temperature data is treated, both station and satellite data, is shocking.
The data is processed, normalized, etc, to filter out anomalies.
Have there been any studies published on how the data from the pictured stations are altered? It is something an undergrad could do. I would like to see it, instead of this conjecture. Are there any ongoing studies?
Dr. Gerhard Loebert listed as references, not journals, peer reviewed research, etc, but a paper published by himself, and a blog. At first I laughed, and then I shed a single tear for science and reason.
We’re waiting for the research on this question…. until then have fun mistaking bloggers for scientists
10
Your ignorance is what’s shocking. If you are going to use the terms “normalized” and “anomalies” you should know what they mean.
Same challenge to you as to ole Damien. Do your homework before you start spouting nonsense. Start here. Yes, an undergrad can do it. Can you?
I’d love to give you a link so you can do the same with HadCRUT, but as Phil Jones and company have their methodology and code on double-secret probation, you can’t access it. Oh, and ole Phil just admitted to destroying data records so even if he deigned to share methodology, the data is no longer available to replicate the work. How convenient.
Nice, a combination ad hominem and appeal to authority attack all rolled into one. Your specific scientific arguments against Dr. Loebert’s points are?
No, actually you are ignoring the research on the question and delivering another ad hominem.
10
“It is something an undergrad could do. ”
So go do it then. Firing blanks?
We’ve already debunked the “adjustments” in the comments #37 & #39. You don’t need a science degree to know that the best way to understand the natural world is to study it with rigorous zeal. That starts with putting thermometers in the right spot. We wouldn’t need to do black box magic adjustments if NOAA – with $4 billion in funding – was serious about getting the data right. They’d hire excavators or use wireless transmitters, and put the sensors in places that fit their own standards.
Explain how it’s better to figure out changes in temperature over a century by moving sensors into carparks?
Just curious: Are you paid to write this PR, or do you just feel the need to defend incompetent bureaucracies?
10
danappaloupe: (is this the same person as the pineapple-dude who was here earlier? Sounds a bit similar …)
Given that Dr Loebert IS a credentialled scientist (he has degrees in physics and a PhD in engineering), I’d venture he has every right to link to his own research papers, wouldn’t you?
10
Except those are the same places where the temperature illustrated in the picture is produced statistically, not by measurement. Of course you’d know that if you actually studied the code instead of looking at pretty pictures.
How are you coming on downloading the GISTemp code and data Damien? Have you gotten to step 2 in the code where they “adjust” for UHI?
10
About your link… I need to be more clear in saying that I would like to see data on how A/C, asphalt, etc influences weather stations. Something like a graph/data of temp increase vs. distance from potential contaminate (A/C, pavement, etc).
If I were questioning the reliability of weather stations, like the ones pictured, I would create my own experiment. Take data on the energy released by A/C units, etc, get some data on how much energy pavement holds, for how long, and how far the energy can travel.
Watt did not even propose a basic experimental design, or suggest that real scientists go out and do something about it. This could be done at many universities, and yes I am capable of designing and executing that experiment. I am working on other things, native and invasive plants and how they will respond to climate change. There is evidence that plants are already responding to an increase in night time low temperatures.
“Your specific scientific arguments against Dr. Loebert’s points are?”
You can’t back up statements on science by referencing yourself, and a blog. You can do so by referencing published research.
I have read, almost exactly “ad hominem and appeal to authority” from a few people recently and it makes me wonder if this phrase is part of a talking point on how to defend yourself when someone points out that your science is weak.
10
“It is something an undergrad could do. ”
“So go do it then. Firing blanks?”
Thanks for the personal attack (containing attempted emasculation) on my academic history and ability, which you know nothing about. My undergrad work is done (BS Chem and BS Environmental Science), I’ve spent 2 years in the field working with plants and will be going back for a MS in GIS and restoration ecology. In the past year I have assisted a leading researcher of limnology in alpine lakes and the head researcher at UC Davis who also works as the western region researcher of the US Forest Service (I lead a field crew). So yes I have the chops for scientific research.
Also, why don’t you go do the research or at the very least advocate for someone else to do it by contacting a university. This would be a great project for teaching experimental design.
Anne: I looked at what Dr. Loebert linked to (his own paper) and it lacks the basic elements of a research paper, specifically citations to support claims. Thus it is not worthy of being cited by anyone. I wrote more advanced papers in my Junior year of undergrad.
PS I didn’t mean to change my name.
10
Given that the methodology in GISTemp attempts to “correct” for the above listed effects, it would seem that there is no scientific disagreement about the impact on temperature readings. No need to create a separate “experiment” to show that temperatures around asphalt are higher than temperatures over grass. No need to show that the asphalt continues to radiate heat after the sun goes down. These are all agreed upon facts.
You are creating a red herring.
Then you need to contact Gavin Schmidt, James Hansen, Benjamin Santer, Kieth Briffa and Michael Mann. They reference themselves all the time.
Nice try. No cigar. You’ve not produced anything except ad hominem and appeal to authority. You haven’t even produced a reference.
At least Damien provided a link to a pretty picture.
10
“I have read, almost exactly “ad hominem and appeal to authority” from a few people recently and it makes me wonder if this phrase is part of a talking point on how to defend yourself when someone points out that your science is weak”
(Yawn) No, ad homs and appeals to authority are tactics used by warmists when they realise their science is weak.
10
“No need to create a separate “experiment” to show that temperatures around asphalt are higher than temperatures over grass. No need to show that the asphalt continues to radiate heat after the sun goes down. These are all agreed upon facts.”
Yeah, let’s just not ask questions or seek further understanding. You just made a broad assumption with nothing to back it up. Yes man made features can possibly influence weather stations, but a) is there influence statistically significant b) can it be easily corrected for c) to what extent. You don’t know these answers, nor do I, but I am the only one who wants some data.
Do you have any citations to back up your statements?
“Then you need to contact Gavin Schmidt, James Hansen, Benjamin Santer, Kieth Briffa and Michael Mann. They reference themselves all the time.”
Do you mean that they refer to their own work and research which is in the form of legit research papers that are ready for publishing?
The authority I appeal to is research and the scientific method.
10
Anne… have you even read or written a research paper?
“I’d venture he has every right to link to his own research papers, wouldn’t you?”
This: http://www.icecap.us/images/uploads/Lobert_on_CO2.pdf Is not a research paper. Here are some guidelines for students: http://www.columbia.edu/cu/biology/ug/research/paper.html
If we graded the Dr. here based on these requirements how would he fare?
10
I’m seriously beginning to doubt your alleged scientific background. You are throwing around terms in context that makes it clear you don’t understand the terms.
Do you? You’ve not produced a single one. I provided the link so that you could see how GISTemp is calculated. You asked for data, I gave you a link to data, methodology and source code. Put up or shut up.
ROFL!!!
Briffa violates his own criteria for using RCS methodology in his studies, which get quoted without question in at least 13 different papers. No one catches it, no one questions. The vaunted reviewers at premier science journals don’t catch it.
Briffa withholds data, metadata, code and methodology for 10 years even in the face of FOI requests. The premier science journals don’t even enforce their own archiving requirements so that others can attempt to replicate the work. That’s scientific method and legitimate science? What a joke!
10
Oh dear, we’re not back to the old sausage that “you have no right to comment ’cause you’re not a scientist” – are we? No, I have never written a research paper, ’cause I’m not a scientist – what a dumb and irrelevant question.
What you SAID, mr applecantaloupe, was that Dr Loebert wasn’t allowed to reference himself because …. well, one can’t reference oneself. This is a circular argument and amounts to nothing more than an assertion on your part. Given that Krueger has just reminded you that Schmidt, Mann et al reference themselves all the time, it would seem that your assertion has fallen in a heap.
Don’t move the goalposts, we’re on to that little tactic from your ilk …
10
Anne, go read Loberts “paper”.
Open up the link to Scientific Paper writing from Columbia.
HIS PAPER DOES NOT EVEN CONTAIN CITATIONS, and is therefore garbage.
I don’t know what other papers they want me to look at, links are always nice. I cant imagine any way they can be worse than the above dr.
10
Damien #42:
Damien #46:
Think about it real hard, use all of your English comprehension capabilities. The Global map is useless for any head island measurement, but I’ve already tried to explain that.
Have you tried the mind-expanding properties of logic?
You can phone a friend if it helps.
danappaloupe #48:
Better explain that to Damien, he has a whole map of surface temperature anomalies, so some of them got through that filter I guess 🙂 Seriously though, how precisely to measure the difference between an anomaly and err another anomaly?
Not so! I also would be interested to see the raw data from these sensors, especially the sensors near the airports and near the condenser fans. Since these devices have strong high-frequency signatures, I expect that the interference signal would be reasonably visible if the sample data was every minute or better.
The carpark and asphalt would not show any high-frequency component so this would require something else to detect.
10
Sounds like the authority you appeal to is the scientific publishing industry.
Claiming that some people are entitled to reference their own work whilst others are not is arbitrary, and seems a little unfair. Can you explain how this “scientific method” determines who is sufficiently worthy?
10
Hmmmm…. I’m not a scientist and obviously many of you guys are, it’s a shame. If I knew it all boiled down to a game of knock hockey like everything else I would have paid the price to play. I know how to reduce the rising CO2 levels! Stop chopping down the Amazon rain forests.
10
Me – “I was refering to a Global map of surface temperature anomalies.
Tel Tales – “The Global map is useless for any head island measurement, but I’ve already tried to explain that.”
You jabbered on about satellites which had nothing to do with what I was discussing.
Which was non satellite surface temperature measurements. Get with the program Tel!
danappaloupe – “The data is processed, normalized, etc, to filter out anomalies.”
Tel Tales – “Better explain that to Damien, he has a whole map of surface temperature anomalies,”
That’s right Tel. The denialists claim that heat island is not removed from the surface data.
But strangely, if we look at the mapped surface temperature anomalies, it appears most of the heat island such as asphalt, air conditioners, concrete and buildings are positioned at the poles. http://data.giss.nasa.gov/gistemp/2008/Fig1.gif
Tell me Tel, how come there isn’t a red blotch over the Unites States, and other highly populated areas if the GISS data does not have heat island removed?
10
Lol you’re a piece of work Krueger.
Krueger – Really? How, pray tell, is UHI “removed” from the data before processing? You don’t know what you are talking about. How about doing your homework? Start here.
Ok, Here’s what I found from there.
“The goal of the homogeneization effort is to avoid any impact (warming
or cooling) of the changing environment that some stations experienced
by changing the long term trend of any non-rural station to match the
long term trend of their rural neighbors, while retaining the short term
monthly and annual variations. If no such neighbors exist, the station is
completely dropped, if the rural records are shorter, part of the
non-rural record is dropped.”
10
ME – As to warming temps, borehole measurements, ocean temperature measurements and satellite measurements of the lower atmosphere confirm the warming shown by the direct surface measurements.
Krueger – As those alleged measurements are calibrated against bogus surface anomalies, it winds up being circular reasoning.
Got a cite for that in the scientific literature Krueger, or do you just make it up as you go along?
Krueger – There aren’t many thermometers at all at in the polar regions or on glaciers.
So what? Your protest here is quite pathetic. GISS has the best direct polar coverage, and uses interpolation to cover some polar areas without temp stations. And before you start whining about interpolation. Satellites don’t use any thermometers what so ever, and in fact are just a measure of atmospheric brightness that are measured on a column by column basis through the entire atmosphere. Ironically, John Christy, a denialist, made a questionable presentation to congress based on early uncorrected UAH results. His dataset has had to be corrected – after being found wanting by other investigators, not Chrsty – several times, by large amounts.
Strangely though, I’ve never seen any Denialist posters whining about UAH issues.
10
Damien, “Denalist”?
Time for you to name the evidence anyone denies. You may refer to Christy and others as skeptical scientists, but denialist is name-calling.
Before you accuse us of name-calling: “alarmist”, search your brain for the alarms that the alarmists might be ringing.
Name calling is not science.
Bullies do it.
Time to be polite and civil.
10
Hmmm, a moment ago you were telling me that your global map was made from earth station measurements, now you are jabbering on about satellites. Might try and get your story straight.
If you take the trouble to read Hansen’s 2006 documentation of his work you would see:
So the global map as discussed above (#43) contains a mix of data from various sources including satellite data. The obvious dark red warming shown in the map is around the North Pole, sitting in the Arctic Sea, North of the Alaska coast, North of Greenland and covering Siberia. Are you seriously going to tell me that this huge area of warming was measured by polar meteorological stations?
Does Hansen get a package of data down the chimney every Christmas? Presumably the Elves have specialisations in postcards, greeting cards and punch cards. 🙂
On the Southern side, most of the warming is clustered around the Antarctic peninsula, I guess it must be caused by all the CO2 hanging around those Antarctic base stations that are also clustered on the peninsula.
I would be greatly interested to know the mechanism that causes a big swoosh of hot air to sit over one particular corner of Antarctica. Maybe we can find industrial applications for this.
Because the figure you link to contains a whole lot of satellite measurement and ship data mixed in then smoothed out to a low resolution.
If you look again at Hansen’s 2006 article “Global temperature change” then in Fig 1 we have a hotspot over the Falkland Islands, a sizzling 2 degree hotspot over some microscopic islands Northeast of the Falklands (East of Viedma in Argentina). Another tiny 2 degree hotspot pops up in southern Angola. That’s what happens when you use surface stations without the smoothing filter cranked right up.
In the 2008 map, the whole of Angola has been greyed out, presumably some sort of protest against a country that allows hotspots within its borders. The hotspot Northeast of the Falklands is still sizzling away, apparently a whole chunk of deepwater ocean has warmed up around that patch — perhaps you want to have a go at explaining that one?
10
Anne-Kit Littler post15#
If you thought the Nobel for OB was bad:
Canadian environmental icon David Suzuki has won the honorary Right Livelihood Award, sometimes called the Alternative Nobel prize, “for his lifetime advocacy of the socially responsible use of science, and for his massive contribution to raising awareness about the perils of climate change and building public support for policies to address it.”
courtesy of DeSmogBlog surprise, surprise.
10
Let’s just cut to the chase Tel.
I assume regarding the graphic…
http://data.giss.nasa.gov/gistemp/2008/Fig1.gif
… you believe one of two things.
Either that the map has been manipulated so that the areas with the most warming (presumably those areas with so-called UHI) instead show the least warming, and the areas with the least warming (presumably those areas without so-called UHI) instead show the most warming, in a devious evil plot. Or, it’s just a remarkable co-incidence that it appears that way after a mish-mash of land, satellite and ship data supposedly smoothed out to a low resolution, but in either case, essentially making the graphic a worthless meaingless blob of colours on an outline of a world map.
Lol, you’re a piece of work Tel.
10
Just explain why all the CO2 hangs around the really hot Antarctic peninsula… that’s all I ask.
10
Joanne: Name calling is not science. Bullies do it.
We are all bullies. We are bullying the planet, wild life, in fact the whole biosphere. How do we sleep at night?
Joanne: Time to be polite and civil.
I couldn’t agree more. Let’s start by being polite to the environment.
Joanne: Time for you to name the evidence anyone denies.
Sure. The evidence just keeps piling and piling up. Denial is futile. We as a species must conform to the limits set for us by nature. Failure to do so will only result in our certain demise.
To learn more, read this important new study.
Coupling of CO2 and Ice Sheet Stability Over Major Climate Transitions of the Last 20 Million Years
http://www.sciencemag.org/cgi/content/abstract/1178296
And a related press article.
http://www.sciencedaily.com/releases/2009/10/091008152242.htm
“The last time carbon dioxide levels were apparently as high as they are today — and were sustained at those levels — global temperatures were 5 to 10 degrees Fahrenheit higher than they are today, the sea level was approximately 75 to 120 feet higher than today” Etc, etc, etc, etc …
10
Damien McCormick @73: We are all bullies. We are bullying the planet, wild life, in fact the whole biosphere. How do we sleep at night?
Damien’s true motivation is exposed. He hates humans for being humans. That they can exist ONLY by adapting their environment to their needs is called “bullying”. We are to commit suicide just to save the environment. An environment where EVERY creature eats or is eaten. The same action, living a life consistent with their nature, is to be allowed every living thing EXCEPT humans.
Now can you see they do not mean well? Can you not see they are simply after the destruction of anything even approximating human life? This so called living within natural bounds, which they take to mean humans living as mindless beasts, is a contradiction. Man cannot live as a mindless beast. He must live as a human, meaning by reason using the environment to meet his own needs and ends, or die!
He has chosen to impress the path to death on the rest of us. The critical question is why does he permit himself to live when simply living as a human is his ultimate evil? How does he sleep at night?
10
There are parts of that press release that don’t make sense. Stay with me here: If the last time carbon dioxide levels were as high as today, global temperatures and sea levels were higher than they are today …
… then why aren’t temperatures and sea levels today higher than they are?
10
Too easy Damien.
Surface Temperature Reconstructions for the Last 2,000 Years, Committee on Surface Temperature Reconstructions for the Last 2,000 Years, National Research Council of the National Academies (2006)
But more importantly, throwing that one out there was somewhat akin to asking me if I had a reference for the sky being blue. Perhaps you can provide me with a reference telling me about reading the actual temperature in tree rings, boreholes, ice cores, etc. Or do you just make stuff up as you go along? For you see, these are all proxies. Perhaps you need to do your homework again Damien and look up what a proxy is and why they are used. In the course of your study, you will find that proxies must be calibrated against known temperatures and that the proxy can only be as accurate as the measured temperature data against which it is calibrated.
Within the above referenced book, you will further find hundreds of references to works by Briffa, McIntyre, Santer, Wigley, Jones, Christy, Steig and many others going into even more specific detail on proxy use and how the various studies calibrate their proxies against “known” temperatures.
Therefore, the accuracy of both the raw measurements and the methodology for creating “global” anomalies is absolutely vital and significant for the validity of any temperature reconstruction and proxy use. Therein lies the crux of studies like Watts’ Surface Station Report that details stations which do not meet surface station standards.
Protest? It’s a statement of fact. How are you coming actually running through the code and data Damien? Clearly not well, since your second statement is such utter rubbish. Do your homework Damien. I gave you the link to the data and code. If you actually checked, you’d find that not only is there virtually NO coverage for the poles, it’s MOST not “some” areas that use data infilling.
As to your blathering about the satellites, guess what? They are live proxy data as your own description has made clear. As a point of fact it’s the satellites that give the “best” coverage between 60° and 80° north and south. Above 80° at both poles even the satellite coverage isn’t adequate.
Oh impressive! You can read the one paragraph blurb in the “readme.txt” file that’s not much more than a vague hand wave. Now get to work on the code and data so that you see what is really going on and what happens with that innocent-sounding description above actually gets applied.
10
Ignorance and pea-brained theories will not help us achieve this objective.
10
[…] fact that money is involved, lots of money, those scientists would never fabricate their data by putting thermometers next to heat producing objects, right? They wouldn’t manipulate or game the data so that […]
10
Why is it that when the satellite baloon data says nothing much is happening in the troposphere, the IPCC goes to great lengths to say the data is wrong and needs correction. At least the raw data is freely available.
http://gcmd.nasa.gov/records/GCMD_CDIAC_TRENDS_TEMP_STERIN.html
If land-based data is often based at airports, then clearly the increase in global air travel should correlate nicely with the warming data……So perhaps the headline should read “The main clause of global warming is airplanes/aeroplanes.
10
The data on US jet fuel consumption goes back to 1926 – download the excel sheet from:
http://www.airlines.org/economics/energy/MonthlyJetFuel.htm
10
Surface temperature data here:
http://data.giss.nasa.gov/gistemp/
Graph US jetfuel consumption and global temperature anomalies. The results are interesting to start with.
http://i629.photobucket.com/albums/uu20/blouis79/Jetfuel_globaltemp.png
Now we just need to add some corrections:
1. find global jetfuel consumption figures to compelement the US data
2. smooth out the baseline variability of the temperature data
3. exclude weather stations that aren’t at airports from the global data
So what if the temperature data has been contaminated by planes at airports near airport weather stations?
10
Blouis79,
“So what if the temperature data has been contaminated by planes at airports near airport weather stations? ”
Ok, let’s give a simplified example. You want to know the average temperature of your house. You have a thermometer in the kitchen and a thermometer in the living room. You take the readings from these two thermometers, add them together, and get an average temperature for the house.
Living room 68f + Kitchen 84f = 152 / 2 = 76f.
Oh, did I forget to mention that the kitchen has the oven on that is heating the local environment and the play room has the windows open cooling them??? To get a reasonable average of the house you would need to instrument each room and average all of them together with proportional weights for the size of the room. Notice that you STILL aren’t taking into account how close to the oven vent the kitchen thermometer is… The actual average temp of the house would be closer to 68f.
What makes the temperature measurements even WORSE globally is that they are a proxy for the amount of ENERGY that is flowing through the local environment!!! If the air is higher pressure with high humidity it will have significantly more energy than dry low pressure air at the same temp!!!
So, GISSTemp, and probably HADCrud and GHCN measures Urban and Airport areas out of proportion to rural, high altitude, high latitude, COLD areas without necessary weighting. Their averaging these warmer areas gives a substantial bias to their global average. (substantial may be only .2c/decade, but, that is about the alleged effect of CO2!!!)
10
blouis,
you are right. “perhaps the headline should read “The main clause of global warming is airplanes/aeroplanes. ”
Probably it should. Though the main cause is more likely to be tarmacs rather than the jet fuel. It’s the 2km2 of black heat sink that makes the air close to airports warmer than a grassy paddock, all day and much of the night.
10
Well…
According to Nordell and Gervet, global energy consumption is sufficient to explain 75% of observed warming.
http://www.ltu.se/shb/2.1492/1.5035?l=en
Paper from 2009:
http://www.ltu.se/polopoly_fs/1.5035!nordell-gervet%20ijgw.pdf
Nordell and Gervet discount global solar effects based on the assumption that solar gains are in equilibrium balanced by radiative losses. I also note that total human energy consumption is 10% of total earth-based energy additions (human+geothermal).
If global energy consumption is a reasonable explanation for total global warming, then it is even more likely that full thrust takeoff jetfuel combustion in the vicinity of airports will contribute substantially to the localised airport heat island effect as measured by thermometers substantially located at airports. The tarmac heat sink also absorbs a lot of engine heat. A scientific answer to the tarmac solar vs jet fuel heat would be easy to research.
It is necessary to measure airport air temperatures to compute maximum takeoff weight for aeroplanes. Silly to then make this the benchmark for global warming.
http://en.wikipedia.org/wiki/Maximum_Takeoff_Weight
10
Have been chatting with a climate scientist. The answer to the Nordell paper was to quote forcings of watts/m2. High school physics says thermal energy = change in temperature * specific heat * mass. No wonder the climate scientists are confused quoting watts/m2.
So how do you convert W/m2 into temperature change with a couple of missing variables? Put it in a big computer model.
10
Q: How does climate scientist convert W/m2 into a temperature change?
A: “A global forcing of 0.1 W/m2 is, in energy terms, 1.6 x 10^21 joules per year.”
But I found the right answer from the IPCC:
deltaT = lambda * radiative forcing (RF)
where lambda is the “climate sensitivity parameter”
So where someone like Nordell and Gervet base temperature change computations on testable/verifiable thermal parameters, climate scientists base temperature predictions on observational data by the Hadley Centre to generate the “climate sensitivity parameter”. (I think I read something like that somewhere in the net but it didn’t sink in.) So cook the numbers and use the cooked numbers to generate future predictions of catastrophic warming.
10
It gets even worse. I have been searching the IPCC reports to see if they account for thermal pollution and as far as I can see so far, not.
Responses to Nordell’s paper quote W/m2. The problem there is W/m2 does not measure energy. To convert to energy, one needs to know the relevant area and time. W/m2 from geothermal or human thermal pollution is not comparable to W/m2 from solar radiative effects.
If Nordell is right, then the resulting effect of CO2 could be anywhere from 0-25% of what climate scientists think. If IPCC derived the “climate sensitivity parameter” after accounting for thermal pollution, it could easily be 0-25% of what is being used. IPCC climate scientists only derive the climate sensitivity parameter from observation. Most physics formulae have constants that are known and robust. All of climate science hangs on a wooly number derived from observational data significantly biased by airport heat islands.
And the house of cards collapses.
10
Many things cause global warming. One thing that causes global warming is electrical pollution. Electricity causes pollution in many ways, some worse than others. In most cases, fossil fuels are burned to create electricity. Fossil fuels are made of dead plants and animals. Some examples of fossil fuels are oil and petroleum.
10
The graphs show just how terrible the errors of using all the stations together was! Obviously, this led them astray. See these images, compiled from the Watt group data.
http://www.wunderground.com/hurricane/2010/menne2.gif
http://one-blue-marble.com/blog/wp-content/uploads/2009/07/ncdc-temp.gif
10
I enjoy checking up on all the new types of 12-21-12 theory, I think one good idea that has come of all of this, even if nothing happens is that it has opened our minds to the possibility that we may not be here forever and that we need to treasure the lifespan we have.
10
You people doing a very good job. Definitely all of us should have concern over the global warming. I am hopeful that you may bring further research to the public.
10
Hello Everyone:
I have some basics doubts regarding how air conditioners and refrigerators work. I am putting one most basic pertinent doubt here (it has troubled my small brain for a long time now- please address it with a little patience):
At the core of all AC’s is the basic refrigeration cycle:
1) There is the surroundings (label it ‘1’) with surrounding temperature (call T1).
2) There is the air conditioner in the interface which contains a compressor that takes in electricity to be run.
3) There is the place to be cooled (label it ‘2’) and we want its temperature to be T2 that would make our bodies comfortable. And no rocket science funda involved when I write that T1>T2.
Now when I turn on the air conditioner and a little time later I see the following energy transfers taking place:
a) Heat is being absorbed from place to be cooled. Call this Q2.
b) Energy/Electricity is being fed to air conditioner. Call this W.
c) Heat is being rejected to the surroundings. Q1.
A little energy equation funda involved when I write that Q1=Q2+W. Is this right?
So, Q1=Q2+W => Q1>Q2.
That is heat being rejected to surroundings is greater than the heat that needed to be taken out of my room to make me feel at comfort.
So, HERE comes my basic troubling doubt,
the above implies that if there was a simple heat transfer to be taken place between my room, Q1 should have been = to Q2, which would have meant that temperature rise of surroundings would have been in accordance to M*C*deltaT equality.
But since now, my Q1>Q2,
means that deltaT1, the rise in surroundings temperature is greater than the proportional (by MCT euality) fall in room’s. And this is attributable to compressor work being converted into this additional heat.
Now, multiply this effect by millions for the millions of AC’s and refrigerators working across the globe. And what you see is the overall temperature of surroundings rising further. (Which by the way makes us feel even hotter and pushes us further closed to our AC’s and thus the vicious circle).
Wait a minute here… Is something really horrible wrong here? Because in the first place I wanted to be cooled down a little, I bought an AC, and eventually that AC made the earth even hotter, forcing me to buy more AC’s?? Will the temperatures just go on rising??
ALSO, not taken into account in this explanation (my doubt rather) is the work W that is being fed to the AC. Where does that W aka electricity come from? Yes, the electricity plant- again efficiecny of about 30%… burning of fossil fuels, more heating… ever heating??
—
Note to all the readers: Please understand that I am just a naive with small exposure to mechanics and thermodynamics of refrigeration and AC’s stuff. But this (the mammothic query above) has given me many a sleepless night… Please if I am missing a basic truth, correct me. In any case, answer me. And enlighten me.
Abundant Thanks.
10
Joanne, I think you meant Obama is an excellent…reader.
10