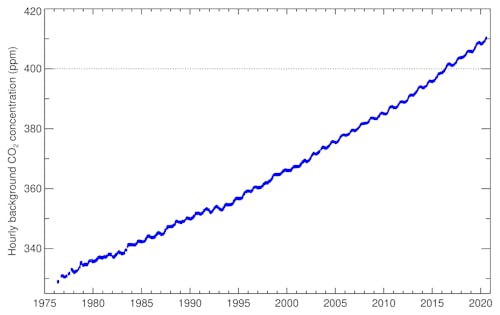
They told us if we stopped driving our cars that global CO2 levels would fall. But after 6 months of the most draconian low carbon diet ever, Cape Grimm Tasmania is still measuring a normal rise in CO2 levels.
Here’s the wild absurdity — Covid restrictions are expected to cut human emissions by 4 – 7% but to reach the Paris Target, we “need” exactly that kind of reduction every single year for the next ten years.
h/t to Chris Gillham again
Zoe Loh, Helen Cleaugh, Paul Krummel, Ray Langanfelds, The Conversion
…our measurements show more CO₂ accumulated in the atmosphere between January and July 2020 than during the same period in 2017 or 2018.
Look at the graph (below) of CO2 levels rising on their annual cycle each year.
There was a huge reduction from 2016 to 2017. It’s almost like China built lots of coal power plants, then disassembled them. That, or perhaps CO2 levels are controlled by plankton and have nothing much to do with human activity.
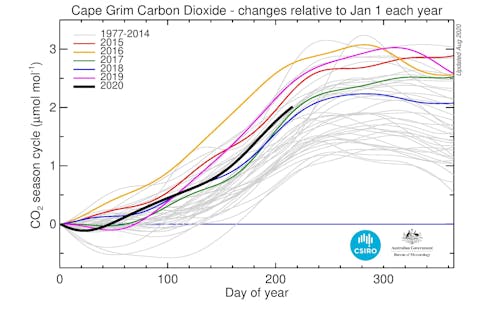
This is terrible news, but it’s helpful terrible news?:
It’s clear COVID-19 has not solved the climate change problem. But this fact helps us understand the magnitude of change required if we’re to stabilise the global climate system
Their excuses are entertaining — Cape Grimm doesn’t show any reduction yet because it’s a long way from the Northern Hemisphere where the biggest reductions were, and the reductions are a “drop in the ocean”.
Spot the effect of coronavirus:
Do the emissions maths
Covid restrictions are expected to cut human emissions by 4 – 7% but the bald truth is that we need a 3 to 7% reduction every single year. And for the next ten years.
Research in May estimated that due to the COVID-19 lockdowns, global annual average emissions for 2020 would be between 4.2% and 7.5% lower than for 2019.
Let’s simplistically assume CO₂ concentration growth reduces by the same amount. There would be 0.08-0.23 ppm less CO₂ in the atmosphere by the end of 2020 than if no pandemic occurred. This variation is well within the natural 1 ppm/year annual variability in CO₂ growth.
To achieve [The Paris Target], global CO₂ emissions must decline by 3% and 7% each year, respectively, until 2030, according to the United Nations Emissions Gap Report.
Flashback to the importance of phytoplankton:
Previously Tom Quirk found a huge 2.5Gt carbon spike in 1990 (which is 9Gt of CO2) — as if three extra Chinas were suddenly emitting CO2 that year. The best explanation was that changes in wind patterns and ocean currents meant it was a bad year for phytoplankton. When phytoplankton struggle, they don’t draw down the usual CO2, hence the spike.
Another study (Martiny, 2013) found that phytoplankton might be drawing up twice as much carbon as modelers thought. While Guidi et al 2015 looked at viruses and discovered that only 10 out of 5,000 were predictive of CO2 levels and these were viruses that infected plankton.
Humans put out only 4% of global CO2, so in terms of whether humans can outcompete cyanobacteria et al, the answer appears to be “no”.
Posts on phytoplanton
Ocean plankton suck up twice the carbon we thought they did
The mystery of a massive 9Gt of CO2 that came and went — could it be phytoplankton?
Phytoplankton are much bigger players in CO2 levels than realized


How is Cape Grim connected to the northern hemisphere?
Can you explain your modelling in this regard?
How is the margin of error calculated in this case?
133
Surely that wouldn’t matter as co2 is supposed to be well mixed
200
Think about this Peter. Australian lockdowns have been smaller than the NH but they have still be a major change from normal travel and fuel use here and much larger than any changes in light globes/plastic bag use/windmills etc etc will be.
Forget the Northern Hemisphere. This data is telling us how much major Australian carbon reduction can achieve in the Southern Hemisphere. ie. Nothing.
261
what is your model?
You have now changed from “global” to “Australian”. What is the delta change in gigatonnes for C02. You have stated that in your model, the “global” drop is below the standard error, and now it is way less, but your model as stated, is still saying that you should see a reduction?
By the way Cape Grim is right in the roaring forties, so how does you model explain that the C02 has to move south, and travel around the globe to be measured at the station.
115
Most industrial CO2 falls close to where its emitted and the Roaring Forties has nothing to do with a well mixed gas. We all agree that CO2 is rising, 97% is from thermal expansion, so during the lockdown the industrial input is undetectable.
40
You are faced with data and you ask for a model?
60
To confirm the data I presume.
40
We have to accept that Cape Grim is good because as Tony suggests the gas is well mixed.
The point is that carbon sinks are everywhere, they are a natural part of the system. The steady rise in CO2 over the last 60 years came about through global warming and the human input is minuscule.
200
If you read the article at The Conversation, the CSIRO show how CO2 levels at Cape Grim are a measure of CO2 across the Southern Ocean and CO2 from the Northern Hemisphere takes about 6 months to mix in the SH.
120
According to Neville Shute; On The Beach”, it takes radioactive fall out from the Nuclear war 12 months to cross the Intertropical Convergence Zone and reach Melbourne in lethal concentration.
80
good reference.
10
Point 2 – how does the phytoplankton deal work? I’ve not seen any reports of increased levels of the stuff in quantities to provide the gigatons necessary.
To posit a model which invokes a direct relationship between A and measurement of A on a chaotic system, and then claim the model does not work, seems to missing a few vital steps. one of which was outlined by ken in #1.3
218
Peta, how do you model a Chaotic system. The definition of Chaos is unpredictable?
You should revert to the default, “the system is not well understood”.
131
You can only model the averages of a chaotic system and only if those averages are the result of LTI causality. For the Earth, the long term averages must be predictable because the Earth is demonstrably causal with yearly averages that are mostly unchanged indicating time invariance relative to the processes resulting in the average and in the domain of Joules, Watts and W/m^2, COE requires linearity. Otherwise, there’s no point to trying to model the chaos of weather and hope the proper averages emerge. Unless you know how and why those averages emerge, you’ll never be able to simulate what arises from the chaotic self organization of the atmosphere relative to achieving balance. The failure to understand this is what leads to the failure of most GCM’s.
20
According to NASA.
‘Worldwide, this “biological carbon pump” transfers about 10 gigatonnes of carbon from the atmosphere to the deep ocean each year. Even small changes in the growth of phytoplankton may affect atmospheric carbon dioxide concentrations …’
50
According to reality, this CSIRO confection is just another LPU (least publishable unit) contrived as ‘scientific’ click bait by combining (DEADLY!!) CO2 with (DEADLY!!) COVID 19 and (DEADLY !!) ‘global warming’ to create a menage a trois of search engine target words with a view to getting a ‘sexed up’ report mentioned anywhere and everywhere to demonstrate the relevence and ‘importance’ of the ‘researchers’ and the ‘work’ they do, i.e. to tickle their KPI’s and tweak their funding upwards, IMO.
50
Not sure if you can combine all those memes, but I accept that many scientists have tortured the data to get the right outcome.
00
Peter Fitzroy
“Point 2 – how does the phytoplankton deal work?” Slave labour in concentration camps, guarded by savage dogs?
Considering that the “idea” of fertilising the oceans with iron salts to boost algae growth and consequent absorption of extra CO2 into the natural cycle as a way of reducing the level of atmospheric CO2, is a recurrent theme in Green sites (you know the ones – the first thought is the only thought type) you should keep up on “The Science”.
That will be my moderation for tonight.
60
Peter Fitzroy,
From Google/Duckduck Go is my friend, comes these snippets (which may or may not be accurate).
In some years phytoplankton have been observed to cover 2/3 of the Pacific Ocean! In would appear the level and extent of of phytoplankton booms depend on water temperature, salinity, winds and oceanic flows, and nutrient concentration (especially nitrate/nitrite levels).
At the start of 1998 (during El Niño conditions) the oceans were characterized as having low nitrate, so correspondingly the chlorophyll concentration was one of the lowest observed over the time period of 1998–2007. At the same time, cyanobacteria reached their maximum concentration as diatom concentrations reached their lowest value.
As La Niña conditions intensified in late 1998, nitrate concentration increased and produced a phytoplankton boom succession sequence.
I understand such behavior is not uncommon in all oceans but it’s more easily identified in the Pacific and especially so around the periods of changeover from El Niño to La Niña conditions.
50
You don’t understand. Peter needs someone to publish a peer-review paper to join every dot.
20
Peter, why not make a name for yourself and:
1, stop whinging
2. create your own model
20
Cape Grim is connected to the northern hemisphere by 5,000 km of land and sea. Providing data for half the planet.
40
Here’s a new, just-out National Review review of Lomborg’s “False Alarm”:
https://app.getpocket.com/read/3078831613
[ The article is behind paywall !]AD
01
Oops—try this one:
https://www.nationalreview.com/2020/08/global-warming-book-review-false-alarm-bjorn-lomborg-rational-approach-action/
30
Now shows how our governments paying for adjusted science claims were wrong.
As usual.
40
Just another added money sucking tax…
60
Our government so inventive on taxation…
Next one will probably be.
“Save the fish from drowning tax”.
60
Good morning Jo,
This is a truly great revelation.
I can’t wait to hear this talked about in the “lame-stream” media in the next 3 or 4 days.
But wait, I think I can hear a pin drop!
The media in this country, and throughout the Western World are in over-drive at the moment, trying to get the Green Cult policies irreversibly embedded into every possible legislative area. And most people are stupidly ignorant of same. Oh, you don’t agree? Well how do we explain the farce that we have over 100 green politicians in local/state/federal government in this country?
Australia needs to WAKE UP!
We are asleep at the wheel, and the journalists & teachers unions are significantly to blame.
(See also Steve McCann’s story in AmericanThinker 11/8, The Mainstream Media Is at the Point of No Return … See also Scott Powell’s story in CanadaFreePress 13/8, Crushing the Barbarians Inside the Gates.)
This excellent story of yours Jo shows exactly how “StrawMan” these Green Cult proselytisers are.
Warm Regards, reformed warmist of Logan.
160
Spot on!
20
If CSIRO, PM Morrison and others believe reducing emissions is key to some ulterior motive, be it saving the planet from catastrophic climate change or pretending to be good by meeting/beating the Paris targets, then how about they tell China and other major contributors of CO2 emissions to shut down their coal fired power stations instead of them building hundreds more? Let’s not beat around the bush. Those who continue to push the emissions reduction agenda are either destructive or clueless, both of which are dangerous to the survival of our nation.
350
Ummm … the government is operating on the ‘precautionary principle’ and we have to convince the electorate through the media that this is pure folly.
There is a disconnect between temperatures and CO2, something to do with the cart before the horse, so if we want to topple the Paris Agreement then its fair to say the pandemic has come to our aid.
93
… it all points to mankind’s contributions to climate change being a fraction of what they are supposed to be.
Pure HUBRIS — mankind making out it is far far and away a greater and more powerful force than it actually is.
Yep, we’re the mouse that roared
(the Peter Sellers version of 1959 is hilarious … and it’s on youtube 😀 )
100
If we go back 6000 years when temperatures were a couple of degrees warmer than now, SST off the Queensland coast was a degree higher than now, yet CO2 levels were only 262 ppm.
The interesting thing is that from this day forward the CO2 levels began to rise as temperatures fell throughout the Holocene.
21
CO2 does, what CO2 does and without us.
We’re not needed. Maybe it’s all the foraminifera?
Less cloud = more foraminifera, perhaps.
Whatever, our fondness for fossil fuels is too small to have much effect at all.
Let’s just stop worrying about it …
90
Throughout paleo climate history you will notice there is an inverse correlation between temperatures and CO2, visually it looks like a monstrous stadium wave.
02
umm, no. Trailers galore … darn.
10
Even more hubris is embodied in the notion that Australia must reduce its CO2 emissions to lead the world and get the actual large emitters to follow us in order to “save the planet”. The Chinese and Indian governments must look at us with (quite justifiable) contempt.
100
Aah, you’ve noticed that.
00
Precautionary principle-
The idea that no action should proceed as the action may cause, maybe by an undiscovered mechanism or microscopic probability, something really bad.
So nothing can ever be done, the same argument can be applied to ‘do nothing’.
That is – it is just a post-modernist slogan used by the Woke.
Noise and fury but meaning nothing.
20
With all the lockdowns in Australia, electricity consumption has dropped by 4-5% comparing 2020 to 2019 per OpenNEM data.
Q1 2019 52,772 GWhr; Q2 2019 50,027 GWhr
Q1 2020 51,670 GWhr; Q2 2020 49,616 GWhr
Have we saved the world yet?
Pity about all the unemployed.
130
So, with all of this Wuhan Virus shut down of virtually everything, we have reduced power consumption by 4 to 5 percent then, eh!, and coal fired power makes up 70% of that, so that’s a 3.5% reduction in the total CO2 emitted from the power generating sector for ….. AUSTRALIA.
China adds a WHOLE AUSTRALIA coal fired power total ….. every three months, and has been doing that for the last 12 years plus, and is not easing back.
So, what we do here in Australia (and now need to do forever) is totally and utterly negated by China in, umm, ….. THREE DAYS.
Maths is just so inconvenient, eh!
Tony.
330
G’day Tony,,
Sometimes a little bit of omission helps their message. I particularly like – no, loathe is a better word – this example from SMH’s resident warmist:
” AGL has planning approvals for a 500MW battery at Liddell, the ageing 1660MW power station that is slated to close by April 2023. ”
I reckon some precision could be obtained by adding just a few words, giving:
“AGL has planning approvals for a 500MW (occasionally) battery at Liddell, the ageing 1660MW (24/7/52) power station that is slated to close by April 2023. ”
I’m not sure how permeable the SMH paywall is these days:
http://www.smh.com.au/business/right-moment-agl-unveils-plans-for-at-least-1000mw-of-batteries-20200813-p55lnn.html?btis
Cheers
Dave B
30
Note here it gives Liddell’s output at 1660MW.
When first commissioned it had an output of 2000MW, and now, those four Units can only manage around 420MW each.
Liddell is now 49 years old.
I was wondering that with that 500MW battery in place (yeah, of course!!!) what they will be using to charge it up, and what the charge/discharge cycle will be, the losses associated with that, and how long the battery will last.
Macarthur wind has a total Nameplate of 420MW, you know, around the same as for ONE of those 50 year old Units at Liddell, and Macarthur has NEVER generated its Nameplate, ever, and Macarthur is only seven years old, and, contrary to the 35% to 37% quoted Capacity Factor, it is actually delivering at around 22% Capacity Factor. So, it averages 92MW, and hey, it only cost us $1.2 BILLION.
Tony.
160
The Liddell story highlights the tragedy of the decline in our power generation. The original infrastructure to get power into the grid was substantial, the re-routing of the New England Highway, construction of the cooling pond, the coal delivery conveyor belt system from Costain’s Ravensworth Mine and the electrical grid component itself. Now, instead of utilising these investments by constructing updated power generation units in orderly sequence on the site, AGL wants to close it down. (The same scenario with Hazelwood in Victoria) Bayswater power station, “across the road”,(with cooling towers) will probably face the same fate in due couse.
See AGL’s website: https://www.agl.com.au/about-agl/how-we-source-energy/agl-macquarie
All this is due to lack of governance from the governments we have elected. One Federal MP, Joel Fitzgibbon, (Labor, strangely enough) seems to realise what is at stake.
I don’t think anything will change until there are catastrophic power outages, but this cannot be fixed shortterm. The NSW Electricity Commission, even as a ‘fat cat’ at least had a mission to provide for the future. Much as I admire free enterprise, without the firm guidance of government oversight, in our present unrestrained corporate greed culture things will only get worse.
70
TonyfromOz in moderation at 12.28PM.
Nothing out of the ordinary in the text that I can see.
Tony.
50
Notice the “(deliberate ?) error ?
500MW does not define the size or capacity of a battery,..only its power ability.
So they are not declareing how long it would be able to supply that 500MW for ( an hour maybe ?).. so compared to Liddels current generation ability.. this is nothing !
I suspect AGL have realised how futile it is to make money in RE and are going to focus on FCAS support services which have shown to be very lucrative for AEON with their Tesla battery in hornsdale SA…knowing that there will be an increasinf need for FCAS with the additional RE being proposed..
10
Hi Tony
For day 1 it’s been obvious that Australia is totally irrelevant in regard to co2 emissions.
The parasites climate agreement is purely pandering to inner city elite
As you said, just do the maths
70
Not at all Mal:
SA has reduced the world’s emissions of CO2 by 0.01% (less the extra CO2 emitted by the backup diesels recently installed). Meanwhile China has increased the world’s CO2 emissions (according to the IPCC dogma) by 20 to 40 times that EVERY YEAR. (And don’t blame them alone, the Sth Koreans, Japanese, Philippinoes, Indonesians, Vietnamese, Indians, Pakistanis, Germans, Poles etc. etc. also help the rise, or maybe not from the above graph).
20
The bottom line is that the developed western world doesn’t have enough enough population base to cause any noticeable warming, even if you believe in the alarmist sudo-science. In fact, the combined emissions of the developed world stopped growing in 1980 as we completed our development cycle and since 1980, all growth in emissions has been from developing countries as they either embark upon or continue their journey towards being developed. The crazy situation is that no climate alarmist cares about the developing countries emissions and there is no indication that any global climate policies will be enforced upon them, ever. This is despite them now making up 2/3 of all emissions and being the only group of countries that can cause further CO2 growth in the atmosphere, with the population base potential to increase global emissions by ~3x current levels by the end of the century. The fact that this group of countries is fully exempted from emissions restrictions is indication that the UN and broader climate community consider C02 as being harmless. Also, the fact that the climate alarmist community seeks to use per-capita measures when it comes to measuring emissions is an indication that they are seeking to defend the rights of the developing countries to continue to increase emissions unrestricted, which they have already been doing for 40 years and will continue in the same vein indefinitely. Based on this situation, there is no other way to view the climate change movement as anything else but a purely political movement with political objectives.
00
Yes, it has been said that we need a permanently ratcheted up and cumulative covid effect every year. The public will really get on board with that
. Surely the out gassing of the warming oceans since the KIA is a very likely cause for the increase of atmospheric co2 , which doesn’t mean that phytoplankton doesn’t also have a role.
80
Which KIA – Cerato, Stinger, Rio?
10
Oh Gosh, you still refer to the KIA as the LIA? 🙂
10
Good Covid-1984 News Everybody!
Climate Scam Conference is cancelled.
>> Now is time to disband the IPCC & stop the farce …
“Most of UN climate science report likely to be delayed beyond 2021 Glasgow summit.”
https://www.climatechangenews.com/2020/08/13/un-climate-science-report-likely-delayed-beyond-2021-glasgow-summit/
“The last IPCC assessment report in 2014 told governments starkly that “human influence on the climate system is clear” and that man-made greenhouse gases were at their highest in history, causing “widespread impacts on human and natural systems”. That helped pave the way to the 2015 Paris climate agreement.
The Glasgow summit is meant to bolster action under the Paris accord, which seeks to limit warming and the damage of more frequent heatwaves, floods and rising sea levels.”
Wait. What?
Sea levels are still rising after Obama/Biden said it was the moment when sea levels slowed their rise!
120
That 2014 pronouncement has been amended to “The last IPCC assessment report in 2020 told governments starkly that “human influence on the climate system is NOT clear” and that man-made greenhouse gases were at their highest in history, causing NO “widespread impacts on human and natural systems”.
That helped pave the way to the 2020 Confrence to be abandoned, while they desparately search for another excuse.
30
It might be useful to juxtapose jo’s excellent piece with this one from the UK
https://notalotofpeopleknowthat.wordpress.com/2020/08/13/national-infrastructure-commission-renewables-could-meet-two-thirds-of-uks-energy-demand-by-2030/
Basically we can not possibly substitute green measures as a replacement for our total energy needs.
To this reality needs to be added that if all the nations pledges for green energy were enacted we would need something like three addional planets for all the lithium needed and five for the cadmium etc. at present rare earths and other materials needed to enable the woke to use their smartphones come from a tiny number of countries mined by virtual slaves in appalling conditions.
Shellenberger and Michael Moore seem to have heard the penny drop but the greens are making so much noise I am not sure anyone heard them
120
There is a supply side and a demand side. If the demand stays the same at 2250TWh then getting to 1485TWh by 2030 would require a 12-fold increase over what has been achieved in the lat 20 +years to get to 120TWh (there was existing hydro from last century).
All that effort so far this century to get to 5% – so 2.5%/decader. So the rate of investment in weather dependent generation, electrified transport and household heating would need to accelerate more than 100-fold to achieve 1485TWh for it by 2030 – 60%/decade. It is not linear, it gets harder to get anything over 30% in electrical generation alone. Them there is all the investment to convert transport and heating to electricity.
On the other hand there is the demand side. UK could just invent a deadly pandemic that wipes out most of the population and stop immigration such that the existing 120TWh is enough to meet 66% of needs. It still requires conversion of vehicles to electric or hydrogen and likewise household heating.
00
Could it be that the Covid-19 shutdown is showing us that human-generated CO2 emissions have no effect on Worldwide CO2 levels? Next question, could it be that CO2 levels have no effect on the Climate but are a result of it?
170
Yes, the oceans have been out gassing since the LIA as the earth warmed naturally following this intermittent 400 year long cooling period. The human co2 signal is tiny compared to the natural effects
110
Yes Tonyb,
Oceans and the vast areas of naturally defrosting Arctic tundra.
Nature doing what nature does, controlling atmospheric CO2 levels to the level nature (NOT man) wants.
Maybe the IPCC thinks its a good idea to return to the climate of the Little Ice Age.
80
Correlation vs causation
And is causation the warming oceans releasing co2
The ipcc has always Assumed that co2 created warming and all its reports were supporting that position
It’s obvious now from observation that this is not correct
They have boxed themselves into a corner with no where to go.
20
Mal,
“They have boxed themselves into a corner with no where to go.”
I don’t think you understand, the IPCC does not rely on ‘science’, or having any evidence. What the IPCC cares about is keeping world leaders mesmerized with the idea that each government is important in doing what is needed. It’s a massive ‘bread and circuses’ distraction!
The IPCC publishes policy documents. These are manufactured in vast amounts and are mostly science free but are stuffed with sophistry and opinions designed to make Western nations feel guilty, and to make developing nation feel that they are owed something from Western nations. This documentation greatly assists in playing the ends off against each other while allowing China, India, and a small butch of other nations to make profits at everyone else’s expense. This is all of course all politics, which is what these policy documents are all about.
The secondary purpose of all this ‘documentation for policy makers’ is keeping all governments shackle to the ridiculous notion that CO2 imperils the planet though global warming, and that will cause disastrous climate change. The IPCC knows that it is important to make all national representative feel that they are all ‘in it together’ (like a being ‘in’ a special club) then the IPCC can sway many governments’ policies.
The lack of evidence for CO2 warming the atmosphere doesn’t matter a jot and the IPCC knows this. All they want is governments of the world to continue to pay due attention to them regardless of what any scientist, or reality indicates!
40
no and no
01
There is so much wrong with that article from the “Conversation” that I can’t be bothered even starting to unpack it. Crucially the authors never question their central assumption, which they clearly state here;
The remoteness of Cape Grim in the mid southern latitudes may well delay the effects of reduced fossil fuel burning in the Northern hemisphere but the CO2 levels recorded at Mauna Loa show the same level of increase but at a higher base level,
130
This is a global map of CO2 sources from WUWT for 2015 – 2016.
https://wattsupwiththat.files.wordpress.com/2015/10/oco2-1year-co2-globalmap.png
Svalbard must be heavily industrialized to be responsible for so much CO2.
(Secret Norse metalworking?)
And you can see the dog teams sweating hard across Canada.
10
[Off Topic]AD
01
” There would be 0.08-0.23 ppm less CO₂ in the atmosphere by the end of 2020 than if no pandemic occurred. ”
But after 7 months CO2 levels at Mauna Loa are increasing at the same rate as before. Every month this year has seen CO2 at least 2.35ppm greater than the same month last year, averaging 2.55ppm above. Yet in April 2016 the 12 month increase was 4.17ppm and in April 2018 the 12 month increase was only 1.2ppm- long before any pandemic or economic slowdown.
So the CSIRO are admitting that the human influence on CO2 levels is minuscule compared with natural variation. Then they say that this proves how much we will have to reduce emissions! You can’t argue with that sort of “logic”. See https://kenskingdom.wordpress.com/2020/08/07/co2vid-watch-july/
90
“… in April 2018 the 12 month increase was only 1.2ppm- long before any pandemic or economic slowdown.”
Yes, but the effects of changes in CO2 travel at superluminal velocities causing their effect to occur before the the change in CO2 occurs. This has been well demonstrated in the Vostok ice cores.
(/sarc)
10
News just in…
The CSIRO is willing to sign a peace treaty with CO2 as long as we all agree to remain under totalitarian control (pay our taxes, fund their sinecures, don’t ask questions, and shut-up!).
Carbon Dioxide is a proxy for productivity, wealth, health, freedom, and happiness. The reason it’s the target.
There’s no need to continue the phony war against an innocent bystander if we’ve already got the outcome we wanted.
It’s BLM Baby! “Climate Change™” is so 2019.
120
Yeah except they havent…and they wont.
Firstly, people will likely literally riot unless they start rolling out known drugs to nuke covid so people can resume thier lives after this rotten virus was released upon the population. Any vaccine is likely cobbled together quickly and trusting it would be foolish, IMHO.
Secondly once people get back to work, the climate lie will stay irrelevent. Hey people have just had the globalists hand up thier collective rear ends for 3 months, why would anyone with half a brain want to continue that in the guise of the climate lie?
Time to tell the climate weenies to go jump.
60
Hmmm…seems C**** has jumped the shark….
00
The satellites used to measure global CO2 level are supposed to be high precision. They measure the globalaverage to 1 ppm. The Keeling method shows a good correlation of rate of change of global CO2 to NH SST as if measured to 0.1ppm. These aren’t reconstructions from numerous measurements around the globe but each individual site that give the same results, after 12 moving average smoothing.
I’m not going to argue the reasons for the observations when the observations are so dubious.
20
Spot the result of 500,000 windmills. Billions of solar panels. The explosive growth of China’s coal power plants, now 50% of the world and exempt from CO2 controls. Spot the results of electric cars or Corona virus and no aircraft for six months. Spot the results of 30 years of the UN madnated strangling of Western democracies. Spot anything at all. It’s as if mankind cannot even minutely influence the overall CO2 levels and their growth or anything else. So why do we bother? And how can it be anyone’s fault? Perhaps it is natural?
Consider also those little annual variations. What physical chemistry tells us is that the 98% of CO2 in the world, dissolved in the gigantic oceans which cover the world will come out of solution in warmer places and go back in where the water surface is colder.
So what if that’s all there is? And the cycle of the seasons should produce a similar effect, a ripple on the growth with the seasons.
It’s as if the whole thing is nonsense, completely wrong and not science. Ocean Acidification is a concept that when the world heats CO2 is absorbed by the water, making it more acid. Not only would that lower CO2 which is a good thing supposedly but it is against the fundamental rule of physical chemistry on the absorption of gases. So why did real scientists like ‘our’ CSIRO host an international conference in Hobart on something they know is absurd non science? Anyone can answer this one.
91
Consider that human output is nearly constant and growing. Amazingly as Tony From Oz points out continually, our output is 18Gw almost constantly. And the planes and car numbers are constant. And factories. CO2 output and growth should be constant if we are wholly reponsible. So what are those little annual bumps? Parties in China? Or seasons of hot and cold?
Now if seasons can have such an impact on CO2 levels, what if temperature is the key? And what if that indicates the world’s ocean surfaces are getting ever so slightly hotter, releasing their overwhelming store of CO2?
No, it can’t be true. Greta says so. It’s your fault. And certainly not China’s fault. And calling the virus Kung Flu is xenophobic.
71
Missives from Jacinda Herself:
“We have identified 29 cases. At this stage all remain linked to one cluster centred in Auckland. 1 other case that is likely linked to the cluster is still being investigated.
We have undertaken more than 30,000 tests in the last 48 hours.
38 people linked to the cluster are now in Government-managed quarantine as a precautionary measure.
There are signs we have found this outbreak relatively early in its life.”
Sigh, so we remain at Alert Level 3 until August 26. For now.
One item I found interesting was:
“The sequence of the virus from the current outbreak is not the same as the sequences from community cases in our original outbreak in NZ. This suggests this is not a case of the virus being dormant or of a burning ember in our community. It appears to be new to New Zealand”
I see this, given my lack of expertise, as potentially Made in New Zealand a local mutation. If it should be, then continuing to lockdown is the wrong treatment — it’s gonna get us eventually. Instead I think the Govt should be importing/synthesizing Cholecalciferol and distributing it, making it available to everyone. But of course, Big Pharma will scream because they won’t be selling Patent(ed) Medicines and drugs for Alzheimers, Lupus, Chrohn’s Disease, Rheumatoid Arthritis, headaches and other problems caused by vitamin d deficiency.
80
Well, Jacinda’s Folly is only going to cost $440 Million per week. Such a bargain, eh? Just bill it to your children.
https://www.dailymail.co.uk/news/article-8621405/Jacinda-Arderns-extreme-Stage-Three-COVID-19-lockdown-cost-country-440million-WEEK.html
50
How wrong did Jacinda get it?
There’s almost nothing that she did not get wrong.
https://thebfd.co.nz/2020/08/15/coronavirus-why-everyone-was-wrong/
50
Then again, masses amount of methane is released along the Atlantic rift. Methane breaks down in sunlight to CO2 and H2O .
20
Thermal expansion is enough to explain the outgassing of CO2. The biggest impact from undersea activity on climate change is the ability to warm the oceans.
10
As I understand it the trend in the ratios of carbon isotopes in the atmosphere determine the source and fossil fuels account for most of the CO2 increase.
Dr Roy Spencer reckoned that there has been ~11% reduction in emissions so in the overall carbon cycle would be too small to be observed over one annual cycle.
22
don’t use science on an entertainment site like this one
27
Well said Peter, we have one too many jesters.
41
Is the industrial output carbon-12, carbon-13 or carbon-14?
10
Some science for Peter, CO2 has very low climate sensitivity.
https://notrickszone.com/50-papers-low-sensitivity/
30
CO2 is a greenhouse gas, even a small increase in the atmospheric concentration — in theory and all else being equal — will tend to raise the global average temperature by about 1C for every doubling of the concentration.
Human activities have and do increase the atmospheric concentration of CO2.
Time series graphs of observations measured since 1958 suggest that the CO2 –> T link is far from simple:
https://www.climate4you.com/images/HadCRUT4%20GlobalMonthlyTempSince1958%20AndCO2.gif
Plotting temperature as a function of CO2 is more informative as Clive Best does here and suggests a logarithmic relationship as theory implies:
http://clivebest.com/blog/?p=8837
Based on these studies he comes up with an empirically-based estimate of climate sensitivity of about 1.7C — assuming that the temperature record is reliable and that all the observed temperature increase is due to CO2 forcing.
111
That’s a nice summary of everything which is not true. Just convenient conjecture supporting Green policies.
Take “Human activities have and do increase the atmospheric concentration of CO2.” Proof? There is none.
However you can prove absolutely that it is not true. You can measure it with Carbon 14 as fossil fuel has none and we doubled C14 with atmospheric atom bombs around 1965. All gone now in a perfect exponential decay, which blows the Bern diagram out of the water. So the alleged biosphere exchange is utterly irrelevant.
So there is negligible man released CO2 in the air. And as Professor Suess observed in 1956 after two world wars, the oceans clearly absorb it all remarkably quickly. It was called simply the Suess effect, rapid equilibrium of gases between the air and the ocean, now trashed on Wikipedia with leftist science. Which makes great sense as fish have to breathe too and all life came from the ocean rich in both O2 and incredibly soluble CO2. As we know from beer, soda water, champagne etc.
Now if the extra CO2 since 1900 is not man made, what does the rest matter?
We have no control, which is the point of Jo’s article.
Just look at it and point out where $4 Trillion dollars or anything we have done has made a difference. Or the hundreds of new coal power stations. Or even the odd volcano or forest fire or other natural event which releases vast amounts of CO2. No effect at all. So we and the volcanoes and fires are irrelevant. Case proven.
151
Carbon 13 is also relatively decreasing:
https://www.esrl.noaa.gov/gmd/outreach/isotopes/c13tellsus.html
At this stage IMO it is counterproductive arguing against something that is regarded as ‘settled science’.
Emphasis should be on the increasing CO2 concentration as a net benefit and efforts to reduce global CO2 emissions as utterly futile and extremely damaging to countries that attempt it.
23
“regarded as ‘settled science’.”
By whom? It was unproven and not right 32 years ago. It is still not right and unproven. You see not a single conclusion from this shonky science has been right and the test of real science is that it can be used to explain future events, events which are now history. There has been no rapid, terrible , tipping point warming, no rapid sea rise, no polar bear extinction, no collapse of agriculture, drowning of cities, end of the world, no rapture.
The Earth is not flat. The planets go around the sun, not the sun around earth. It is not the first time ‘settled science’ has been exposed as total fakery. And being wrong for a long time give it no credence, despite the trillions spent trying to reduce steady CO2 growth. Look at the CO2 graph. What effect has 32 years of windmills and misery had on CO2 growth? Or anything else? There is not a single event of 32 years of human history reflected in the graph. CO2 growth is entirely natural, not man made or even volcano made or bushfire made. And those little bumps are the seasons.
100
We should make it an offence to sequester CO2.
It’s theft from the plants.
Plant Lives Matter!
20
That is sequestering oxygen at twice the rate of carbon. Theft from plants it ain’t.
00
Antarctic ice cores not a good proxy for CO2, what do you think MX?
https://scripps.ucsd.edu/programs/keelingcurve/wp-content/plugins/sio-bluemoon/graphs/co2_10k.png
10
The lukewarm hypothesis is badly flawed, CO2 shows a steady increase even though temperatures rise and fall. The hiatus in world temperatures should have sent alarm bells ringing, AGW was falsified, but there are too many snouts in the trough.
Temperatures will fall significantly over the next five years according to Bianchini and Scafetta.
https://ui.adsabs.harvard.edu/abs/2018EGUGA..2010430B/abstract
Buy wheat futures.
71
Agreed. Air temperatures at ground level are emphemeral, fleeting, a human condition relating to the bottom few meters of human existence on land. They are a consequence of the effects of sun and oceans and the cycles of energy in both, the air itself of very little heat capacity and the temperature at ground level a phenomenon of accident, not predictable even in gross terms. Check today’s weather report. And if you want medium term, check the ocean cycles, El Nino and La Nina, Pacific Decadal Oscillation, the Indian Dipole, the Gulf Stream, the Humboldt current. And long term, the sun cycles.
And yes, temperatures will fall significantly, a few degrees over the next hundred years and that has already started. Plus it is backed by real scientific analysis based on hard evidence and proofs, not profit.
81
Moving from El Nino / drought to wetter conditions particularly in Northern Australia also has a significant effect on creating a massive green carbon sink. We will see this in 2020. The CSIRO completed an assessment in 2014 and up to 60% of Australia’s CO2 emissions can be captured during these seasonal changes. We have only recently learnt that there are more and larger forests throughout the World not previously identified and documented (as forests). More carbon sinks not previously known. It’s a shame that climate scientists don’t look at the global carbon cycle in more detail, geology (including chemical reactions in the environment, erosion and isostatic earth movements) and total earth systems rather than computer models with often repeatedly flawed data.
https://blog.csiro.au/record-rains-made-australia-a-giant-green-global-carbon-sink/?fbclid=IwAR1swx8DlL1a7lGR_ZfyQ4egIi0u0zrd4lz7eVk5O-VCMUJQUzs8rePNS80
70
Do we get carbon credits?
It’s also odd how people focus on where humans live as significant. Even though 75% of the planet is uninhabitable water, 3.4km deep. We focus on the atmosphere causing the (atmospheric) weather when that is a what we experience but it is an effect, not a cause. Ask yourself how much weather there would be without water. How much rain? How many rivers and glaciers and lakes and plants and animals? And why people look to areas of human habitation to absorb CO2 when the vast biosphere which generates half our O2 is the surface of the oceans with phytoplankton, not the land surface. And all the heat in the world’s oceans with a total heat capacity 1400x greater than the entire atmosphere and oceans which received 75% of the incident solar power. We should study the seas.
It’s a shame we don’t have a working model of the transport of energy in the oceans, because coupled with a solar model of the only source of input heat, that would explain just about everything. Somehow though people think we are in charge. It’s the arrogance of the 20th century science fiction, where we ants, masters of the universe, think we control the sprinklers on the golf course. In fact, as Jo’s graph shows, we are irrelevant.
But we can be happy, as state of mind denied to the Greens who are grumpy, angry, demanding and never pleased and it’s always someone else’s fault. An awful way to live.
81
“Trump EPA Rescinds Burdensome Obama Climate Change Methane Leak Regulations”
https://wattsupwiththat.com/2020/08/14/trump-epa-rescinds-burdensome-obama-climate-change-methane-leak-regulations/
30
This is a joke, because there is no ambition from developing countries to reduce their emissions growth and the UN agreements allow them to continue to emit without restriction, a situation that will continue indefinitely. Any emissions cuts by small emitting countries such as Australia, that already have stable emissions, are more likely to increase global emissions as it pushes up production of solar panels in China, who will use more coal and gas, as well as force the remaining high emissions aluminum and steel smelters to relocate to developing countries with lower energy efficient industry. IMO – It is not a coincidence that CO2 emissions rose more after 1980 when climate agreements came into force, than in the previous 200 years. All of the rise of CO2 emissions after 1980 came from developing countries, partly because of the climate agreements, which help them increase emissions by increasing their rate of development.
Having the CSIRO come out now with a huge virtue signal of emissions cuts is simply their way of saying “Lets help drive up global emissions even higher by pumping more money and industry into developing countries, but let’s make sure we trash Australia more at the same time”. A complete joke !!!
50
The joke is the “greenhouse gas” fairy tale. It is a fable for the weak of mind. It is a religious belief for the zealots.
The properties of water, in its various states, combined with the distribution and extent of surface water provides a powerful feedback system that controls Earth surface temperature within narrow range. Ocean surface cannot get much above 303K because the rate of evaporation rises exponentially with temperature resulting in cloud formation that reflect sunlight to lower heat input. Open surface water cannot get below 272K because it forms sea ice that insulates the water below from heat loss. So it is unsurprising that the average surface temperature is smack bang in the middle of these two extremes at 288K.
50
Even if global warming were a real thing, when in human history has actual warming such as during the Minoan, Egypt, Roman, Medieval warm periods etc., been a bad thing?
No warmist has ever been able to answer that for me.
81
Might be better off saying global cooling caused the decline of civilisations, start with the Holy Roman Empire and explain why those aggressive tribes moved south.
They will say that is irrelevant in the modern era, but you’ll remind them that CO2 doesn’t cause global warming and there is no backup for what is just around the corner.
41
― Michael Crichton, State of Fear.
70
We’ll always have Paris.
11
Thanks to Turnbull and ScoMo.
00
Here is an article comparing northern and southern hemisphere CO2 data. Raw data is interesting but commentary written from a warmist perspective.
https://kenskingdom.wordpress.com/2016/06/24/well-mixed-carbon-dioxide-part-1-north-vs-south/
31
Actually, I misinterpreted a comment. It is not warmist oriented, it’s science-based.
41
Very True. And thanks to Ken for that overview of CO2 levels in recent history.
Ken’s conclusion; “And finally: CO2 is not “well mixed” globally, and an average concentration is as elusive as an average temperature. There is a range of concentrations between areas of sources and sinks approaching 80ppm.”
30
As I pointed out in my comment to yesterday’s article, August 14, the Mauna Loa CO2 has not only continued at its previous rate, but the rate through to August 12 was greater than that for previous measurements from the Observatory.
Interestingly, the Observatory web site has not provided an update of the monthly CO2 level for June or July. Usually each month’s figures appear during the first week of the following month. The last weekly insitu figures where dated 03 June with the results through to 30 May. Fortunately I found the daily figures on a Twitter account so I have been able to make the above statement that the current rate of increase of CO2 at Mauna Loa is greater than at any time over the past 62 years of measurement. For 01 to 12 August 2020, the concentration has on average been 2.56 ppm greater than for the same period in 2019.
Is the Scripps Institution playing politics in the lead up to the coming Presidential election?
As a retired geophysicist, one of the most disappointing things about life today is that integrity has gone from science. The climate fraud is all about playing politics for those aiming for position, power and privilege over the world at large, as Maurice Strong implied in setting up the UN IPCC, the aim has been to destroy capitalism by demonising fossil fuel.
60
Bevan Dockery,
Here is a link via NOAA to CO2 levels weekly trends. Note the difference between last year and this year’s monthly figures.
https://www.esrl.noaa.gov/gmd/ccgg/trends/weekly.html
It’s still rising, probably because the oceans are anomalously warm, so continue to outgas CO2.
It is after all, the partial pressure of dissolved CO2 and temperature that determines the rate at which CO2 is dissolved or liberated from the oceans. Thus overall level of CO2 in the atmosphere is determined greatly by the temperature of the oceans, and NOT by the amount humans pump into it.
And that is also why ‘carbon’ capture and storage (CCS) can never work, as that would alter the partial pressure at the ocean surface, making it more likely that CO2 would be liberated from the oceans.
30
Been well discussed, the best response seems to be:-
https://www.drroyspencer.com/2020/05/why-the-current-economic-slowdown-wont-show-up-in-the-atmospheric-co2-record/
30
It must admit this is the first time I have seen CO2 in such detail. Usually its Moana Loa at a huge scale, so the ripples are barely visible. This is fascinating for a few reasons. First at 41 South, there is virtually no large population on the planet. It is way below South Africa. The next stop is the bottom third of Argentina and Chile. So no people at that latitude, just open water for the circumference of the planet. Add this to the fact that the atom bomb tests migration of C14 in 1965 show a 2 year lag between the hemispheres, so CO2 does not migrate quickly. Most of Austrlia’s CO2 in fact goes to New Zealand, not South to Tasmania.
So why does the CO2 go up so strongly and predictably each year. Put a straight line under it and you have steady growth which must be water surface temperature slowly increasing. Plus you get a sine curve, low at the end of the first quarter and high in mid spring. It would be interesting to correlate that with surface water temperatures at that latitude.
What is certain is that the cycles superimposed may be caused by the same phenomenon which gives the steady rise, water surface temperatures. And the magnitudes may correspond as well, proving this. The question is whether we have data for surface water temperatures over the Southern Ocean at that latitude. If the CSIRO were not too busy having conferences on Ocean Acidification, they might investigate why the ocean is releasing CO2 at this latitude because one thing is certain. There are no people, cars, planes, trucks and just a few nice big cattle on Cape Grim, but their output would reach Stewart Island.
51
That should not be hard to do. Lets look about for the water temperature data for Bas strait.
30
I was thinking more the vast Southern Ocean, far from the Continental shelf.
I have previously found data for Cape Grim and they are very comparable but exactly anti cyclic. Intersting. Why the delay? As with all these bumps, there is a delay but they otherwise fit.
My hunch is that the surface temperature is set differently in the vast oceans than near Tasmania, oceans subject to massive currents which carry huge amounts of stored energy, say heat from the Indian ocean heading south months after it was created. We are very familiar with such air warming and cooling currents as they control the weather in places like Western South America and North America and the Gulf Stream shows how the sun in the Caribbean manages to completely control the climate in Europe. Without it much of Western Europe would be like Moscow in winter. London, Paris, Berlin are at 50 North and colder as you get away from the Gulf stream heat. Why not Gulf Stream CO2 as well?
20
I was wondering how long it took air to travel around the world. Air does not travel in a straight line but in cycles. In looking I found this comment..
“It takes about 2 weeks for a mass of air to circle the globe along its latitude from West to east. I used to work for a French climate research lab in the 70s, and was based on Crozet island (South Indian Ocean) . At the time I was carrying atmospheric radioactivity measurements, and the French army was carrying nuclear test above ground in the pacific, I could see the radioactive cloud passing above me about 10 days later and then again about every second week after that and about completely disappeared after 6 months.”
He presumes the cloud went around the planet in two weeks. That’s unlikely. 40,000km in two weeks, What’s far more likely is that it went around in a loop over two weeks. That’s 120km/hr. I believe it was in a loop, largely circling the one area.
Then it took six months for radioactive cloud to stop circling and vanish. So did it cease to exist, dissipate or had it moved on with long half lives? If it had moved on the answer is six months to leave a vast area and I would suggest it take 6 months for CO2 released over the Great Southern Ocean to reach Australia, which explains the anti cyclic behaviour and six months difference.
The question for CO2 measurements at Cape Grim is what is being measured? That depends on wind patterns and my experience at Cape Grim is that it is in the teeth of the Roaring 40s, the winds which took the clipper ships quickly from South Africa to Melbourne. That would reduce the time but also bring the CO2 over the Entire South Pacific and South Atlantic into play, a collection distance of the entire circumference of the world at that latitude, maybe 30,000km.
10
That’s possibly 2 months travel, so explains a 2 month lag. Other lags may come from the movement of heat south via water currents. It’s not hard to find a 6 month delay which explains the anti cyclic observation.
10
Incredible, it would seem from the article:
theconversation.com/carbon-dioxide-levels-over-australia-rose-even-after-covid-19-forced-global-emissions-down-heres-why
that the CSIRO scientists at the Cape Grim station do not even know that the peaks in the second graph “Annual growth in CO2 at Cape Grim since 1976″ relate to the El Niño effect. This is explained in my analysis of the Cape Grim data on my web site with the relationship shown in the figure:
https://dockery208841154.files.wordpress.com/2019/01/cpgm_detr_dco2pa_oni.jpeg
They are so imbued with the notion, quote: “The CO2 increase is due to the burning of fossil fuels for energy, and land use change such as deforestation which leaves fewer trees to absorb CO from the air, and changes the uptake and release of carbon in the soils.” that they do not even bother to look further. It is climate change that drives the change in CO2 concentration.
No wonder the CSIRO Chief Executive Dr Larry Marshall spoke in an address on 12 August about creating a hydrogen industry and using technology to navigate Australia’s transition to net zero emissions. As a result our Federal Minister for Industry, Science and Technology welcomed CSIRO’s continued commitment to solving real-world problems.
HELP !
50
And El Nino is a phenomenon of higher water surface temperatures when warm Pacific water shifts Eastwards towards South America. I have no idea why simple physical chemistry of Henry’s law which controls the solution of CO2 in the oceans is not considered. Temperature goes up.
Temperature goes up. Aerial CO2 goes up. Temperature goes down, CO2 goes down. Direct proportionality (in degrees Kelvin). Plus the variations of summer and winter, day and night, latitude. As there is 50x as much CO2 in the water as in the air, it would only take a 0.5% decrease of CO2 in the water to increase aerial CO2 by 50%.
30
So the Greens are determined that 50% increase in tiny CO2 warms the air (not the water) but will not consider that a tiny warming of the water which covers the planet releases CO2. One is wild conjecture. The other is known physical chemistry. And of course the other wild conjecture is that relatively tiny mankind released CO2 is different to all other types of CO2 and stays in the atmosphere for ever. That’s crazy stuff.
40
No why would people make up such stuff? Because if it’s not true, those $2-4$trillion of windmills are useless. Think of what could have been done with that sort of money. And they are all in rich countries with plenty of energy where Green voters live.
30
TdeF,
It is the oceans that largely determine the atmospheric level of CO2 in the atmosphere!
The partial pressure of CO2 at the interface of the ocean and the air for any given temperature determine whether the oceans will liberate or dissolve the atmospheric CO2.
As you say as the ocean temperature rises more CO2 is liberated, when the temperature falls so it is dissolved. But also if the temperature were to stay steady but the partial pressure were to increase then oceans would dissolve more CO2, conversely if the CO2 partial pressure were decrease the oceans will liberate more CO2.
Any water dissoluble gas that humans pump into atmosphere undergoes this method of regulation (within certain limits for its chemistry and physical properties), thus the truly inane idea of CCS (‘Carbon’ Capture and Storage) can never work for the faster you attempt to degas the atmosphere of CO2, the quicker the oceans will outgas it as the CO2 partial pressure over the oceans has dropped.
Nature controls atmospheric CO2 levels not mankind!
50
Apology, a check of the CSIRO web site shows that they do recognise the correlation between the Cape Grim CO2 record and the El Nino Southern Oscillation. It just did not get a mention in the Conversation article.
30
People keep looking for the small decrease in our emissions to make a difference, but the huge increase has also made no difference. Our emissions increased by about 50% in the last three decades, yet the rate of increase in global CO2 has been virtually unchanged.
https://www.worldometers.info/co2-emissions/co2-emissions-by-year/
This insensitivity to the rate of our emissions is strong evidence that the CO2 increase is not caused by our emissions. That natural sinks should magically increase just enough to make this happen is extremely unlikely.
61
Yep. More generally, that’s why the increase of atmospheric CO2 is uncorrelated with human emission of CO2:
https://youtu.be/b1cGqL9y548?t=36m10s
The human contribution has to be SMALL.
10