Years before Climategate, THAT email, from Phil Jones to Warwick Hughes told us everything we needed to know about the scientific standards at the Climate Research Unit of East Anglia. THAT email was the tip of the iceberg, and below is what lay underneath the surface — the things that were said behind the scenes at the time. Geoff Sherrington has pieced together a sequence of climategate emails, his own emails, and parts of Warwick Hughes work to recreate the sequence.
And for the true skeptic-aficionados, here’s a new layer of history to the skeptical chronology. Where did this volunteer audit movement begin?
Who would have guessed that at least one skeptic, Hughes, was asking for the data Phil Jones worked with, as long ago as 1991? (That was way back in the days where people worked with hard copy print outs, and drew graphs by hand!) Does Hughes rank as volunteer Skeptic Number 1?
UPDATE: I asked Warwick, and he thinks the first unpaid skeptic was Fred Wood in 1988*. — Jo
——————————————————————————
Guest post by: Geoffrey H Sherrington, Scientist.
This is the longer story behind one of the more anti-science quotes in the short history of people attempting to be ‘climate scientists’, definition unclear. The pivotal short quote is in the opening email.

“Why should I make the data available to you,
when your aim is to try and find something wrong with it.”
…
Here is a series of emails and articles with my interspersed comments in italics. Each email number is the one assigned in Climategate One and Two, presumably by the donor named FOIA. The Climategate emails are indented below, so the source can be picked up easily. There are sections cut from other emails as well. They are not indented. We start with the famous email, the one that some say was the start of the difficulty that scientists in general found when they tried to access data from some climate scientists.
———————-
From Phil Jones to Warwick Hughes.
1299. Between July 2004 and Feb 2005. (Exact date not on my copy of the email.)
I should warn you that some data we have we are not supposed top (sic) pass on to others. We can pass on the gridded data – which we do. Even if WMO agrees, I will still not pass on the data. We have 25 or so years invested in the work. Why should I make the data available to you, when your aim is to try and find something wrong with it. There is IPR to consider. You can get similar data from GHCN at NCDC. Australia isn’t restricted there.
ACRONYMS
WMO = World Meteorological Organisation.
IPR = Intellectual Property Rights.
GHCN = Global Historical Climatology Network.
NCAR = USA National Centre for Atmospheric Research.
WWR = World Weather Records of the World Meteorological Organization.
MCDR = WMO’s Monthly Climatic Data for the World.
Phil had had some prior thoughts about this.
0688. 16 July 2004.
The reason for emailing though is that I’m also being hassled by Warwick Hughes for the CRU station dataset. We put up the gridded fields, but not the station data. Over the last year or so, I’ve told people they can’t have the station data – go to the GHCN site and get it. I knew that avenue has been closed, but it got some of them off my back. I’m not that inclined to release it to Hughes (who Mike knows and maybe Tom). All he wants to do is to show how I’ve made some mistake or used some incorrect data for some stations.
There are a number of issues, though:
1. Should Res. 40 stop GHCN data being released?
2. Should I be hiding behind it too?
3. When does IPR kick in with the work I’ve put in on the CRU data?
4. Should people like this be able to request this kind of data?
5. NCAR release a precursor to GHCN – just WWR/MCDW+lots of other data, but in an unfriendly format.
From Phil Jones to Tom Peterson.
Thomas Peterson was near the top of NOAA, USA National Oceanic and Atmospheric Administration. See http://www.noaaworld.noaa.gov/scitech/sep2008_scitech_4.html
Jones seems to be unsure of the efficacy or legality of ways to avoid a direct answer to Warwick Hughes. Jones appears to know that he is deliberately telling people to go to a place where they will not find the answers they seek. Note the term “unfriendly format”.
Why was Warwick Hughes seeking certain data in 1990?
In Warwick’s words:

Warwick Hughes
“I started reviewing Prof Jones work in 1991 and I have a timeline of my work and published papers in those early years – many links. People have asked me how I got started looking into temperature data.”
“I first got curious about GW through media reports up to 1990 and wanted to check Australian data for myself – at that point I had never used a PC. I went into the BoM in Lonsdale Street and paid for hard copy printouts of stations from here and there – no idea how I selected sites – just places I knew and maybe the counter staff suggested stations. I drew a series of charts on graph paper and seeing a variety of disparate trends – being unable to find GW – showed them to some ex mining industry contacts. One guy gave me an intro to people at the Tasman Institute in the Melb CBD and about April 1991 I breezed in there with these hand drawn charts and showed a staffer – who said; “..you will have to get all this material onto disk – you can come in here and learn to use a PC.”
They gave me a little cubbie of a desk and a 286 PC with Win3.1 and I began pestering staff as to how to get some work out of this box thing. Anyway – the worst phase probably only took a few weeks and I could get some work out of Excel – my early data was entered to disk from my sheaf of hard copies printouts. Sometime in winter 91 I made contacts in the BoM and somebody gave me a copy of the US DoE TR027 report – which details – station by station – Jones et al Southern Hemisphere compilation of GW.
The Australian component of their Appendix A – was my basic source to track down Australian long term stations – I built on from there – for example work done building the data for the Balling, Idso & Hughes 1992 paper – that caused the BoM so much heartburn.”
“This work lead on to my construction of the two contrasting temperature histories from circa 1882, Graph 1 for 25 regional and remote Australian stations and Graph 2 for the six Australian capital cities.”
“City Reviews takes you to many instances of urban heat island UHI contamination of city temperature data still used by Jones/UKMO/IPCC.”
About a half dozen people or more, like me, from larger companies, would meet monthly to distribute funds to Tasman and to review work in progress. Warwick made a presentation in 1991-2. He was more prescient than I was. I left the climate scene early in 1993 and did not reconnect until about 2005. The work presented to Tasman Institute contained several graphs. These two persist, see http://www.warwickhughes.com/1991/targw.htm for a longer discussion.
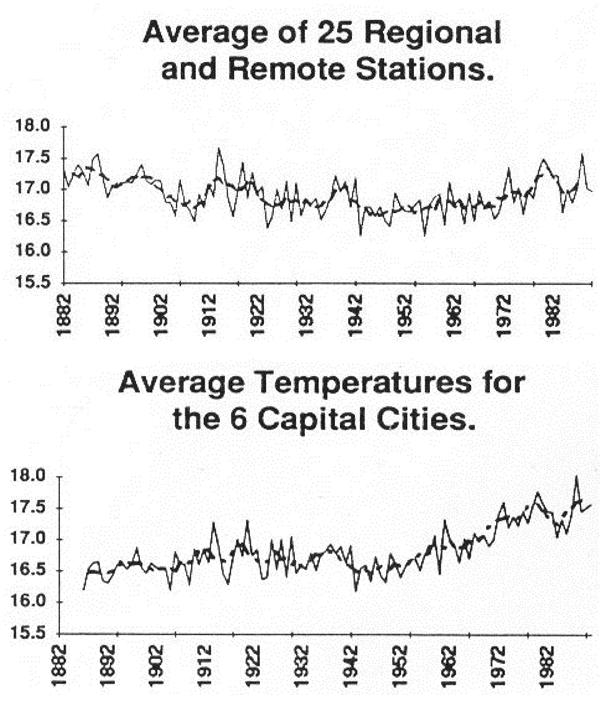
Top graph: Geraldton, Narrabri, Hay, Albany, Rottnest Island Lighthouse, Walgett, Deniliquin, Bourke, Cape Naturaliste Lighthouse, Coonabarabran, Echuca, Cooma, Darwin, Moruya Heads Pilot Station, Omeo, Dubbo, Alice Springs, Gabo Island Lighthouse, Bathurst, Strathalbyn, Mt. Gambier, Yamba, Wilsons Promontory Lighthouse, Newcastle Signal Station, Cape Otway Lighthouse.
Lower graph: Sydney, Melbourne, Brisbane, Perth, Adelaide, Hobart
It was Warwick’s contention that the search for UHI had been less that thorough as to choice of Australian stations. Here he shows that the temperature change in the average of several large Australian cities was positive, whereas that of a selection of rural sites was negative to level. (Temperature is in Celsius, Tmean annual compiled from half of the sum of Tmax and Tmin daily). Somehow, Phil Jones had concluded from figures similar to these that UHI was negligible in Australia, a finding that is still being quoted in 2011.
In 2004- early 2005, Warwick wrote a number of emails to CRU and WMO, which do not appear in Climategate records, but which are on file here. Some of them detail efforts by Phil Jones to stop bodies like the WMO from cooperating with Warwick. Much of his interest was in the raw data behind two papers from University of East Anglia, being –
Jones, P. D., S. C. B. Raper, T. M. L. Wigley, 1986: Southern Hemisphere Surface Air Temperature Variations: 1851–1984. J. Climate Appl. Meteor., 25, 1213–1230.
This first main paper involved an assembly of data for the USA DOE (Department of Energy) for CDIAC. (Carbon Dioxide Information Analysis Center, Oak Ridge national Laboratories, Tennessee, USA.)
http://dx.doi.org/10.1175/1520-0450(1986)025<1213:SHSATV>2.0.CO;2
The second main paper:
Jones, P.D., P.Ya. Groisman, M. Coughlan, N. Plummer, W.-C. Wang and T.R. Karl, 1990: Assessment of urbanization effects in time series of surface air temperature over land. Nature 347, 169-172
.
This second paper dealt with data from China, Russia and Eastern Australia and it was one of the key papers promoting a stampede of thought under the Global Warming banner. It is an important paper, but it is wrong.
Warwick subsequently had the following papers published and a few more rejected, perhaps because they questioned the orthodoxy.
1992 Robert C. Balling, Jr., Sherwood B. Idso, and Warwick S. Hughes. “Long-Term and Recent Anomalous Temperature Changes in Australia.” Geophysical Research Letters, Vol. 19, No. 23, pp. 2317-2320. [Abstract]
1995 Robert C. Balling, Jr. and Warwick S. Hughes. “Comments on “Detecting Climate Change Concurrent with Deforestation in the Amazon Basin: Which Way Has It Gone ?” Bulletin of the American Meteorological Society, Vol. 76, No. 4, 9. 559.
1995 Warwick S. Hughes. Comment on D.E. Parker, “Effects of Changing Exposure of Thermometers at Land Stations.” International Journal of Climatology, Vol. 15, pp. 231-234.
1996 Warwick S. Hughes and Robert C. Balling, Jr. “Urban Influences on South African Temperature Trends.” International Journal of Climatology, Vol. 16, No. 8, pp. 935-940. Online at [2]http://www.john-daly.com/s-africa.htm
1997 Warwick S. Hughes. Comment on, “Historical Thermometer Exposures in Australia.” by N. Nichols et al. International Journal of Climatology, Vol. 17, pp. 197-199.
In year 2005, the Global Warming discussion was leading to many unscientific statements. I became involved, writing a letter to the national newspaper here. ‘The Australian’ 15 February 2006:
“THERE is an excellent argument for curbing the public statements of scientists like those from CSIRO, a former employer of mine. Scientists, like the public, cover a spectrum of beliefs, some of which are based on emotion rather than science.
An example is the selection of Australian weather recording sites used to construct the temperature measurements of the continent, which play a big part in southern hemisphere weather models. From the beginning, most sites that showed little or no temperature rise or a fall from, say, the 1880s to now were rejected. The few sites selected to represent Australia were mainly from capital cities and under suspicion for “heat island” effects. I could give example after example as it was one of my employment functions to distill the best results from the bogus on many mattersrelated to energy/greenhouse/nuclear etc. I found few truly objective submissions among those masquerading as science.” Geoffrey H Sherrington.
This created a storm, because the Climatic Age of Innocence in Australia was again under threat.
For example, http://jennifermarohasy.com/2006/03/geoff-sherrington-responds-to-chattering-class/
Also, I sent emails to Phil Jones. These are too long to reproduce in full, so later I collated them for the Climate Audit blog. The first one starts a few paragraphs down from here, datde 24 March 2006. The “missing graphs” to which I refer are those in the text just above here. The Jones+Sherrington email exchange is not in the Climategate sets. Two recurrent themes are the evasion of a direct answer by Jones; and as we shall now see, the way in which data disappear, reappear, are available, are not available, are reliable, are not reliable. This might seem like fun, but it is not like Science.
The URL is http://climateaudit.org/?s=Sherrington+Jones+emails
At about this time, the subject of Freedom of Information law, especially in Britain, started to become mentioned more often.
——————-
5133. 20 Jan 2005.
From Phil Jones to Tom Wigley, CRU.
On the FOI Act there is a little leaflet we have all been sent. It doesn’t really clarify what we might have to do re programs or data. Like all things in Britain we will only find out when the first person or organization asks. I wouldn’t tell anybody about the FOI Act in Britain. I don’t think UEA really knows what’s involved…..
I got a brochure on the FOI Act from UEA. Does this mean that, if someone asks for a computer program we have to give it out??
As Phil Jones warms to the subject of Freedom of Information, he seems to have learned enough to become expert in advising others:
———————-
3341. 3 Dec 2008.
Phil Jones to Tom Wigley, CRU.
When the FOI requests began here, the FOI person said we had to abide by the requests. It took a couple of half hour sessions – one at a screen, to convince them otherwise showing them what CA was all about. Once they became aware of the types of people we were dealing with, everyone at UEA (in the registry and in the Environmental Sciences school – the head of school and a few others) became very supportive. I’ve got to know the FOI person quite well and the Chief Librarian – who deals with appeals. The VC is also aware of what is going on –
CA = Climate Audit blog (Steve McIntyre). VC = Vice Chancellor
Most of the following is self-explanatory parts of emails from Climategates One and Two.
——————-
0377. 9 December 2003.
Ian “Harry” Harris, CRU programmer to Keith Briffa, CR
Aaaaaand it’s obviously not just me having trouble with it 🙂
…including additional documentation, fixing of minor typos in the
descriptions of different datasets, and providing some additional
minor methodological details of the MBH98 analysis. We are also
providing the full raw instrumental University of East
Anglia/Climatic Research Unit surface temperature dataset 1854-1993
(Briffa and Jones, 1992), because CRU has since updated their surface temperature dataset, and no longer archives the version that
we used when we began our study in the mid 1990s.
Ooh! Are we being scolded?
U.
Harry had reason to be concerned. Here are selected extracts from Climategate One as reported in ‘The Daily Inquirer” newspaper on 2 Dec 2009, http://www.thedailyinquirer.net/harry-read-me-the-climategate-report/127123
Harris is a climatologist/programmer at the CRU and his “Harry Read Me” documents his efforts to update a huge statistical database (11,000 files) of important climate data between 2006 and 2009. What’s scary is Harris admits that much of the center’s data and applications are undocumented, bug-ridden, idled with holes, missing, uncatalogued and, in short, utterly worthless. Here are some of the programmer’s comments (with the page number in the parenthesis):
– “Am I the first person to attempt to get the CRU databases in working order?!!” (47)
– “As far as I can see, this renders the (weather) station counts totally meaningless.” (57)
– “COBAR AIRPORT AWS (data from an Australian weather station) cannot start in 1962, it didn’t open until 1993!” (71)
– “What the hell is supposed to happen here? Oh yeah — there is no ’supposed,’ I can make it up. So I have : – )” (98)
– “You can’t imagine what this has cost me — to actually allow the operator to assign false WMO (World Meteorological Organization) codes!! But what else is there in such situations? Especially when dealing with a ‘Master’ database of dubious provenance …” (98)
– “So with a somewhat cynical shrug, I added the nuclear option — to match every WMO possible, and turn the rest into new stations … In other words what CRU usually do. It will allow bad databases to pass unnoticed, and good databases to become bad …” (98-9)
– “OH F— THIS. It’s Sunday evening, I’ve worked all weekend, and just when I thought it was done, I’m hitting yet another problem that’s based on the hopeless state of our databases.” (241).
– “This whole project is SUCH A MESS …” (266)
Having established some reason to doubt the accuracy of the CRU data, we turn now to the “now you see it, now you don’t” aspect. Here is my first attempt to gather data from CRU. It overlaps with Warwick’s requests. This is not in the Climategate emails, it is personal.
——————
24 March 2006:
From Geoff Sherrington to CRU.
I seek the figures which were used from Australian weather stations at the start of your climate modelling work in the 1980s. I seek to know the first set of Australia weather stations used in modelling, plus the set that was rejected and if possible, the span of data by years (or the data itself) for each of the stations considered and eventually used initially. Is it possible to obtain this information?
—————-
March 25, 2006:
From CRU to Geoff Sherrington.
Dear Geoffrey, We no longer have the Australian station date we were using in the early 1980s. At that time we had a limited network. In the 1990s, the Australian Bureau of Meteorology began issuing a lot more station data each month. Up to that time it had been about 40 stations internationally. Through contacts with personnel in Melbourne, we got access to the back data from all the new stations, so added these. In order to use temperature data, we need historic series with at least the 1961-90 base period. We now have access to over 100 stations from BoM in real time … Australia is the only country to make additional data (additional to the about 1500 exchanged by Met Services) to us in real time.
Warwick tried to get information from the USA Government. This related to the first main paper quoted above, from data collected by CRU for the US Government, who paid Phil Jones & Co on an ongoing basis. The response was negative.
http://www.warwickhughes.com/blog/?tag=phil-jones
In Oct 2005 I (Warwick Hughes) wrote to DoE CDIAC asking for the Jones et al/CRU station data and was told:
“.. Phil was not obligated under the conditions of past or present DOE proposal awards to provide these items to CDIAC. I regret we cannot furnish the materials you seek.”
Phil Jones tells others that an Australian BOM officer is ignoring Climate Audit and Warwick Hughes.
————————-
2143. 19 June 2007.
From Phil Jones to Tom Wigley.
Just looked at the CA web site, and their latest is a real go at
the Jones et al. (1990) paper. When Wei-Chyung got the email from
Keenan he was going to Norway for a meeting. Maybe he’s back now.
It seems as though they didn’t give him much time to respond.
I have a JGR paper to review by a number of Chinese on temp trends
there. Warming looks much greater than CA would believe. They refer to a
J. Climate paper (which is either in press or resubmitted – depends where
it is referred to in the paper !) which reckons that 30-40% of the warming
there is urban related. Not keen on it being said this way, but need to
read the paper beyond the abstract and the urban section.
As for pointers, yes stress this is just USHCN and not global. Maybe
also point out that work on assessing homogeneity is best done within
the country (even if Russ doesn’t agree), so could mention Lucie re
Canada. There are apparently some Australian pictures as well on the
CA website. I had an email from David Jones of BMRC, saying they will
be ignoring anything on CA and anything from Warwick Hughes.
The other aspect to point out is that the SSTs are warming around most coasts,
and the open ocean as well, so UHIs can only be a small part of the overall
warming. There is a sentence or two on this in Ch 3, in the ES if I recall
correctly.
Could also point out that there are many totally rural sites around the world
which show strong warming.
More Acronyms
CA = Climate Audit blog.
BMRC = (Australian) Bureau of Meteorology Research Centre
SST = Surface Sea Temperature.
UHI = Urban Heat Island. (Natural temperatures artificially elevated by man-made developments near weather stations).
The puzzle deepens. Phil had the data after all!
————————–
2581. 27 February 2007.
Phil Jones to Thomas Karl NOAA USA.
I have had a request for the data from McIntyre, but I am not sending
the data. I am already tried and convicted, so there is no point
in sending them anything. I will not bother replying as well. I might
as well act as expected. They will run out of steam in a week or two
and move onto something else.
There is a clear thread running through the comments. By the way,
CRU isn’t changing any of the current data that is coming in on the
CLIMAT system, except where it is wrong. We are getting Australia
directly as their CLIMAT messages don’t calculate monthly means
as they used to pre-1994, and for a few sites in eastern Canada,
where Lucie Vincent developed homogeneous series – but adjusted
them to the pre-1960 period.
By the way, I do have the data from the study on disk! I was wise even when Steve McIntyre first requested the data many years ago. I think I could replicate the study if I had that rare commodity – time.
The penultimate paragraph of the 1990 paper was mainly written by
Tom – thanks. It even has pre-IPCC definitions of likelihood!
Neil – can you pass this on with my best wishes to Mike.
CLIMAT = a collective system of periodic climate reporting by countries under an arrangement of the World Meteorological Organization.
At this stage Phil is still sticking to his story that CRU no longer has the data sought by Hughes, Keenan (for China) and self (for Australia). Then in the Climategate Two:
—————————-
3114. March 27, 2007
From Phil Jones to Dave Palmer, FOI officer, CRU.
Subject: Re: FW: Freedom of Information Act / Environmental Information Regulations. request (FOI_07-13 ; EIR_07-03)
I have found all the input data for the paper from 1990. This includes the
locations of the sites and the annual temperature values. If I were to get
someone in CRU to put them on our web site, do you think that would
keep them quiet, or just spur them into more requests?
The 1990 paper data isn’t that much, just 6 small files, each of about a half
an A4 page.
My earlier email about the other request (the first one) for all our data still
stands.
Phil loses data – again. Reported in “Guardian” newspaper. 15 February, 2010.
“In an interview with the science journal Nature, Phil Jones, the head of the Climate Research Unit (CRU) at the University East Anglia, admitted it was “not acceptable” that records underpinning a 1990 global warming study have been lost.
The missing records make it impossible to verify claims that rural weather stations in developing China were not significantly moved, as it states in the 1990 paper, which was published in Nature. “It’s not acceptable … [it’s] not best practice,” Jones said.
I cannot understand what Phil means, as he has previously stated in 3114 , three years before, that the data are not lost.
Then we get this expose. The Australian data have a serious error in any case.
————————–
2963. 3 March 2009.
From Phil Jones John Kennedy, a Canadian official, by way of mention.
Earlier today we got an email from Australia – see below. So, Australia is still
issuing the wrong CLIMATs as far mean T is concerned.
In the files I gave you last week, all Australian data post-Nov 94 has mean T calculated the way
it should be using (Tx+Tn)/2. Using the correct data warms Australia as a
whole by +0.15C compared to what is released.
—————————
2963. 3 March 2009.
To David Jones BOM from Blair Trewin BOM Australia
Australian temperature data [SEC=UNCLASSIFIED]
I’ve finally had a chance to have a look at this – it turned out to be more complicated than
I thought because a change which I thought had been implemented
several years ago wasn’t.
Up until 1994 CLIMAT mean temperatures for Australia used (Tx+Tn)/2. In 1994, apparently as part of a shift to generating CLIMAT messages automatically from
what was then the new database (previously they were calculated
on-station), a change was made to calculating as the mean of all available
three-hourly observations (apparently without regard to data completeness,
which made for some interesting results in a couple of months when one
station wasn’t staffed overnight).
What was supposed to happen (once we noticed this problem in 2003 or thereabouts) was that we were going to revert to (tx+Tn)/2, for historical
consistency, and resend values from the 1994-2003 period. I have, however,
discovered that the reversion never happened.
In a 2004 paper I found that using the mean of all three-hourly observations rather
than (Tx+Tn)/2 produced a bias of approximately -0.15 C in mean
temperatures averaged over Australia (at individual stations the bias is
quite station-specific, being a function of the position of stations
(and local sunrise/sunset times) within their time zone.
Perhaps this is a good end point. It shows that CRU and some of its people were unprepared to participate in the normal conduct of science; that they tried to thwart progress; that they invented reasons to explain disarray of their data, which disappeared and reappeared episodically; that they were prepared to flaunt Freedom of Information laws; that as Harry the programmer wrote, they were prepared to fabricate data; that they were manipulative; that they were Hell-bent on pushing a cause to the extent of rejecting wise counsel.
Perhaps, in regard to the start of this article, Warwick should have asked “Are your data worth having” before he asked if he could have some. There is good case that they were wrong then; and that they are wrong now, 2 decades later.
Credits:
Besides Warwick Hughes and trivial me, there were others seeking data from CRU. The list is too long for complete mention, but several stand out. These include Steven McIntyre of Canada, whose “Climate Audit” blog shows sophisticated analytical prowess. They include Douglas Keenan, whose legal investigations of the Chinese component of Jones at al 1990 paper were most revealing; and Willis Eschenbach, whose article on the Anthony Watts blog “Watt’s Up With That?” is on somewhat similar lines to my article above. (see http://wattsupwiththat.com/2011/11/27/an-open-letter-to-dr-phil-jones-of-the-uea-cru/ )
Willis wrote, inter alia, about Phil Jones –
“Rather than just saying that, however, you came up with a host of totally bogus reasons why you could not give me the data. Those were lies, Phil. You and David Palmer flat-out lied to my faceabout why you couldn’t send me the data.”
This makes an appropriate ending to my piece.
——————————————————————
Disclaimer: Apart from verbatim quotes by others, views expressed in this guest post are those of the author.
*Of course Sherwood Idso, Richard Lindzen, Roy Spencer, John Christie, Pat Michaels etc were all skeptics tackling this from professional positions at the time.


I do not know whether AGW is serious or not. It appears that the data are poorly managed and of questionable veracity. It is a poor basis on which to damage and encumber the economy.
10
And yet you had skeptic Richard Muller do an independent analysis of the data, and he concluded that it was good. You have satellite data which show much the same trends as the various land based temperature records.
It is highly unlikely that there is anything major wrong with the temperature data.
00
It is the nature of scientists, or is in most fields of science, to be skeptical of their own findings and to try to find something wrong with it. To attempt to prevent anyone from finding something wrong with one’s conclusions is an obvious perversion of science and is not science at all.
00
“…skeptic Richard Muller…” 3 words which should simply never appear one after the other. You might have more success at trying to bang your drum if you don’t make such ridiculous statements…..but then you’re a warmist so that’s asking way too much to isn’t it? Hyperbole is an alarmist’s middle name.
00
GrazingGoat,
You could try reading his 2004 paper at http://www.technologyreview.com/energy/13830/
“Global Warming Bombshell: A prime piece of evidence linking human activity to climate change turns out to be an artifact of poor mathematics.” which shows that he was a skeptic.
However unlike some, who claim to be skeptics but aren’t, he was prepared to continue reviewing the new evidence and accept the updated evidence. Michael’s Manns research has been thoroughly checked, and the criticisms made against it have been shown to be inconsequential to the scientific conclusions. Contrarians can always claim the need for ‘more evidence’ and pretend to be skeptics, but without any scientific evidence to suggest Mann was wrong the continued attacks on him are based on denialism not skepticism.
00
Where does he claim to be a skeptic? Link please,to him saying it. Preferably on video.
00
JB
You are so wet behind the ears – and you demonstrate it daily with EVERY comment you place on this site!!
Science isn’t about HIDING your data but providing it WILLINGLY to anyone who wants it so your hypothesis can be scrutinised and tested.
But it’s VERY obvious that Phil Jones et al don’t want to release their data as they KNOW the result will be detrimental to their AGW religion (and they couldn’t have that could they – they couldn’t have their snouts in the trough if the TRUTH were to come out now could they?)
But what does JB do – in spite of all the released emails from Climategate I & II and the FACTS that have come to light in these emails about “hiding the decline”, “losing the data”, “finding the data (again)”, “refusing FOI requests”, “casting aspersions on fellow scientists” ETC ETC ETC – yes JB continues with his blind allegiance to the ship of fools that is heading for the rocks soon to be destroyed by none other than the TRUTH!!!
JB – you demonstrate by your comments and actions that you are also a fool!!
Cheers,
00
Take out all the fudges over hundreds of years and UHI you have diddly squat of warming.
Bring back the dead thermometers in rural areas and kill those in cities and airports you have cooling. John you are holding the wrong end of the stick it is not getting warmer.
00
That cooling must be what’s driving the rapid decline of Arctic ice! Now I get it!
00
Is this the ice you mean?
http://www.dailymail.co.uk/news/article-2083542/Tanker-carrying-supplies-stranded-Alaskan-village-gets-stuck-ice-flows-crosses-frigid-Bering-Sea.html
00
Yup Siliggy, that’d be ice in the middle of winter right? Hmmmm, gee never thought the Arctic would be cold and icy in winter, who’d thunk it!
Seriously, you’re not denying that the Arctic ice volume and area are in rapid decline are you? That would take denial to a whole new level. Or maybe not.
00
PS Siliggy, not even Anthony Watts would try that one!
00
[snip – speculative, no content -Jo]
00
Arctic Sea Ice News
Mmmm, an average determined by twenty one years of satellite data?
Rapid decline??? Three and a half percent per decade based on four decades of data is hardly proof of rapid decline. How’s the Antarctic going? Surely if it was Global Warming it would be in rapid (cough, cough) decline too.
Only Al Gore’s chamber boy would try that one on!
Amazing!
00
Let me see. So cooling temperatures in your mind produce declining ice? Have I got that right?
00
The link.
00
Those words in that blockquote are yours. Got any link to prove that the global sea ice is in rapid decline or are you to expect us to only focus on the Arctic?
I could always use the warmist excuse to explain the MWP…it is only localised, not global.
The link that didn’t work is up now. I suggest you have a look at ALL of it. Might learn something perhaps, I did.
00
Hey Temp, if you’re curious about that ice melt that seems to be your primary argument as to why we should join the AGW religion you should look at natural causes:
NASA’s Jet Propulsion Lab: Major Impact On Arctic Sea Ice Melt Is Nature’s Own ‘Arctic Oscillation’
Whoops, looks like you’re barking up the wrong iceberg there claiming CO2 or AGW…
Too bad for you but it’s okay your high priests will still gladly take your money and pat you on the head for being a good little follower.
00
Mmmm, still trending down I see.
“This summer, the weather was not as extreme as 2007, so it was surprising that ice extent dropped so low. The low ice extent, along with data on ice age, suggests that the Arctic ice cover remains thin and vulnerable to summer melt.”
From the link you posted. Yup that’ll do it, cooling global temps and increasing ice loss. I dips me lid, you guys have re-written the laws of physics.
00
Temp The Arctic ice is not the thickest in early January that happens in early March.
You need to come to grips with natural cycles. Any idea when Artic melt rate will again be as fast as it was between 1848 and 1903?
“The plan was that we would
spend the winter in Gjøahavn in Canada,
just as Amundsen did. But heavy ice put
paid to that. 300 nautical miles short of
our goal we were forced to turn back.”
http://www.nwp.solinova.no/media/Stromme/KnowHow_nr3_2003.pdf
00
I looked again Siliggy, Arctic ice still dropping while global temperatures plummet. That’s just got me flummoxed!
00
Patience Temp as Prof N.N. Subkov showed in 1932 the Arctic ice melt depends a lot on the water temperature near Florida four years or more earlier.
Read this while you wait for those recent fish freezes to make it up there.
http://iain-cameron.blogspot.com/2007/07/aberdonians-arctic-feat.html
00
Temp,
You carry on like a stuck pig because of a small global decline in ice coverage. Please refer to the term inter glacial.
00
Arctic ice volume from 16.8 thousand cubic km’s to 4.3 thousand cubic km’s in 32 years. You call that small Madjak? Yeah you’re right, it’s only a tiny decrease. Never mind though cos global temperatures are falling so it will soon recover as Monckton and Bastardi both predict any time soon.
00
I had a look at both those links Siliggy, sort of interesting (but irrelevant)old yarns about the early days. Not much empirical data though is there?
00
temp,
I was talking about global ice – not just arctic ice.
please don’t obfuscate
00
Yup, I checked global ice again Mad. Still trending down despite the fall in global temperatures. Any ideas? Anyone?
00
Here you go temp (is that short for temporary cognisance?) a ‘luke’ warmer reckons that the ice is just fine
http://noconsensus.wordpress.com/2012/01/11/oops-we-hit-average/
00
Yep, checked that and again I see how rapidly that global sea ice volume is dropping. Think you need to widen your search a bit there Streetcred.
People, I think we need to focus on why cooling global temperatures results in a massive drop in ice volume. No-one seems to be able to be able to give me an answer.
PS; no need to be rude Streetcred, just asking a question.
00
Temp,
So we come full circle again (this is slow going). I will repeat. Look up the term inter glacial.
00
Mad, that’s fine I looked that up but given that we’re going in to cooler times (on the “down” slope of the interglacial as it were) I still can’t get an answer as to why the ice volume has dropped so dramatically.
00
Temp are you talking about the rapid decline of ice in the arctic or some rapid decline of ice in antarctica?
Sea ice is allways going to be most vulnerable near the end of an interglacial period. Luckily it ain’t gonna make much of a difference to sea levels eh mate!
00
@Temp
January 11, 2012 at 8:03 am · Reply
You dare mock the settled climate science of the UN-IPCC?
Says the Goracle:
Here’s your chance to bet on the minimum 2012 Arctic sea ice extent.
Intrade, The world’s leading Prediction Market–
Minimum Arctic ice extent for 2012 to be greater than 2007 is 69.0% probable
Good luck, Temp. Put your house on it.
00
Handjive, like many you are confusing sea ice area with sea ice volume, two very different things. After all even if the area was the same but only a few cm’s thick it wouldn’t really compensate for ice that might have been metres thick and multi-year in origin. But I continue to seek an answer for the question of the apparent contradiction between ice volume decline ( I’ve seen it described as a “death spiral” by some scientists) and declining global temperatures. Anyone?
00
But Temp, you know its warming! None of the residents here deny that its warming, just ask them.
00
But JB, everyone knows that the temperature is falling. Don’t they?
00
This has been explained to you several times! Are you a slow learner?
The day is NOT hottest at midday.
The year is NOT hottest at the summer solstice.
The Arctic ice volume is not at its minimum when the longer natural cycles are at their maximum. There is a phase delay. Most extreme hot weather in the U.S. occured during the “Dust bowl” thities. The artic ice volume kept going down LONG after.
A little wooden ship!
00
Oh crap JB .. Muller’s work was a waste of time using only temperature from land based stations and his conclusion was that the data did not suggest AGW. Infact.. his conclusion didn’t suggest anything other than the planet was warming..big deal natural behaviour
00
What Bloody planet are you living on mate?
2143. 19 June 2007.
From Phil Jones to Tom Wigley.
…which reckons that 30-40% of the warming
there is urban related. Not keen on it being said this way, but need to
read the paper beyond the abstract and the urban section.
As for pointers, yes stress this is just USHCN and not global…
And you talk about temp data being incorruptible!!
Oh Dear JB, please wake up and smell the roses!!
It is 2012, not 1220 !! Just accept the fact you are wrong !! And you cannot lynch us, we will not go away.
We are angry about what is happening with this AGW Scam and the proliferation of Scammers, UN gold diggers and bankers into our economy.
This is not what our forebears slaved for!!
This is not what my Grandpa fought for in WWII.
As an Australian Citizen I am entitled to leadership from someone who tells the truth!
That is not happening JB. And you perpetuate the entire myth continually without a pang of guilt!
00
That looks like a comment a troll would make. Contradicting exactly the well-supported argument made in the main article and referenced materials; contradiction without providing any supporting materials… like a substantially FULL and credible data set.
You’ve had a long time to look at the data. As did “Harry”. How did you, as a dilettante, arrive at a different conclusion to the professional engaged to turn the sow’s ear into a silk purse? And failing to do so?
Do you have only the opinions of those who agree with for support?
Do you not understand interpolation of data such as what is used by CRU to fill the gaping chasms of missing data are inappropriate? That the integrity and applicability of those methods rely on continuous data records? The established methods for dealing with sparse and irregularly-spaced data are somewhat more complicated than the statistics taught in 5th year high school.
Of course the data aren’t important to the CRU (or IPCC and those others who benefit from the fraud). They have sufficient assumptions to plug all the voids. Until somebody asks for the real data. That is when their universe of illusion and self-delusion collapses. When they have to show their work.
The unwillingness of CRU to provide data indicates that the CRU probably knew that it was doing wrong; that it’s not just a matter of monumental incompetence. Which is precisely why the CRU restricted access to the data.
00
I think you are deliberately baiting people John, because I know you’ve been reading material here for a while.Therefore you should know:
1. Richard Muller was not/is not a sceptic and nor is his daughter who also worked on the project. Muller has been scathing of the Michael Mann ‘Hockey Stick’ graph and referred to it as “just bad maths” but in the same article on June 23, 2006 by the San Francisco Chronicle he also said he believes the odds were 2 in 3 that “humans are causing global warming.” So he does not doubt global warming and believed in mid 2006 that humans were at least a 67% chance as being the cause for global warming. Hardly the description of a sceptic as is generally labelled in the Climate Science debate.
2. Muller’s project did no analysis or checking of temperature data. All they did was take all the temperature station data provided from the key sources of surface temperature data and plotted that. It showed a warming trend.
3. Muller’s project did not analyse any of the re-engineering, adjustment or homogenisation of temperature data carried out by those sources. Of course his team was not in a position to do so. If Phil Jones from the CRU is correct in stating they do not have the original temperature records, only the adjusted/homogenised temperatures, they Muller will never be able to do so with current data bases. They will have to wait the estimated three years it will take the UK Met office to check, re-build and publish the actual temperature records.
4. As pointed out by someone else, Muller’s team, while including more temperature stations than ever before, still only used the land surface temperature records. This covers very little of the world’s land surface area. And land covers less than 30% of total global surface area. Muller states himself that they still need to combine sea surface temperatures and satellite measurements to get a complete picture of global surface temperature change.
5. As Muller also made very clear in the Project’s report, though the comment was ignored by climate alarmists and the main stream media, (and you John), the project team made no comment how much of any warming, is caused by natural variability and what component is human caused. As we already know, the IPCC has no way of actually calculating this figure because there are too many climate variables they do not adequately understand. Therefore they cannot properly calculate a human component. Studies which have attempted to do so in the past have only made broad assumptions in order to make their conclusions.
00
I have more thing to say JB about this AGW BS which is summarised here.
I know it’s only one site but the records show very little warming of any kind over the past 120 yrs.
00
Brookes you can be such an A** sometimes. You are also a LIAR, that’s L. I. A. R. LIAR.
Muller WAS NEVER A SCEPTIC. This has been pointed out numerous times. THIS IS YET ANOTHER LIE BY ALARMISTS REGURGITATED BY [snip] LIKE YOU.
Lets get the record straight.
Here is a link to an interview of Muller where he is asked..
What should a President McCain or Obama know about global warming?
But you knew this John yet lied about it. My patience has run out for you John.
You work at a university, you are supposed to SET AN EXAMPLE TO YOUNG PEOPLE yet you misrepresent and lie.
You can also watch one of his uni lectures FROM 2008 on youtube HERE.
This is 12 parts but a short section on part 2 from about the 4 minute mark will show any reasonable minded person that RICHARD MULLER WAS NEVER A SCEPTIC.
This means alarmist lemmings like John Brookes LIE by saying Muller was a sceptic who converted.
John, I’ve been very friendly with and supportive of you here on Jos blog, but this is not on, this is an outright lie and I’m calling you out on it.
I give permission to Jos mods to provide you my details so as you can SUE ME PLEASE JOHN. We’ll settle it in front of an independent magistrate.
Else you can retract your comment at #1.1 and apologise for misleading this blogs readers.
Oh by the way, wipe that smug look off your face. It’s time you got a different gravatar. [snip]
00
He was a skeptic. I’ve seen video of him ranting about bad climate science, trotting out skeptical memes. If I could be bothered, I’d find the link, but because you’ve been a very rude man, I’m not going to 😉
00
No no no not so easy chump.
As Memory vault details further below #12, what got up Mullers nose was the blatant bad science. THIS DOES NOT MAKE HIM A SCEPTIC OF AGW. Do you understand that Brookes?
How on Earth do fools like you get gigs at universities? i fear for our future, IT’S WORSE THAN I THOUGHT.
Retract your lie and apologise John
00
Your a classy character aren’t you Baa. Such urbanity, so suave.
00
Are you a hot or cold Temp ?
Are you a troll?
Are you so uninformed you would call into character the moral capacities of one of this blogs leading lights without even a hint of proof of such slurs.
You Sir are an Abomination! (I feel like Lord Monckton)!
Catch ya later Temp, when you have found some mercury …aka balls….
🙂
00
You can take your class and shove it where the sun don’t shine.
When morons blatantly lie, when their “fun games” aid and abet the perpetuation of a UN scam leading to higher costs, I throw class to the wind.
Look moron, I work long long arduous hours. Encouraged by [snip namecalling …communist leaning lefties] like you, our governments on all levels, federal state and local have flushed billions of OUR HARD EARNED down the toilet.
So yes you are correct, I have no class when it comes to blatant, designed for a cause lie, uttered by the likes of Brookes.
p.s. I actually like Brookes, ask him, he’ll verify.
And isn’t he lucky I don’t dislike him.
00
Maybe you need a break Baa, you’re sounding stressed.
00
Yes, you are spot on correct.
Maybe John was in the wrong place at the wrong time.
As soon as he apologises for knowingly lying, I’ll apologise for my rant.
00
As usual, John, you make an unsubstantiated claim! This is entirely understandable coming from you, John. After all, the satellite data show no measurable increase in temperatures so it would be impossible for you to do so without employing an end point fallacy. Your contention is, of course, typical as it was conjured up by you, a CAGW “useful idiot”!
Hansen predicted in his 1988 Scenario B ( business as usual ) that temperatures were supposed to rise from the “noise” by the 1990’s… but that didn’t happen. In fact, the reason Hansen’s numbers differ from the satellite data is that they were, with the exception of the “Y2K” error discovered by Steve Macintyre,
fraudulently manipulatedadjusted to show past temperatures as cooler and recent temperatures as warmer. Did you ever pause and ponder why, with the exception of the Y2K incident, Jimbo’s numbers are always adjusted in a way to bolster the CAGW hypothesis? If mistakes are made, shouldn’t some of the adjustments be made in the opposite direction? That would require critical thinking which, as demonstrated by EVERY comment you have ever posted on this site, eludes you!I would ask you to cite and post links to substantiate your claims but that would be about as worthwhile an endeavor as asking the village idiot to represent his hamlet in a spelling bee!
Rumor has it that they are preparing to make a docudrama about the three stooges. I highly recommend you audition for the role of Shemp!
00
Satellites say what?
00
Dumbass, what would the satellites say from say 200(X)?
Rweeeally warm here……..NOT!
Oh my toes are dipped in the cool Pacific and as I sway them back and forth they feel so cool ….AHHHHH the toes are gone ACID! my toes are dissolved AHH HHHHA HHHHH!
NOT
So sad two nots for you
00
Hey Tristan, Take a look at the new (next) thread here: http://joannenova.com.au/2012/01/nir-shaviv-on-ipccs-exaggerated-climate-sensitivity-and-the-emperors-new-clothes/
How does that fit with your fears?
00
Sorry, John B. hasn’t enough hair to do Shemp….
00
Nyuk nyuk nyuk!
Tony.
00
Eddy, there are two problems with that statement.
Firstly, the statement has no meaning unless a baseline is identified for comparison, i.e.- increased relative to what. If you were talking about the linear trend of the entire satellite record then Tristan is correct, as can be verified from anywhere (eg, UAH TLT straight from the horse’s mouth.) Perhaps you meant some other window, though this potentially creates a start point fallacy. Even with the (spotty) Hadley sea surface temperature and the RUTI Coastal one sees a linear fit is positive after 2000.
The second main problem with this statement is because you were probably talking about climate, not weather. The WMO defines climate as a 30 year average of temperature and rainfall and we have had satellites for only 31 years, so we have only gathered…. 1 single data point of modern climate from satellites. Can’t draw a trend line with only 1 data point. We have to wait until 2040.
I cop a lot of stick when I raise this 2nd point with
alarmistswarm blooded creatures as they seem to think I’m “conveniently defining away the problem”. I see it as simple arithmetic applied to the basic WMO definition of climate, plus a desire to use the best instrumentation available, but such logic is kryptonite to the Catastropharian mythos. By contrast, I trust you shall suffer no ill effects from it.Plus we all know these things operate in cycles. Even a sine curve looks steep at zero degrees. Extracting a slow anthropogenic linear residual from this slow cyclic natural variation must surely qualify as “extreme sport” and of course most who try it with so few data are nuts!
00
So, you would support CERN, if it was to come out and say, “Yes, we’ve found the Higgs – it’s at 115eV. However, no you cannot see the data. We’ve spent too much time and money getting to this point and all you lot are going to do is try and prove that we are wrong. If you want to do that, go and build your own large hadron collider.”
Science, the Brookes way?
00
A rather poor analogy. More like if an Einstein skeptics asking for data. There is no point giving it to them, as they won’t change their mind, no matter what the data says. Worse still, they’ll perform dodgy analysis on the data, and then claim that the scientists own data disproves relativity.
Of course I’m talking about Einstein skeptics there. Climate skeptics would never stoop so low 😉
Anyhow, it seems as though scientists are sharing more and more of their climate data these days. Once they got used to the idea of skeptics wanting it, they’ve decided to let them have it.
00
Nice fail, John. Your failures are improving, I am impressed.
Einstein famously said words to the effect:
“No number of experiments and no amount of analysis can prove the theory of relativity right. But it only takes one one verifiable experiment to prove the theory wrong.”
And that may now be the case, because it would appear that the Hadron Collider may have found particles that travel faster than the speed of light.
00
Rereke, Newtonian gravity was wrong. It’s been improved on by General Relativity. There were tiny discrepancies between observations and the predictions based on Newtonian gravity. Does this mean that Newtonian gravity wasn’t a useful theory? For the vast majority of purposes, it supplied results to the level of accuracy required. So the common misconception that somehow finding any flaw in AGW invalidates everything about AGW is just plain wrong. It may, but you’d have to show that it did before anyone would worry too much.
As for faster than light neutrinos, my money is that they will eventually find something subtle that was not correctly taken into account, and they will just be ordinary slower than light neutrinos after all. But certainly a great experiment, and providing lots of fun!
00
John – what the failures in climate science does tell us is that we shouldn’t be spending trillions in inadequate measures fighting a problem which is poorly defined and has large uncertainties.
So while it’s valid to quibble over the details, it’s not valid to try and centrally-plan a solution with inadequate and inefficient technology when there is so much uncertainty involved. No capital spending should be done with large uncertainties – let alone the 3-400% variations in the ‘accepted’ models.
By all means, continue the climate science debate forever and a day. But quit trying to implement hare-brained taxes, schemes and capital diversion over uncertain, unproven and likely wrong details.
00
*Sigh*…John, you know so little about epistemology that you don’t even know when to be ashamed…
The REAL common misconception is that easy confirmations prove a theory. It doesn’t. Drought in Australia, cyclones in Queensland and anomalous heavy snow in Canada prove nothing. It’s a well understood phenomena that when you have an appealing narrative suddenly the mind’s eye can see patterns of confirmation everywhere.
A good hypothesis, according to Karl Popper, “… is a prohibition: it forbids certain things to happen. The more a theory forbids, the better it is.”
But Warmist want the CAGW hypothesis to be framed just so as to be irrefutable and untestable. That’s why they now call it Climate Change.
Karl Popper….
Read the whole thing and weep…
http://www.stephenjaygould.org/ctrl/popper_falsification.html
00
In Medicine, Wes, we call it the “eye of faith”, often seeing what we expect to see, in light of our previous experience.
A similar example, again in medicine, can be given with a female patient with puzzling lower abdominal pain. If I send her to a Gynaecologist, often the diagnoses hit upon at least initially are those centred on gynaecological causes, but if I send them to a General Surgeon, then every other diagnosis other than a gynaecological one is entertained first. It’s not a question of competence or territorial behaviour, just differing perspectives. Scientists must approach their data and their hypotheses with an unprejudiced perspective, or this will colour their interpretation of results, or even the results themselves if certain “adjustments” and “corrections” have to be made, as we have seen with the shambolical mess that comprises the global weather station data. Karl Popper is absolutely spot on. And just for the record, IMO, Freud projected much of his own psychopathology upon his patients, many of whom may have been far less screwed up than the good doctor. His “clinical observations” were thus through the prism of his own neuroses.
00
Agree with you in part Wes. Confirmation bias does lead to people seeing what they want to see. But time tends to fix this, as people have the shutters lifted from their eyes and see things how they really are.
That is why I think another 10 – 20 years is needed to be sure.
But I still think the weight of evidence is sufficient to have us act now.
00
Act how, John?
The only technology capable of replacing coal-fired power stations in nuclear. But the lead time on building reactors means that significant generation wouldn’t be possible for at least 10 years, possibly 20. In this country at least, there is no nuclear industry, legislation needs to be changed, sites need to be identified, etc etc etc. If it was done worldwide, the demands for nuclear engineers would outstrip supply by a large amount, driving up the prices.
Or do you mean to (snigger) suggest that taxing everyone for electricity usage is somehow equivalent to ‘acting now’.
This is where you go from mildly amusing to absurd.
You insist we should ‘act now’ but the only thing we can do is stop producing electricity and stop driving cars and flying planes, and shipping goods by sea. Of course this isn’t possible, but you’d be happy if everyone bought a couple of solar panels and got a bicycle, even though the effect is just a rounding error.
The ‘threat’ is subject to massive uncertainties in prediction (none have been correct so far), and the ‘solution’ is to wind back the industrial economy to levels last seen in the 1800s, when the world supported a much smaller population.
But instead you’d rather raise a bit of taxation, hand it over to some bureaucrats and expect it all to work out fine?
00
Well done Geoff,
I hope this is brought to the attention of the politicians. It could influence Hunt and make him realise that there are a number in BOM who have been manipulating data and are just plain incompetent (as Warwick Hughes has been demonstrating on his blog eg http://www.warwickhughes.com/blog/?p=1234). However, it is unlikely that Turnbull will see reason. The Liberals need to get rid of him.
00
Your link to Hughes is wrong
It has an extra
http// in the middle
It should be
http://www.warwickhughes.com/cru86/wood.htm
—————————–
Thanks 🙂 Fixed. JN
00
To unravel dud data takes eons compared to the time taken to get it right in the first place. The CRU didn’t get it right and have a vested interest in not unraveling the mistakes, they are very interested in grants. The cost to the university in the work needed to get it right would near bankrupt them. This saga isn’t about the process of scientific review, it’s about the economic security of East Anglia University.
To stress our economy and retard our growth and development based on anything that has come out of the CRU and trumped up by the IPCC is irresponsible.
00
In summary, people have hassled climate scientists, largely to annoy them.
So how do you guys explain the reasonable match between surface and satellite temperature records?
00
Simple. Both surface and satellite records show the same thing. There is no AGW.
00
All known global temperature records show a temperature increase of 0.14 +- 0.01 degrees per decade over the past thirty years and the non satellite records take that trend back another 20 years.
If you have any global studies that contradict this feel free to post them.
—–
REPLY: And if you have any evidence that shows CO2 caused all that warming, feel free to post it. Jo
00
Jo,
To quote the National Research Council of America(2010):
“Some scientific conclusions or theories have been so thoroughly examined and tested, and supported by so many independent observations and results, that their likelihood of subsequently being found to be wrong is vanishingly small. Such conclusions and theories are then regarded as settled facts. This is the case for the conclusions that the Earth system is warming and that much of this warming is very likely due to human activities.”
There are so many reputable sources available, that nothing I can put up here will have any impact on your readers views.
As your views are now completely outside the scientific norm it is up to you to justify your position. The records all show warming over the past 50 years.
There comes a point when claiming that yet more research is needed is no longer skepticism. The world has other things to spend its scientific research money on. Demanding yet more money be spent to hunt the vanishingly small possibility that you are right, is contrary to your position that we are already spending too much on what you term a ‘scam’. If you can’t present any serious evidence for your position, then perhaps it is time to acknowledge your inability to do so.
————————-
REPLY: You can quote many committees opinions, but no actual peer reviewed papers with observations that show CO2 leads to more than 1.2 C per doubling. Your case is based on a logical fallacy, you have no scientific evidence, except a recent weak correlation which could have been caused by something else. Based on this you want our money, and insist that we prove you are wrong? There is a point when you have to admit your faith is religious. But we realize you are nowhere near that point. Shame. — Jo
00
Jo,
Lets try to stick to the topic. Warcroft claimed there was no evidence or warming in the temperature record. I pointed out that all the global temperature records show warming going back 50 years for ground records and for the lifetime of the satellite records. And I might add the rate of increase and the short term variations are also closely aligned indicating a high probability that they are correct.
Do you accept WarCrofts position or mine?
The committees, IPCC and NRC examine the evidence from thousands of scientific papers.
What would one more paper provided to you add to the debate?
As for your observation about CO2 causing the increase.
We have Arrenhuis’s hypothesis that increased CO2 would cause warming.
We have multiple studies, Keeling Curve and others, showing that atmospheric CO2 is increasing.
We have ground and satellite measurements showing that temperature is increasing.
We have thousands of scientific papers showing warming in the natural environment, and very few showing the reverse.
The only known significant sources of the CO2 increase are human use of fossil fuels and changes in land use patterns.
In the absence of a body of contradictory evidence, which you cannot produce, this is overwhelming evidence confirming that anthropogenic global warming is occurring.
Your reply wants evidence that the impact of forcing is no more than 20% above the predicted impact. Lets get you to agree that GW is occurring as predicted by Arrenhuis and is Anthropogenic. Once you have acknowledged that the science is firm on this, we can start debating the extent of the forcing component.
————————
REPLY: I have stated numerous times that the world is warming – and has been for 300 years. It doesn’t correlate with our CO2 emissions.
RE: Keeling curves and warming – yes, as I said, you have a weak recent correlation. The causation (Arrhenius) applies only to 1.2 degrees of the 3.3C predicted by the IPCC. (See Hansen 1984 and Bony 2006, AR4 Chapter 8 and 9). Therefore the rest above that is based on assumptions and speculation, and you have no observations to back up those assumptions about feedbacks and water-vapor, which I have discussed many times on this blog. We do quote evidence all the time, see Spencer 2007, 2008, 2011, Lindzen 2009, 2010, Paltridge 2009, McKitrick 2010, McKitrick 2011, Anagnostopolous 2010, Christie 2010, Douglass 2007, Fu 2011, Karl 2006, …
00
Consensus was not, is not, and will not ever be scientific proof.
The chances of an entire field of scientists all being completely wrong is very high.
We know this because countless discarded scientific theories were all, at one point, the ‘scientific consensus’ supported by many committees, councils, organisations and other self-supporting cabals of self-satisfied smugness.
At all times, anyone going against the ‘consensus’ is considered a kook, a maverick, a renegade, someone not to be trusted for their strange ideas. And sure enough, many are just counter-opinion kooks with no basis. But that is the weakest of flimsy justifications for supporting a position based on a show of hands.
There are so many instances where an almost-unanimous agreement on a theory turned out to be completely, 100% wrong. It would be harder to find new scientific knowledge that came through and didn’t overturn an existing consensus. Nearly all that we know and can prove today at one point or another overturned an existing point of view.
In fact, you could say that the chances of a scientific theory being correct are lower than the chances of it being incorrect.
Of course, none of this disproves the man-made catastrophic global warming theory any more than it proves it. The point is that counting votes, shows of hands, scientific papers or anything else means nothing. Proof, facts and evidence are all the counts.
You don’t even appear to understand the argument, saying that, because the last 50 years were warmer than the prior 50, case is closed, and somehow the null hypothesis is reversed. That somehow an imaginary threshold has been crossed and it’s up to everyone else to prove a negative, which is an impossible task.
You really should go away and have a hard think about what you’re writing. I understand being passionate about a topic and straining to keep a lid on the vitriol against your opponents, but that doesn’t excuse sloppy logic and poor reasoning. And that’s exactly what you’ve displayed in the above two posts. You embarass your position by going on with pseudo-scientific nonsense about academies and votes and consensus positions.
10
brc, I vote that Jo gives your comment a big star!
Have you noticed that the warmist arguments are running out of steam?
All they can do now is demonstrate their willed ignorance and recycle their logical fallacies. Unfortunately, Logic and reasoning will not cure those afflicted with willed ignorance.
I suspect they are running out of steam because they refuse to burn coal, build nuclear stations or build hydro-dams to generate any more. Solar and wind just won’t cut it. 8)
00
Jo,
The warming since the little ice age was about 0.15 degrees per century. The current warming is about 0.15 degrees per decade an entirely different rate. Current warming is far greater than that predicted by Arrenhuis.
http://en.wikipedia.org/wiki/Temperature_record_of_the_past_1000_years
http://www.ncdc.noaa.gov/paleo/recons.html
Do you have any evidence to contest this view.
The exact measure of the additional forcing is debated by scientists but all the studies show it to be more than double Arrenhuis’s prediction. There is strong correlation with the more recent predictions.
None of the five statements I made are based on assumptions or speculation they are all facts. Please identify any that you think are based on assumptions or speculation.
I said:
We have Arrenhuis’s hypothesis that increased CO2 would cause warming.
We have multiple studies, Keeling Curve and others, showing that atmospheric CO2 is increasing.
We have ground and satellite measurements showing that temperature is increasing.
We have thousands of scientific papers showing warming in the natural environment, and very few showing the reverse.
The only known significant sources of the CO2 increase are human use of fossil fuels and changes in land use patterns.
All facts!!!
I haven’t made any assumptions about water vapour or forcings, in fact I haven’t even mentioned them prior to this post.
BRC makes the point that consensus is not proof. Indeed it isn’t, however consensus based on overwhelming evidence is much more convincing than skepticism based on amateurish refutations.
There is a consensus that Geelong won last years grand final, there are many newspaper references to them winning and many individuals claim that they saw them win. But there is no PROOF. You can’t prove that Geelong won the grand final, this doesn’t justify believing that Collingwood won.
BRC should identify some of the scientific theories, (based on scientific methodology not belief), that have been completely reversed or 100% wrong so we can assess they amount of evidence that existed to support them before they were reversed. “All Swans are White” springs to mind but not much else.
—————–
REPLY: David you are not getting my point. I did provide evidence, and I pointed out that even assuming that all your correlations are relevant, even assuming that the IPCC are right, all the “evidence” you provide only supports 1.2 degrees of warming. Everything above that is due to the feedbacks in models. Repeat after me, 1.2 C is not equal to 3.3 C. The direct effect of CO2 per doubling, is only suggested to be 1.2C at most by the IPCC and all your favourite scientists. You don’t need to mention assumptions about water vapor feedback, because you quote IPCC et al conclusions, you ARE assuming their assumptions are right, even though you are apparently unaware of that. Read AR4 Chapter 8 approx page 631 632. You can keep repeating Arrhenius/Keeling/CO2/Hadcrut in your ritual loop, but it only shows you don’t realize that is only evidence (and a weak correlation to boot) of warming of 1.2C at most Jo
00
Happy to.
I’ll start with the theory that the sun revolved around the earth.
Next we’ll go to the miasma or ‘mal air’ theory of disease.
We’ll stop in at Phlogiston and Luminiferous aether, both famous theories in their time which survived for a long time.
No list would be complete without a discussion of the various geological theories that were replaced with plate tectonics.
For more modern examples we can look at the creation of stomach ulcers from Helicobacteria instead of stress, which won two Australians the nobel prize.
They are just off the top of my head, and are the more famous ones. All the old ‘facts’ were held in wide esteem and you would have been considered a crank if you argued against any of them, from the Royal Society down to your local schoolteacher. All were mostly or completely wrong.
Your grand final analogy is a hopeless soup of muddled ideas. For a start, a grand final is a chaotic event that will never repeat the same events twice. So if, by proof, you mean we assembly the crowd, umpires and teams and replay it, no, that’s not possible. But that doesn’t strengthen your argument at all – if anything it makes you look more at sea, grasping for a way to explain yourself.
You not only fall into the ‘everyone has a consensus’ trap, but you barely managed to escape that before collapsing into the ‘but it got warm’ trap, failing to realise that, in order to get catastrophic global warming, you have to have runaway positive feedback loops in order to get the catastrophe, instead of milder weather similar to the MWP.
Keep going, your education will be complete at some point. It helps if you repeat to yourself daily ‘correlation is not causation. correlation is not causation’.
00
Jo,
You keep trying to deflect the discussion by introducing things I have not claimed or mentioned.
I haven’t referred to the IPCC or any scientists except Michael Mann who, as far as I am aware, has not done any research on climate feedbacks. I am not basing my views on any assumptions, just the five facts stated above and your statements about the predicted 1.2 degree warming / doubling CO2.
If the effect of CO2 doubling is 1.2 degrees of warming, and that CO2 doubling is a consequence of our use of fossil fuels, which you are not disputing, then that is AGW. At a rough approximation, according to Arrenhuis’s calculations, the 30% increase in CO2 seen in the past 100 years, approximates to 0.4 degrees of warming. The temperature records show double that. The current observations show that the effect is much greater than that predicted by Arrenhuis. All we need to know to understand that, is to understand the basic predictions of Arrenhuis, an understanding of logarithms and acknowledgement that the temperature records are reasonably accurate.
Arrenhuis predicted that CO2 increases would cause warming, the temperature records verify his prediction. The hypothesis is confirmed because observations match the predictions not because there is a correlation between increasing temperatures and increasing CO2 levels. Correlation without cause is not evidence. Observations that match predictions do constitute evidence. Consensus without evidence is not proof, Correlation without cause is not proof. However Consensus with evidence provides a clear indication for the case. Correlation with known causes also provide confirming evidence.
Remember 1.2deg / doubling CO2 caused by human CO2 emissions is global warming, arguing about the quantum of forcing is just quibbling about the price as Oscar Wilde said.
——————————
DavidR — The prediction did not match the observation except in the sloppiest sense. The steepest decadal trend in the first half of the century was exactly the same as the steepest decadal trend in the latter half, yet 85% of our emissions occurred in the second half. And if 1.2C = the 3.3 C IPCC prediction (whose quibbling eh?) I’ve got a bridge to sell you, who cares about the price?
Indeed the steepest decadal trend in the 1880’s was the same as the 1980’s. What caused the warming for the 200 years before our emissions rose, and what evidence do you have that forcing has stopped? — Jo
00
Jo @ 5.1.1.1.6
now I know you are clutching at straws,
not only was the period 1880 to 1890 a period of cooling, but the fastest period of warming in the last half of the 19th Century, 1860-80 was only two thirds of the trend from 1950-2010.
CO2 emissions started increasing in the beginning of the 19th century, the global warming we reflect that increase.
—

REPLY: My bad –sorry, I should have said the 1870s, not the 1880s, and there goes your theory. No, the decadal trend was not larger after we put out CO2 en masse. It was practically identical – ask Phil Jones. And which dataset tells you the 1950 – 2010 trend was decadally two thirds larger, or does 20 years equal 60 years for you like 1.2C equals 3.3C? — Jo
00
Jo @5.1.1.17
amazing how much bad science you can pack into one small reply.
1. Inaccuracy: The graph is inaccurate, the temperature trend from 1860-1880 was less than 0.11 / decade not 1.63. It was only 0.16 for 1870-1880.
2. Cobbling: Only the underlying graph comes from Hadley, the rest of the information has been added by somebody else.
3. Mis-accreditation, there is no way that Phil Jones was responsible for the calculations on the right.
4. Cherry Picking: While the 1870’s did see a 0.163 temperature trend, this was entirely anomalous for the last half of the 19th century, where the trend was less than 0.1 per century. In fact the temperature trend was downward from 1865-1875 and from 1875-1885 demonstrating that decadal trends are meeaningless in this discussion.
So are you prepared to agree that the 20th Century warming trend 0f 0.7 per century is much more significant than the 0.1-2 per century since the LIA.
(You have failed to show the small warming trends as being unusual or accelerating) CTS
—————
REPLY: The graph is accurate, the trend was 0.163/decade, the quote comes from Phil Jones (see the table here). Your accusations are wrong. You need to apologize. Jo
00
[SNIP excuses. Davidr you accused me of misrepresenting the data, cobbling a graph, and misaccrediting it. You were wrong. A polite person would withdraw the allegations and apologize. Dishonest rude commenters fail the bar for posting on this site. Jo]
00
Most short-term atmospheric deviations was (and are) due to ENSO. Long-term warming is predominantly driven by the sun. Neither have stopped. The level of solar forcing is currently falling (it was rising during the 1910-40 period) yet the temperatures keep going up.
00
Quoted from DR, who quoted from somewhere else as he could not have dreamt this up himself.
“The only known significant sources of the CO2 increase are human use of fossil fuels and changes in land use patterns”.
Assessment.
Easily fooled and has never heard of subsurface vulcanism, expression of Co2 from liquids etc.
Scientific Comment.
Human origin CO2 is so small, quantitatively, that it cannot be meaningfully involved in influencing the world’s climate.
De de de de du.
🙂
00
Jo,
I did NOT accuse you of “misrepresenting the data, cobbling a graph, and misaccrediting it”,
[SNIP lol – fail]
—–
D, read your first line #5.1.1.1.8.
Don’t waste my time. – J
00
For once I’m inclined to agree with you JB.
I’m quite sure the prospect of being caught out red-handed lying, perpetrating fraud, cheating, fudging and falsifying data, stacking the peer-review system, and clandestinely plotting to get people fired, amongst a multitude of other illegal, immoral and unethical activities, would be most annoying.
00
Would that be like Hansen’s surface records?
Revised DOWNWARDS all the way back to 1880, nearly every month last year and at least six times in December alone.
I can make ANY two data sets “reasonably match” John, if I am allowed to alter one every time the sets start to diverge.
“Historical record” ????
What a joke.
00
Citation please.
00
I’m sorry Tristan, but I can’t see why I should share my source documentation with you, when all you want to do is prove me wrong.
On the other hand you might try googling it.
Google is your friend.
00
Not to sure about google with Al Gore on the board-
heres some of Hansons bullshit.
http://www.appinsys.com/GlobalWarming/US_NoWarming.htm
00
Comment of the day!
00
In summary, John, the best way forward for these AGW pseudo-scientists is to maintain proper records and a healthy respect for the the Scientific Method. That being the case they would not get hassled for data … as poor as what it might be … and they would consequently not feel emotionally distraught as the prospect of being found out to frauds.
00
Sorry Streetcred,
but isn’t that a bit like suggesting the way for politicians to improve their image is to stop telling lies.
Or the only way for MSM journalists to regain their credibility is to actually start reporting the facts?
Don’t hold your breath.
00
Deliberate trolling John, and you know it.
Why don’t you try defending Phil Jones? Is that because his position is indefensible?
Phil Jones would not have been ‘annoyed’ if he just turned over the data. He could have published everything on an FTP site, put up links on the CRU website, and he never would have been bothered again.
But then, why would he? It’s not like the future economic direction of the industrialised economies was at stake or anything?
When the next deep freeze of the UK happens and people die in their homes because of blackouts caused by idiotic chasing of green dreams on the basis that half a degree of warming might have been caused by more co2, are you still going to defend these people? While useful idiots freak out about ‘billions of climate refugees’ that don’t exist and will never exist, real people are dying right now from real problems that can be fixed with existing technology.
The construction of ‘alternative’ power is directly related back to the IPCC, which built its scaremongering reports on the basis of corrupted and inaccurate temperature reconstructions. The IPCC could do this because they couldn’t find any refutation against the alarmism. There was no refutation of the alarmism because the original data was hidden away from those that wanted to check it.
I dare you to defend the actions of Phil Jones and his ilk. Just try.
00
OK. I’ll defend them. Numerous inquiries have been held, and each of them has exhonerated Phil and his mates of any scientific fraud.
But of course, you know that those inquiries were all whitewashes, don’t you?
00
Just like you too know that they were whitewashed … it’s a protection racket.
Nothing lees than scandalous.
00
Trying to be slippery again, which doesn’t surprise me at all, given your operating mode is to disrupt and unicorn-throw rather than engage in debate.
I didn’t ask what the enquiries came out with, I asked what you thought. That’s just another variation of argument from authority. Whether they were a whitewash or an honest attempt at accountability is a moot point when asking for your opinion.
Let’s try again.
Do you think hiding the data and spending large amounts of time coming up with excuses rather than data is condonable behaviour?
You’ve read some of the emails if you read this posting. Tell us your opinion of the behaviour of Phil Jones in this instance? Are you going to stand behind your man and defend his actions?
Personally I doubt this question will ever get answered.
00
After all the damning revelations of late, only a complete and utter moron would consider the act of asking for original data as “hassling” or being for the purpose of “annoying” someone. Brookes: reading your mindless and uninformed comments here, it is clear that you post here simply to be “annoying.” I suspect on some level you are aware of this quality in yourself. Projection is a wonderful thing, eh.
00
It’s Great to see the efforts made to confront bad and fraudulent science. Geoff and Warwick are to be thanked for their efforts.
By exposing cheating, subterfuge and manipulation they help cast doubt on the science proposed by the Global Warming crowd.
The core physics of the CO2 – AGW drama is so baisc and pedestrian that I continue to be amazed that it is not pushed harder by people opposing AGW.
The Earths greenhouse effect can be summarised without much doubt as follows:
1. Warter is 95 % of the GHG Effect.
2. CO2 is 3% of the effect.
3. Other, Methane, birdfarts etc 1 or 2 %
As and example of the ferocious effect of CO2 in the atmosphere lets go retro.
From 1850 to now the AGW proponents claim that CO2 has caused a rise of 0.6 C deg.
Unscientifically they “overlooked” water as a GHG but the physics is beyond dispute as to allocation of blame: Water caused 0.57 C deg rise.
Total CO2 “caused” 0.03 C deg of the rise.
Now that’s not much is it, but it’s not over yet.
Human origin CO2 is only about 4% of ALL CO2 which means that we caused 0.0012 C deg of the rise.
There are other problems for warmers. I only took the assumption that the GHG Effect was the sole cause of the rise.
In fact it is more likely that other factors, take your pick from orbital effects and so on, are the main temperature moderators.
Never the less the Human Origin CO2 effect is irrelevant and I despair every time I read someone say “we acknowledge that humans “cause” some warming”.
Maybe we need to push the science a bit more.
It is being hidden behind walls of interesting but diverting discussion.
00
The corollary of the above is that it is
PHYSICALLY IMPOSSIBLE FOR HUMAN ORIGIN CO2 TO “CAUSE” RUNAWAY GLOBAL WARMING.
00
In going through the climategate emails, I do not get the impression of fraud or intent to defraud. To commit fraud you need to have a plan that is agreed to, and acted out, by all parties – a script if you will.
What we see is too random to be a planned fraud.
The lasting impression I get from the emails is one of total incompetence. These are two ulcer guys in a four ulcer job. And to mix metaphors, they are spending most of their time trying to keep their respective heads above water.
I say they are incompetent because they appear to have little understanding of the tools they are using (the models), and have been sloppy with their data, and the consistency of their approach. The “Harry Read Me” file is sufficient to support that opinion.
They have created a false impression with their sponsors, which they then have to keep supporting with lies and “tricks”, to maintain their credibility, and they live in fear of the truth being outed.
A research project of this magnitude and importance, needs a formal information management plan, and independent audit. Neither of which has even been discussed in the correspondence I have seen.
They are self-confessed amateurs at managing their own data. No professional would loose data, only to “find” it again, and then once more “misplace” it. The fact that they tried to use that line as an excuse speaks volumes about their naivety and lack of professionalism.
00
The attempt to hide what they were doing; to prevent others from checking; indicates that they probably knew that they were inept/wrong.
The fraud is not in the representation of the data; but in passing themselves off as being competent, top-line scientists in their respective fields.
00
Yes Bernd, I totally agree with that.
On further thinking:
Lets assume that a scientist has made observations that can have two possible interpretations; one of which has the potential to attract ongoing external funding, and the other, while academically interesting, does not.
Which will they choose? Will they choose academic correctness, or will they choose ongoing funding?
Which path will the organisation they work for choose? Which option with the providers of the funding prefer?
That was a decision that was faced at multiple levels, and people made the decisions they made, for reasons that only they know.
Fraud does require intent, especially when multiple parties are involved, this was bad bureaucratic decision making, at every level right up to the politicians.
Conclusion: A bad funding model leads to bad scientific research.
00
Rereke I do disagree with you
00
in respect to fraud or its intention
00
Val,
Do you think it was planned?
Or was it a case of the cash register draw being left open and unattended?
Or was the fraud perpetrated at a level in the bureaucracy that was higher than the scientists at the work-face?
I am genuinely interested in the reasons behind your comment.
00
John Brookes January 10, 2012 at 6:11 pm And yet you had skeptic Richard Muller do an independent analysis of the data….
You are wrong again. Is it a pattern that you make accusatory statements off the cuff, while you have done little to no work of your own?
I spent hundreds of hours of unfunded personal time working up the Australian portion of the data selected by Muller/BEST, being an initial 589 Australian sites. To my knowledge, this corrected work has never been used in BEST, which was released in a form that needed more feedback and more work. I have no dog in the race about whether cooling or warming is good or bad; I simply want the science to be good. If I have to shame other scientists into a better effort, then I shall.
My personal preview of the Australian data looked initially at about 100 sites that might be pristine, narrowed down to 60 because of missing data in the tested decades, lowered again to 44 sites because of missing/poor quality data. I have not taken the work beyond looking at the 44 pristine sites because their trends are all over the shop and I cannot find significance in any measured extraneous variable that can explain the wide differences of trends from site to site. The trends (on a linear extrapolation to keep it easy to express, but not very scientific) vary from about -1.5 deg C/century to +4.7 deg C/century, period 1972 to 2006 incl., for these isolated sites with few people nearby. Thus, a baseline pristine average could not be calculated because the noise was too great.
My initial conclusion is that the golbal data are so messed about that there is inadequate data quality to draw any inferences of value. It follows that I think the BEST project was shaped by a great deal of noise, some natural and some created, and likewise has little value – nor is value recoverable. These days I tend to work most with UAH satellite temperature data from the 1970s onwards.
The satellites have restricted the poetic licence of the adjusters.
00
Geoffery, the BEST people developed algorithms to take account of missing data, discontinuities in the data etc. Their whole point was to remove subjective human judgement from the processing of the data – because they suspected that errors or worse had crept into the data when it was processed. They also wanted to use as much of the available data as possible. If a weather station only operated for 20 years, they wanted to use that data, but to weight it appropriately when combining it with other data.
So you have data “untouched by human hands”, which is as complete as it can be, and it shows that the other temperature records are correct. It seems like a great approach to me.
Removing sites from the data because they don’t have a complete record is very wasteful. How did you decide which sites were “pristine”, and which had poor quality data? Was it an objective process, or was human judgement required?
00
Tell me John,
Did you actually READ Geoff’s post?
Or would such a close encounter with reality have been too painful?
00
Complete and utter gibberish John:
http://wattsupwiththat.com/2011/10/24/what-the-best-data-actually-says/
http://climateaudit.org/2011/12/20/berkeley-very-rural-data/
00
I look forward to Geoff’s peer-reviewed paper on Australian temperature data quality.
I also look forward to his peer-reviewed paper that demonstrates that the amount of noise in the global surface station data makes BEST’s approach statistically invalid.
Until either point Geoff’s comment is just be another case of “Man on blog disproves !”
00
“Man on blog disproves |insert scientific field|!”
00
“Man on blog disproves |
insert scientific field| heavily-fudged data from co-opted scientists!”There, fixed it for you.
00
“Man on blog disproves |insert scientific field|!”
Immature adolescent male with pimples and a habit of wet dreams continues to dream the dream…
Do you have a poster of Phil Jones on your Ceiling ???
🙂 HAHAHA , Sorry couln`t help it !! 🙂
00
The lemming says…
What this alarmist lemming Tristan is saying folks is that HE HIMSELF CANNOT READ AND COMPREHEND WHAT HAS BEEN PRESENTED.
This alarmist troll lemming needs some “peers” to do the gray matter work and spoon feed him.
Of course, as we have experienced over and over and over again with alarmist lemmings like Tristan here, if a paper IS published after passing “peer” review but it’s conclusions aren’t “oh my god we’re doomed, we have to cut back on civilization” then that’s not “peer” review at all and the journal it was published in is a junk science journal.
Have I got that right Tristan?
It can be easily proved that you are asking for a peer reviewed published paper for mischievous reasons. You have NO INTENTION of accepting Geoffs conclusions EVEN if he publishes.
The proof will be in your answer to the following question..
CAN YOU NAME AND CITE ONE SINGLE PEER REVIEWED PUBLISHED PAPER THAT IS SCEPTICAL OF AGW THAT YOU AGREE WITH?
Your answer is?
00
Tristan,
I look forward to the day when you have something actually useful to say.
00
Best dumped their findings into the world prematurely to pump up the crap in Durban, it would seem peer review is a problem as it is a load of cow pats some what lower in the scale of reality than BS.
00
John, has BEST actually gone through peer review yet? I know he says the UHI effect doesn’t affect the temperature record, he then went on to say nobody could be sceptical that the temperatures rose in the 20th century. As nobody is sceptical about the temperature rise just its accuracy and what caused it, this was the non-statement of the decade. If you’ve seen the paper you will no doubt be aware that it’s blown a hole a ten metres in diameter in the good ship “Catastrophic Global Warmin” and that is that they have calculated that the temperature in the US rose by 1C from 1810 to 1900. How did that happen humans were emitting trivial amounts of CO2 in that period?
00
“So you have data “untouched by human hands”, which is as complete as it can be, and it shows that the other temperature records are correct.”
Have a look at the Harry Read Me files, Climategate 1 JB
FOIA\documents\HARRY_READ_ME.txt. “getting seriously fed up with the state of the Australian data. so many new stations have been introduced, so many false references.. so many changes that aren’t documented. Every time a cloud forms I’m presented with a bewildering selection of similar-sounding sites, some with references, some with WMO codes, and some with both. And if I look up the station metadata with
one of the local references, chances are the WMO code will be wrong (another station will have it) and the lat/lon will be wrong too.
■I am very sorry to report that the rest of the databases seem to be in nearly as poor a state as Australia was. There are hundreds if not thousands of pairs of dummy stations, one with no WMO and one with, usually overlapping and with the same station name and very similar coordinates.
I know it could be old and new stations, but why such large overlaps if that’s the case? Aarrggghhh!
There truly is no end in sight.”
00
OK. Not quite untouched by human hands!
00
OK John, I used to think you were uninformed and misguided — but if you really believe what you just said, you’re dumber than a box of rocks.
An algorithm, John, is just a way of doing a calculation — a set of specific instructions. An algorithm is developed by a human who uses his or her subjective judgement and knowledge to create the instructions.
When an algorithm is run by a computer, it does not magically transend the judgement of the human who wrote it — it implements it.
The Climategate “HarryReadMe” file is a good example of the way in which “computer algorithms” are chosen to give a predetermined result.
00
Perhaps this blind faith in the transcendency of algorithms carries over into the blind faith in computer models in general (which are simply collections of algorithms).
This might explain the irrational faith AGW “believers” exhibit (and their strong tendency to define things as a matter of belief, as in: “I hear you don’t believe in Global Warming”). We even had a troll a few threads back who thought that running programs on a “supercomputer” made them more believable than running them on an ordinary computer.
Are these people on the verge of worshipping computers? Perhaps we should counter with our own models (which would then be identified with the devil).
If I were King of the World, I would sentence them to a year of programming computers — that would surely destroy any tendency towards deifying them.
00
Bob,
As a reformed modeller, I can vouch for what you say. All I will add is that there are often several ways of defining and implementing an algorithm, some will be more accurate than others, and some will be easier to implement than others (calculation of the area under a curve, for example). Which will the modeller choose? The one that is most accurate? The one that take all of the potential errors into account? The one that allows for, and manages, “noise”?
Nope, none of the above. They will choose the simplest algorithm to implement that they can get away with, and lets them go to lunch early.
In this era of pre-packaged algorithms, that will be the one that is immediately to hand, not necessarily the one that is best suited to the situation.
00
JB
You state “the BEST people developed algorithms to take account of missing data, discontinuities in the data etc. Their whole point was to remove subjective human judgement from the processing of the data”
Are you UNABLE to see the contradiction of your statement BEFORE posting?
Have a look next time you post – there is a preview button at the bottom of the text box – read what you’ve written in future so we don’t have to waste time filtering your BS.
As I said in my earlier post above – you continue to prove to all and sundry here that you are indeed a fool.
Cheers,
00
No, I can’t see any contradiction.
An algorithm (its his way of birth control, by the way) can be published (and in the case of BEST, I’m pretty sure they have published theirs). Then anyone can look at it and see if they think it is reasonable. By looking at the algorithm, they know how each and every piece of data has been used.
This is vastly different to humans making many, many judgement calls on how to handle the mountains of data. There is no way that each and every decision will be documented and made available for scrutiny.
The very reason Muller decided to do BEST was because he didn’t trust the thousands of individual decisions people had made in preparing the raw data for use. But his conclusion was that, whatever had been done to the raw data, it worked pretty well.
00
OK, I did this (looked at the algorithms, not used the rhythm method). The descriptions of the algorithms can be found here, and the source code for the programs that implement them is here.
So far, so good. Bravo for BEST.
Well, not exactly. If you read the algorithm description linked above (see also here), you find that they make at least a half-dozen assumptions about the data. I am unable to find any reference to any tests they did (on real data) to see if those assumptions were warranted. (They did a few Monte-Carlo tests on simulated data, but that does not justify applying the same assumptions to real data, as your simulation itself is dependent on a number of assumptions.)
The worst assumption I found was the very first one: The “New mathematical framework” for determining global temperature from the station data (Equation 1, on page 7, here).
This equation assumes that the temperature at any location on Earth consists of the global temperature component, plus two zero mean adjustments:
1) A spatially variant (but temporarily invariant) geographic component which is supposed to represent climatic differences due to lattitude, altitude, and other positional dependent issues at a given station; and
2) Another zero mean component (which can vary both spatially and temporarily) which is meant to represent the weather.
This model is bogus, and using it pretty much guarentees the outcome.
Why? Note that the only component of the model that doesn’t average to zero over time and space is the global temperature component. Therefore, any one-directional change in a station’s bias over time will automatically be counted as a component of global temperature. For example, rural stations that slowly become surrounded by the city, or stations whose micro-climate bias slowly increases due to construction of nearby buildings, roads, installation of air conditioners, etc, will all be taken as indicating increasing global temperatures.
There are a number of other things in the methodology that seem dicy to me, such as:
* Assuming that stations that don’t follow the average correlation due to distance, latitude and altitude are in error. (Note that this can’t account for stations that are nearby, but have different situations, such as in or out of a city or desert — or stations on either side of a narrow mountain range which divides weather patterns.) This was apparently an attempt to simplify the geographical component in the model.
* Defining “station error” as the difference between the station and the model.
* Using said station error to determine outliers to reject. This methodology automatically verifies the model, regardless of what the data says. (Maybe they learned statistics from Michael Mann?)
* Never testing these assumptions with real station studies, such as those at SurfaceStations.org; or by looking at the Urban Heat Island satellite maps.
In addition, there are a bunch of statistical methods used that I cannot comment on, as I’m not a statistician. William Briggs IS a statistician, however, and here is his critique. He also doesn’t like what he sees.
A better conclusion would be: If you do the same thing to the data (albeit in a slightly different way) you will get the same answer. NASA ignores UHI, BEST defines it as global warming. Both get the same answer.
00
There you go again BobC, applying a scientific approach to lambasting poor John B.
Since he won’t thank you, allow me.
Did anyone really think that the “BEST” rework was going to amount to much of a difference in the “consensus”?
00
I have to admit, Mark, that I was shocked when I realized that their “new mathematical framework” was equivalent to defining any slow change in a station’s biases to changes in global temperatures. I find it hard to understand how a bunch of “scientists” could not see that. Even NASA or CRU doesn’t go that far — they just use bogus studies (done in China, using stations that don’t exist) to “prove” that UHI effect is negligible.
Muller’s statement that there is no reason to be skeptic about AGW because “the world is warming” is astonishingly dumb. Perhaps these guys really are stupid?
I actually took these guys at their word when they started — I guess I’m just naive.
00
Hi Geoff. Where is this published? Is the raw date ready for release?
00
If you had 44 reasonably pristine sites, what was the difficulty in calculating an average trend. It looks to me that, with trends ranging from -1.5 to +4.2 the average trend was going to be significantly positive. If you could calculate the trend for each site then you should be able to calculate the average trend. The fact that the trends vary widely between individual sites is to be expected. There is plenty of evidence to show that temperature variations are not consistent across all sites.
00
David R,
The trends of which I speak are linear fits to a few decades of data obtained by averaging daily data into annual data.
I do not like this trend simplification and I have stated that the trend fit is more to please the eye than the scientist.
There are large potential errors involved in the confidence of taking averages of averages of poor fits. It’s like over smoothing. Yes, you can derive a number, but what use is it?
Partly on purpose, I used a time interval when global and national maps show a sharp temperature rise, if you assume that they are accurate (and I do not, ab initio). It would not surprise me to find a slight rising avergage of trends, but it would rattle around between huge error bounds, which you can ignore at your peril.
One error which is emerging as significant is the treatment of data when readings changes from one Tmax and one Tmin a day (Tmean being their arithmetic average), to a system of many readings per day and a different mathematical treatment to get daily means. Since various of the 44 sites went through this process at different years, we have a good example of why one should not further average the trends.
00
OT to Jo~ Has the format changed? I can no longer do a ‘thumbs down’ for johnny brookes, and he Desperately needs them!
00
Just doing my job Otter, just doing my job. But Jo, he’s right, the thumbs aren’t working.
00
They weren’t working yesterday as well 🙁
00
But they are now.
00
Dear Jo,
I read your site for balance. If John Brookes job is to hijack your threads with a activism it diminishes the quality of your blog and its purpose.
00
Markus,
John plays the role of court jester – he stops us all getting soooo serious. 🙂
00
John Brookes January 10, 2012 at 7:44 pm · Geoffery (sic), the BEST people developed algorithms to take account of missing data, discontinuities in the data etc…..
That was their aim, but that does not mean that they achieved that aim. There are many examples where my copy of the BEST data is plainly wrong, like stations plotting in the sea and so on.
There is no other way than subjective to describe pristine. In a mineral exploration careeer of some decades, one gets to many remote locations, often time and again. Local knowledge can be incorporated into the judgement. Frankly, it has to be. Look at the problem BEST had with Moomba, a FIFO operation where residents were not permitted to buy housing on the leases, so the population, derived from a census of principal place of residence, is recorded as zero or near to that. This makes using LIGHTS a conflict, because it’s a beacon in the desert 24/7 …..
There was a miniscule amount or missing data in my study. It would have no significance on the findings. That makes a better data set than BEST, which invented more values. You really have to use metadata and it is conspicuously lacking on the public record. To the best of my knowledge, the pristine sites I nominated did not have station moves; or population moves of significance. If I could not make sense out of these data, then BEST could make only worse sense. There is no point in proceeding past pristine if pristine is so noisy. BEST did and they got the results they deserve.
Please, do cease attacking me because I did a better job than BEST; and you seem not to have done any.
00
Just so you know Geoff, if you publish and your results are roughly concordant with the various other surface temp reconstructions, your work will be attacked by the very people who are currently rooting for you.
00
You are a BullShit liar. But then, that says it about the vast majority of your side of the argument. The remainder don’t know enough to lie convincingly.
00
Oh, but they can lie convincingly. That is what created this problem in the first place. The problem is that they cannot lie consistently, and feel that they have to keep moving the goal posts all the time.
00
I don’t know. Tristan describes pretty well what happened to Muller. Mind you, there were people who told Anthony Watts not to trust Muller…
00
There were people who told Julius not to trust Brutus, also.
00
Et Tu, John
00
Gee Aye “Hi Geoff. Where is this published? Is the raw date ready for release?”
The form of the data is 3 x 44 graphs, showing Tmax, Tmin and calculated Tmean for 44 subjectively-selected pristine stations. This is followed by calculations of linear least squares trends (to help the eye more than the science)for the period 1972 to 2006, chosen for data availability. The trends are then regressed against variables such as distance from main ocean, latitude, longitude, elevation and a few more.
It is unpublished and incomplete because nothing makes much sense, except noise.
If you would like a self-explanatory set of graphs without much explanation around them, email me at sherro1 at optusnet dot com dot au. Alternatively, I could say “Why should I send you my data …..?”
00
Geoff, you should do a post here. While your data may not be conclusive, it still may be interesting.
If you want the data to be representative of Australia, you’d have to combine the data taking area into account. Otherwise too many thermometers in one area would lead to that area having too much weight.
Anyhow, go for it. Could be an interesting post.
00
John, you talk of “…Otherwise too many thermometers in one area”.
I think your personal problem is too many thermometers in one area because they do not leave enough room for thumbs.
00
😉
00
Geoff
Gee – Aye and Tristan seem to have returned from holidays.
Politicians who like JB are only intent on trying to distort and distract from the real science.
Total waste of time.
00
Tristan January 10, 2012 at 9:00 “…your work will be attacked by the very people who are currently rooting for you.”
Tristan, I don’t give a stuff. You are talking emotion, I am talking science.
00
I am glad you don’t give a stuff.
As for not publishing it because it doesn’t make sense, that in itself is a meaningful statement. If you can show that BEST’s data handling was in error and that there is far too much variability and artifacting in Australian data to be used in a study such as that conducted by BEST, then that will encourage others to compile a temp reconstruction without BEST’s mistakes. You’ll be adding to the body of science by subtracting erroneous work.
00
Typical lying, cheating, mass-murdering climate cultist deflection. What Geoff actually said was:
In other words, it’s NOTHING but noise, no “trends” – warming or cooling, no discernible patterns, just “noise”. Nothing of consequence TO report.
Just how would you suggest Geoff write the covering letter to a journal, Tristan:
By the way Tristan, anything to report yet on why
CrookCook over at Septic Science feels the need to “disappear” uncomfortable comments?00
That’s a nice way to add to the scientific debate MV(“lying, cheating, mass murdering climate cultist..”). We should all approach this debate in such a calm and rational manner. You are an example to us all. Well done sir!
00
Does any attempted temperature reconstruction matter, whatever it shows? The alarmism of the whole AGW theory is largely based on two hotly disputed points.
1. That the rather modest 0.6C to 0.8C alleged rise in “global mean temperature” claimed over the last 160 years (coming out of The Little Ice Age)is “unprecedented”.
2. That the alleged “unprecedented” rise cannot be explained by natural variability as has been the case for millions of years of climate history, but has been caused by increased human-induced greenhouse gases, carbon dioxide in particular.
No empirical evidence has so far been produced to validate either of these claims, nor has there been any to support the alarmist contention that further increases in CO2 would lead to runaway Catastrophic Anthropogenic Global Warming!
The most ridiculous claim put forward on the basis of unvalidated unfalsifiable projections from demonstrably inadequate computer modelling, is that Man, in the face of all the vast forces at play in the many known and unknown factors that affect our climate, can either “stop” global warming (or cooling) or “limit/control” any such rises or falls.
00
I have a couple edits.
——-
The
alarmism of thewhole AGW theory is largely based on twohotly disputedpoints.1. That the
rather modest0.6C to 0.8Callegedrise in “global mean temperature”claimedover the last160 years (coming out of The Little Ice Age)is “unprecedented”.2. That the
alleged“unprecedented” rise cannot be explained by natural variability as has been the case for millions of years of climate history, but has been caused by increased human-induced greenhouse gases, carbon dioxide in particular.Noempirical evidence has so far been produced to validateeither ofthese claims.00
Okay then Tristan, off you go – empirical evidence of:
1: – That any rise in temperatures in the last 160 years has been “unprecedented“.
2: – That any rise cannot be explained by natural variability.
3: – That any rise CAN be shown to be caused by “greenhouse gases” – CO2 in particular.
4: – That the actual CO2 in question (the stuff causing said rise in temperatures that cannot be explained by natural variability), is human-induced.
By the way Tristan, empirical evidence is the observable, measurable stuff, NOT a computer model. The Foster and Rahmstorf paper is NOT empirical evidence.
It is a computer model of of what the two authors THINK is happening when they eliminate all the things they THINK might be responsible for natural variability.
00
Hi MV
As I’ve mentioned before there is no basic physics which supports the Human Origin CO2 warming contention.
The warmers of the IPCC and University Environment Faculties don’t worry too much about the science.
Man made global warming via CO2 is a physical impossibility.
00
Citation please.
The two SS links to hockeystick-stick look-a-like graphs you provided were a bit of a hoot, but seriously, is that your empirical evidence?
Also note: reference to this or that “extreme” weather event or projected guesses from dodgy GCM’s does not represent empirical evidence either!
AGW believers use “unprecedented” seemingly without any understanding of its meaning. You and they would do well to check the link given by Val Majkus @ 24 and in the light of those documented historic events reassess whether any recent climate and/or weather event really could be considered “unprecedented”.
http://www.c3headlines.com/bad-stuff-happens.html
a list of past severe weather events and associated news from the past.
00
Sorry Keith(s), if peer-reviewed papers don’t count as citations, and temperature measurements don’t count as observations then I can’t help you.
Maybe you can start your epistemological epiphany with this book.
00
….
00
Slither, slither, slither.
Tell me Tristan, do people like you produce your own slime – like slugs – or do you breed them and milk them for what you need to slither around on your belly.
In your post you weren’t talking about “citations” (votes from the consensus “team”). Your oh so clever “edited statement” was:
You were challenged to produce your “empirical” (observed, measured) “evidence”, and so far all you have provided is a link to a couple of guys interpretation of the results of a computer algorithm they themselves wrote.
It matters not one whit if their algorithm uses some actual temperature records. All they are offering in their paper is their own interpretation of the results of their own algorithm applied to that data.
That is hardly the “empirical evidence” you have offered to supply.
Now, put up or shut up.
00
Hi MV
Luv the image.
sliver, sliver ……
The three of them are here to disrupt and cause damage to the operation of this blogg.
Sorry that should be 4, left out JB.
His avatar and comments are so average I almost forgot.
00
memoryvault: The graphs Tristan linked to were indeed genuine empirical measurements, but almost none of them are temperature measurements… they are proxies for temperature (e.g. tree rings) that may or may not have some correlation with actual temperature (or water, or sunlight, or whatever).
Even if they were temperature measurements, the processing and filtering of the data is different for every series, making it meaningless to attempt to stitch them together and figure out a trend. The estimates of uncertainty are obviously wrong because many of the temperature proxies fall outside of each other’s uncertainty, and it still doesn’t explain the Viking settlements in Greenland. Worse, we can still see that Mann’s Nature trick (to hide the decline) is in operation because the “divergence problem” cannot be seen in the graph; so you know the data is tampered and cherry-picked up the whazoo.
I wouldn’t worry too much, the debt situation and rising oil prices are game changers. No more can we contemplate exactly how much lint sits in our navels.
00
Tristan, you are a mental disability most of us hope we never get. Go and get an intellect. Most websites would have banned such a malicious troll.
00
Nice work Tom, no ad hominems here eh?
00
Hi Temp, Tristan and Gee – Aye,
Nice to see you guys back from Christmas break and hard at work.
00
That wasn’t an ad hom. That was an insult.
An ad hom would be to say your facts are wrong because you have a mental disability and are without intellect.
If someone just calls you a name without actually trying to use that to disprove a point, it’s not an ad hominem argument fallacy.
I wish people would understand it better.
00
Hi Keith, hope your holidays went well.
Tom, does this mean my love for you will remain unrequited?
00
Geoff
Tristan has been on this blogg for long time.
He is a politician, not really into science.
His favourite comeback used to be “and your point is?” , just tries to pull apart other people’s work.
Collecting data is the very basis of science, keep up the good work.
00
To Otter at 1.1.3 (and others)
Dr Richard Muller is not a skeptic. He has never claimed to be a skeptic. He has always been a firm believer in CAGW. He has many peer-reviewed, published papers on the subject. He has been on the CAGW gravy train for years.
Trouble was, his “research” was largely based on the “cooked” temperature records which constitute Mann’s “hockey schtick graph”. Basically, when the “climategate” emails were leaked, he saw the value of his past work reduced to trash, and he was more than mildly pissed off about it.
(Personally, I think he was even more pissed off at finding out he wasn’t part of the “inner circle” – the “team”, but that’s just my theory.)
In a webinar lecture soon after Climategate he ripped into Mann and the team, basically for making him look like an idiot. The actual lecture is nearly an hour long, and is totally supportive of the whole doom and gloom, the sky is falling, global warming scenario. No “skeptic” here.
But buried in the lecture is a small piece of less than five minutes, where he vents his spleen against Mann and the “team” for making him – and other researchers – look like idiots with their “hide the decline” subterfuge.
It is on this five minute piece of video, and this alone, that people like JB justify their branding of Muller as a “skeptic”.
Here is a link to the five minute segment:
http://www.youtube.com/watch?v=8BQpciw8suk
And here is a link to the whole webinar lecture:
http://www.youtube.com/watch?annotation_id=annotation_916464&feature=iv&src_vid=8BQpciw8suk&v=VbR0EPWgkEI
My personal opinion is that, as a result of his outburst, Muller soon realised he faced total ostracisation from the funding gravy train he had enjoyed for years, and the opportunity to head up the BEST analysis was thrown to him as a life-line – “do this, and will be forgiven, and you will be welcomed back into the fold” sort of scenario.
But that’s just my reading of events surrounding BEST.
00
“Our biggest surprise was that the new results agreed so closely with the warming values published previously by other teams in the US and the UK… This confirms that these studies were done carefully and that potential biases identified by climate change sceptics did not seriously affect their conclusions.” said Prof Muller.
00
I take it there was a point to this post John, and that you are not simply recycling electrons for the sake of it.
Damned if I can see it though.
00
So skeptics identified potential biases, eh?
A potential bias does not have any effect at all. Only biases can affect conclusions. Potential biases only possess the potential to affect conclusions. Once they affect results they are no longer potential.
Muller goes on to say these potential biases “did not seriously affect their conclusions.” So the biases are REAL, not potential, and they did affect the conclusions. It just wasn’t serious, eh?
Muller was unable to bring himself to honestly admit: “Skeptics identified biases in the studies.” This suggests that his point that these, uh, “potential biases” didn’t seriously affect any conclusions might indeed have the potential to be a biased conclusion itself.
Of course, the dead giveaway that Muller is more than potentially biased is that he smeared the critics of the AGW hypothesis as “climate change skeptics.” Obviously, no skeptics deny that the climate changes or the Earth orbits the sun. They’re skeptical that the climate change we’re trying to measure sans bias is anomalously rapid or dangerous catastrophic or perhaps even anthropogenic.
Muller is really just borrowing the old Dan Rather “fake but accurate” defence.
00
Wes, Muller’s starting point was that the existing temperature records were seriously flawed. So when he says, “did not seriously affect their conclusions”, he is admitting that his concerns had proved wrong. It is a nice, genuine, generous admission that he was wrong.
00
John, what is it with losers who lie about stuff in blog comments? As if no one will notice? duh…
You got no cred left, dude.
Scientist who said climate change sceptics had been proved wrong accused of hiding truth by colleague
Read more: http://www.dailymail.co.uk/sciencetech/article-2055191/Scientists-said-climate-change-sceptics-proved-wrong-accused-hiding-truth-colleague.html#ixzz1jD5DIval
.
00
Gotta love that scientific integrity…..
00
Once you read a statement like that from a so-called scientist, you know that, for all intents and purposes, you can ignore everything else he says.
Scientific rigor passed him by!
00
Personally, I think it is time that John Brookes changed his optician.
00
Geoff,
I have had my chain yanked by many scientists that do not want any change whatsoever to the current consensus.
Many areas of science are being missed strictly for the single calculation in a multi-diverse climate system.
Here is a good example of a problem not covered by temperature data but is occurring in Canada right now.
Ice formation in a temperature data stream that says we should not have a single piece of ice forming. Average temperature is 2 degrees Celsius for January when averaged out over this current period.
So, solar penetration of the sun is far to the south and is not allowing the penetration of water to stay warm and water is still cooling. This is defying the climate data that there should be no ice.
We have a longer cycle of night with no solar influence in warming water.
But this is not defined in the temperature data to understand our planets actions.
00
JB There is no significant warming as the satellite data you cite shows (RSS and UAH)
http://www.remss.com/data/msu/monthly_time_series/RSS_Monthly_MSU_AMSU_Channel_TLT_Anomalies_Land_and_Ocean_v03_3.txt
AMSU satellite temps 600mb graph
There is no trend
http://www.drroyspencer.com/wp-content/uploads/UAH_LT_1979_thru_December_2011.png
00
Put a linear trend to it. Its going up.
00
E.M.Smith currently has a very good topical post on the scientific method. Well worth a read.
“CRU, NCDC, and GISS not Scientific.”
http://chiefio.wordpress.com/
00
I guess you can make the figures say anything you want.
We here in Perth have just been told by the BOM that we have just lived through the hottest year on record yet a quick look through the BOM’s records show that Perth only had 5 days in the whole year when the temperature rose above 38c yet in the year 1978 we had 15 days when the temp was above 38c.
Yeah I know they were colder hot days back then because we were supposed to be going back into an ice age back then.
Interesting to that the decade 1970-79 produced 98 days above 38c while the decade 2000-09 could only muster up a lowly 72.
00
But it didn’t get as cold at night. So the averages are higher. And the averages of the averages are higher. (Yes, it’s really bad statistics.)
OK. So if what does it tell us when the night-time temperatures don’t fall as much and the daytime temperatures fail to rise so sharply?
If everything else is constant, including initial solar input, it can only be higher humidity. Basic psychrometrics. The water vapour in the air causes the same volume of air to have a significantly greater “specific heat”; i.e. for the same amount of energy exchange; there is less temperature change.
It doesn’t take a lot of water to make a big difference; just 10 grams of water vapour per cubic metre of air.
Keeping that in mind; convince me that air temperatures alone are a useful measure of the energy stored in the air.
00
I’m a bit of a skeptic about the relevance of average global temperature as a measure of the climate effect caused by a change in the atmospheric concentration of CO2. I had thought, well these weather forecasters/meteorologists/climatologists are scientists and must know what they are talking about.
As I type this I sit here in a northern suburb of Melbourne shivering, in the middle of summer, with a jacket on and listening to the patter of rain on the roof. Jones and his minions from the BOM have been prophesying since early spring that we were in for a hot dry summer this time around. So far we “got” a two day “heat wave” with rain and plenty of “cold” in between. One suspects the main reason he made this guess is because he imagines the temperature data (some of which is rigged of course, as Geoff shows) points to dry + heat waves + catastrophe.
Well these weather ignorant, buggers have already cost us Victorians billions for a desal plant because “we were never going to get dam filling rains again”.
One can see that scientists can have great (though possibly practically useless) fun playing around with some of old Svante’s ideas on CO2 as an absorber and emitter of infrared from the top of the troposphere downwards upwards and any direction in between and that selecting a proxy like average global temperature seems to be a good way to see if Svante was on the ball.
However it does seem likely that all of this temperature taking has next to nothing to do with finding out what the real or major drivers (aka the climate) of weather events are and very importantly how those drivers interact to enable ball park, at least, weather predictions. Which the present weather prophets aka meteorologists and climatologists are unable to do with any consistency.
Which probably is another way of saying we are dealing with a chaotic, partially understood climate system in which human CO2 emissions are likely to do stuff all as a driver of weather events.
00
Finally, someone with a surname of Jones who speaks sensibly about the climate. Good post Llew.
00
Llew,
The most important thing about the DESAL plants that every state got was the green tinged votes they attracted.
The functional aspects, the usefulness aspects were always irrelevant.
You could probably put a price on each vote by dividing total cost (billions) by the number of votes swayed to the cause. Probably in the order of $100,000 per vote.
It wouldn’t be accurate, though, because there is the labour force on the plants to consider.
They were going to vote that way anyhow and they were just financial beneficiaries of the largess towards the highly Unionized workforce. Plenty of O/T at good rates.
Stuff the taxpayers.
A very recent example of Government speaking with forked tongue is the Whaling activist incident. Putting aside whatever we may feel about whaling, these things are handled between governments.
First we have Nicola coming the heavy and saying they would likely be on board for 7 months and they had to face the consequences of their action.
The very next day she is spending half a million dollars to send a huge customs boat out to “Rescue” them.
This is probably necessary however, because if they were absent for 7 months their social security would lapse.
00
O/T – I encourage every sceptic to go and see happy feet 2. You won’t want to take your kids along. It’s greenwashing on a par with the 10:10ers. Utterly disgusting.
Llew,
from one Mexican to another, I agree. Even after the last non summer, I got some weird looks from colleagues when I told them this summer was going to be the same as last year. They are now very quiet. I kinda hope some of them have reached the point where they know they don’t know.
With respect to our overly expensive panic rushed desal plant, I now see the catastrafarians saying it should be used to suppliment the murray. Thats their fallback position. B*stards.
Still, I guess we deserve it for being the state that elected adam brandt into power. Bloody embarassing if you ask me.
00
In over 2 years of scouring the Internet, this thread and the comments herein strike me as the most relevant and succinct damnation of the entire AGW cult of the dollar.
I currently work in a data driven industry – Vehicle NVH (noise and vibration for motor cars)
Specifically, I take measurements with microphones and accelerometers and then try my hardest to determine what (if anything) the data means.
We try our best to control (or at least understand and quantify) the numerous variables which contribute to a noisy signal. We use statistical methods to establish confidence, reliability and repeatability.
Why do we spend the time and money on these sanity checks?
Because we actually make a product that a consumer buys and uses. The validity of our engineering directly affects the sales of the product.
Now, compare this with ‘climate science’.
These ‘scientists’ aren’t selling the public a useful machine (which is hopefully not too noisy and bumpy). They are selling the governments around the world a marketing tool for the purposes of indoctrinating the population into accepting higher taxation, higher utility prices and lower personal freedoms.
Success in the field of climate science does not depend on all of the traits that one would typically ascribe to a scientist, but rather a salesman.
00
Indeed. And any real-world data are inconvenient to that end because those data may “confuse the message”. That’s why CRU is employed to cook what little real-world data exists until it supports the models.
When governments “sell” their message, the buyers are forced to pay; even when they don’t want the product.
The most-insidious message being sold by the government isn’t climate-related; it’s democracy-related: That the government is only answerable to the voters at election time.
00
Sonny, you have (unintentionally I’m sure) greatly offended all the salesmen round the world…….
00
Nicely put Sonny.
00
Sonny – totally OT, but I’m interested in NVH measurement for an upcoming project. Where can I go to learn about measuring and quantifying NVH? Is there any resources (internet sites, ‘must read’ books, etc) you can point me to?
00
Ranking among the skeptic greats, surely, is the late John Daly. His prodigious endeavours included The Greenhouse Trap (Bantam Books, 1989). Given the delays involved in publishing a book, Daly must be at least one of the pioneering skeptics! His website, Still Waiting for Greenhouse, has lapsed. More’s the pity. Even so, its title remains pertinent!
00
On the contrary. Many many articles, comments and debates on that pioneering site are still valid today.
I commend the late Great John L Dalys site to anyone interested in good climate science.
00
Point taken. “is idle” rather than “has lapsed” would have been better. (Last update was 15 August 2008.)
00
I’m a scientific layperson but have been a fan of Warwick Hughes ever since I started to look at global warming in (I think) late 2009
I found these pages especially informative:
http://www.warwickhughes.com/climate/easterling.htm
http://www.warwickhughes.com/blog/?p=363
this page contains a Timeline of AGW research from two decades ago (cut and paste)
The last paper spells out the urban warming bias in Jones et al southern African grid point data.
http://www.warwickhughes.com/blog/?p=207 Some early contact with bias and mythology in the Australian Bureau of Meteorology BoM near two decades ago
and online at John Daly’s site http://www.john-daly.com/s-africa.htm
URBAN INFLUENCES ON
SOUTH AFRICAN TEMPERATURE TRENDS
WARWICK S. HUGHES
Tasman Institute, 457 Elizabeth Street, Melbourne, Victoria 3000 Australia
and
ROBERT C. BALLING, JR.
Office of Climatology, Arizona State University, Tempe, Arizona 85287 USA
Warwick’s work and John Daly’s work are inspirational and deserve more chronological compilation
At http://www.warwickhughes.com/blog/?p=217#comments Geoff Sherrington gets a mention ‘Here you can see some graphics of BoM data from Australian Antarctic stations, thanks to Geoff Sherrington and to the stalwart observers who ventured out in thick and thin to record these data over the decades.’
I’m not sure if that means Geoff and the others personally visited those stations
00
an e mail I received today:
http://www.c3headlines.com/bad-stuff-happens.html
a list of past severe weather events and associated news from the past. Many of these past articles are a direct result of Steve Goddard’s effort at Real Science. In addition, James Marusek has published a huge list of historical weather incidents, many of which are included below. (Modern & historical temperature charts.) (last updated: 1/1/2012)
00
val majkus,
No, I have never been to the Antarctic. My main long-term employer, however, on the discovery of a possible new mine, would quickly install a proper weather station, e.g. Jabiru, NT. This was established practice when I joined them in 1973.
John Daly was one of the early greats as I have acknowledged to many others. It remains a personal disappointment that more scientists who see scientific misbehaviour do not publicise it as John Daly and Warwick Hughes have. I would suspect that a number of BOM and CSIRO scientists would have valuable contributions to make with data hidden from public gaze at present. This suspicion is strengthened by the number of scientists who open up after they retire.
00
thanks Geoff for that elucidation – I was imagining you and the others on husky drawn sleds and I’ve just made a comment about John Daly
00
while you’re at John Daly’s website don’t miss this link http://www.john-daly.com/peerrev1.htm
The Peer Review System:
Is Climate Science Politically Corrupt?
by
John L. Daly
(Written during January, 2004, published February 22, 2004.)
John was not a scientist but an economics honours graduate – His first public foray into the global warming was a 1989 monograph “The Greenhouse Trap” published by Bantam Books, which is still relevant to the debate.
– you can read his bio here http://www.john-daly.com/obituary.htm
In his obituary it is said
Another true sceptic pioneer
00
I particularly like this one and dated 1970
It distinctly sounds like Tim Flummery but it could have been his instructor.
I love this AGW clap trap !!
00
IN THE PRESS:
GLOBAL WARMING, Chinchilla News (Qld) 4/1/07:
Sir -I read with interest the letter in 28/12/06 issue of the Chinchilla News by Gerald Patch, concerning global warming. Temperature extremes are not something new (it is through these extremes that the experts work out their averages.)
Right from when I can first remember, that is back in the early 1930s, most of our summers have been very hot and most of our winters have been very cold. I have a record kept by one of my uncles when he was still in Victoria. These records range from 1892 to 1907, during that time in December, January and February the temperature ranged from 106 to 115 degrees Fahrenheit, in Celsius 40 to 46 degrees.
Just quoting several sections out of a 1907 issue of the Charlton (Victoria) paper from which Uncle obtained his records (I have the cutting from this paper which Uncle had pasted in an old exercise book).
Quoting from this record.
“At Charlton on Tuesday the maximum shade reading at the post office was 107°. On Wednesday it improved five points, reaching 112° while on Thursday the mercury was sent up a little higher, the registration being 114°.”
Then further down in this report. “Our neighbours are suffering even worse than we are as at Swan Hill the heat reached 120°, Horsham 117°. Wycheproof 118°, Donald 116°, Korong 110°, Bort 117°.”
Further on down, “The heat has been severe in its effects on animals, particularly horses. Mr J Coatsworth, Teddywaddy, lost a draught mare, and Mr R Larmour, Shingle Hut, also lost a draught animal, while it was reported yesterday that three horses dropped dead while in a team at Barrakee.
At the end of this account from the Charlton paper there is a statement of the highest temperature recordings for the three months stated further up in this letter, of the 15 years from 1892 to 1907.
It always amazes me how these experts on global warming come to their final decisions. In this country and around the rest of the globe there are many times in summer when unseasonably cold spells are experienced. These periods should upset the balance.
But as the old saying is: “My mind is made up, so please do not confuse me with facts”.
– – Arthur Hurse, Chinchilla, Queensland.
00
Thanks for this excellent information Kevin,
Wow! Now that’s why they chose Chinchilla for the new Concentrating Solar (Solar Thermal) Power Plant.
The amount of sunlight will be perfect for a plant like this.
It’s going to produce 250MW of Power.
Huge eh!
That’s the Nameplate Capacity, the up front total.
It will actually deliver around (the ‘quoted’ maximum) 600GWH of power to consumers.
Again, wow! What a huge number 600,000,000 KWH, that KWH what most of you see on your power bill.
What this effectively means is that from that total we can work out the Capacity Factor, and from that, how many hours in a day that this wonderful plant will be delivering power for consumption, averaged over the whole year.
That CF is 27%, and extrapolated out, it means (on average) 6.5 hours of power a day.
So, construct (at a cost of $1.2 Billion) a solar plant in one of the hottest, driest, sunniest places in Australia, and you still only get power for one quarter of the day.
No problems there, because with this plant, to supply power for longer periods of time, they have also included a Natural Gas fired backup, (5 x 50MW) so the plant actually can deliver.
However, there was one small ‘spanner in the works’ with that NG backup.
The plant is restricted in the operation of this backup to around 15% of toal annual generation from all solar means.
Gee, now why would they do that if this was a perfect example of a hybrid plant actually able to deliver 24/7/365 power, you know, something (albeit at a tiny boutique level) that may be able to actually qualify as fulfilling a Base Load requirement.
You see, if they ran the NG part of the plant more than that 15% of total power delivery, the problem then becomes that this would put them above the mark for ‘those feelthy derdy polluders’ and this Plant would then be subject, right from the outset, to that
CO2 Taxprice on Carbon.Couldn’t have that now, could we? Fancy a wonderful renewable plant falling into that bracket with Top 500 ‘vandals’.
So, when Bob Brown and Christine Milne tell us hand on heart that Australia is the perfect place for Solar Power, even one of the best places for that shows that they cannot deliver, even under the best of conditions.
Analysis For Chinchilla Solar Plant
Tony.
00
Tony from Oz,
In 1954 my father and I & brother built an annexe to our home on Stanton Hill in Townsville, roughly lat 19 15 S, 146 48 E, then installed a solar hot water system made to specifications from CSIRO. Three double glazed areas each of 1 m^2, above about 20 m of copper pipe braised to black copper plate below. The storage tank was insulated by shredded, damaged war surplus army greatcoats. With 2 parents and 3 teen children, the system worked on many days of the summer but was not so hot in winter. There was no electric backup at first, but that went in soon after. This made it easier to understand what is now termed ‘spinning reserve’.
We are sceptical of families trying to emulate the experience in Melbourne, where I now live, at about 37 48 S latitude.
00
Geoff, I think that was a great “energy” investment. With the scrap value of copper I should think that you’ve done very well!
00
Geoff and all other readers,
Oddly, this is actually one form of solar power that I do agree with, to a point.
One of the largest consumers of electrical power at the residential level is in fact water heating, and even this has some things that not many people are aware of.
It depends a lot upon how hot you like your water, or for that fact, what your hot water is actually set at.
This is something very few people are even aware of, and usually they have that setting way too high, hence they consume more electrical power than necessary.
Similar to an electric jug, you know, those old ones with the coil element in the bottom, the hot water system is similar, and here I’ve reduced it to basics, so it can be more readily understood.
In a similar manner to how I explained air conditioning in one of the earlier Posts from Joanne, your hot water system operates along similar lines.
You set the temperature you want your water at, and the element keeps it at that temperature. As the water cools (slightly) it reaches a preset level, (worked from your setting) and the element turns on, heating the water until your temperature is reached and then turning it off.
Depending upon what rate you are on, then the system cycles around those two temperatures. Again, as you can see from this, set your temperature too high and the system will run more often.
So, after your shower, the system fills up with cold to replace what you have used, and the element runs to heat the water, until your setting is reached.
However, I’m of the opinion that you don’t need the water boiling hot anyway, so that setting should be at a comfortable level.
So, here’s where solar hot water comes in.
This is a different principle to solar PV, or concentrating solar. It uses the heat from the sum and the tempered glass of the rooftop panels to heat the water. That water is then stored in the tank, and if you have a relatively large tank, then the volume of water effectively means it stays ‘hotter’ for longer.
Now, unlike the solar methods for generating power, this solar process can actually utilise ‘storage’, that storage being the hot water.
Depending on the size of your family, and how often you shower, and actually, when you shower, then solar hot water is actually a good idea.
As hot water consumes anything up to one third of all residential electrical power requirements, then, there are in fact savings to be made, but here I caution that those savings are monetary only, and at the personal household level, because the odd solar hot water system here and there will result in NO savings on overall power generation whatsoever, as those large scale plants will not even notice the tiny amount not being consumed here, and will supply all the power they always do supply, hence no CO2 emissions savings at all.
Those savings, and be careful here, as NO solar hot water system supplier will make major claims, then those savings will be a percentage of a percentage of your residential power bill.
Also, be aware that it is a mandated provision that even with solar hot water, then the household hot water system must still be connected to ordinary residential power, so the unit still cycles through the night using residential power from the Grid.
So, if your solar hot water system utilises solar power to heat the water during the day, and if you have your shower late at night, then the hot water (heated by the Sun) is now replaced by cold water, and the system cycles back to your setting using normal household power.
Now see how people say that they always have hot water, and that’s also why no Company providing these systems make claims that they can save you the whole 100% component of your residential hot water bill.
In fact, I actually have a rooftop hot water system on this house I am living in here in Rockhampton, a rental admitted, and in fact, the Real Estate Agency didn’t even know the house had solar hot water. (two panels and a large tank, with the pipes through the roof space)
I have never had any occasion when there was not sufficient hot water, but I have the temperature set lower than the average.
I also have not altered my lifestyle so that purely solar power is used to heat the water, as I still shower in the late afternoon/early evening.
So, while Solar Hot water does have some benefits, they are still only marginal.
Tony.
00
Incidentally,
what people fail to understand is the government mandated house wiring law that all hot water systems must also be connected to power supplied to the residence from the grid.
So the impression is that the Solar hot water system is what keeps the water hot all the time.
This is along the same lines that people come under the false impression that residential solar PV power supplies power to the home all the time. You never really know, because if it’s not coming from the panels on the roof, it’s coming from the grid.
People also think that those rooftop solar PV panels (not hot water here, but rooftop solar PV) supply all their household power. What they fail to realise is that the grid is not their personal battery, that they can just suck the power back out of when the Sun is not shining, and anyway, with those subsidies of the feed in tariff, they are being paid for that power, not for their own consumption, but for supply back to the grid.
Solar power is not only ineffective at supplying power. It’s also just a huge monetary con, a classic case of telling you what you really want to hear, thus appeasing that ‘green’ part of those who believe.
Tony.
00
I lived in a house with solar hot water in Perth. There was a separate switch to turn on the electric booster to heat the water. For 6 months of the year that switch was always off, but in winter we’d turn it on for an hour or so each day.
It worked pretty well.
00
John,
again, this is another point where people are so ill informed.
The ‘selling point’ blurb says that there is this manual over ride switch to turn on the heating element.
This gives the impression to the usually uninformed purchaser of the system that unless you manually switch it on, then hot water is always being supplied ONLY from the solar heating process.
As I mentioned, the house wiring with respect to water heating is government mandated, and the element for all systems MUST be connected to the ordinary house wiring.
So, at all times after the Sun sets, as that system turns on when the water temp falls, then normal grid supplied power heats the water.
Ideally, if you have a solar hot water system, you should shower only in the mornings. After your shower, the hot water is depleted, so the tank fills with cold water, and now, while there is a full day of sunlight available, then the solar process heats the water.
Shower close to or after Sunset, and grid power heats the water.
That manual over ride switch is for extended periods of long overcast, or for the Winter Months when the water will not heat up to its optimum capability during daylight hours.
Anytime you use hot water after Sunset, then the system is heated via normal household power from the grid. That includes dishwashers etc.
So, having a solar hot water system, and then utilising it to its best advantage entails lifestyle changes for all the family.
Also, new solar hot water systems have just the panels on the roof and extensive piping through the roof space. The old systems just had the tank attached to the panels on the roof. Either way, an extra pump has to be utilised to get the cold water to the tank on the roof or, in the newer ones, from the tank to the panels on the roof, and that pump is run by a pretty large electric motor, which IS connected to household power.
No Company will tell you that they will save all your hot water electricity costs. Most say between 50 and 8o%, so the savings can be as low as 50% of 25% of your electricity bill, which, on average is around $350 per quarter, so the savings may only be around $40 at best.
Either way there are no reductions at all in CO2 emitted from large scale coal fired power plants.
The only reduction, if an at all, would be from plants utilised to run for short periods of time to fill the ‘Peaking Power’ periods, and even then, small increments like this would not be noticed at all.
The only way at all to change that is to fit every residence, not just houses, but apartments, high rises, work places, hospitals, everything in the whole Country with solar hot water systems, and after that find a way to convince every living Australian, man, woman, and child, to change their complete lifestyle in how they use hot water. No dishwashers. Showering only at set times during the day. Use as little hot water as possible after Sunset.
No, individual users make a choice to install solar hot water, and even then, they do not utilise them in the most effective manner. They think that just having those panels on the roof is enough to assuage their ‘green guilt’.
Because there is always hot water available, then the impression is that the solar process is ‘doing’ all of that.
The only way to really know is for areas where there is no grid power readily available, and for that house to install solar hot water. This would give a true indication of how a system like this can cope without the ‘fallback’ of grid power always being there to heat the water when the Sun don’t shine.
See how there’s never a simple answer, and also how those who have a ‘green’ leaning will always stand up for something that they really do not understand fully.
Tony.
00
Tony – I use Solar hot water.
I cut down all the trees around the pool. Now it gets lots of sun.
When the sun beats down on the water in the middle of summer it makes for a perfect swimming temperature by the afternoon, when the house shades it from the hot afternoon sun. The perfect application of solar heating, correlating supply closely with demand. Completely unnecessary at night, and no need for expensive backup in winter or cold, cloudy days.
Sure, a pile of greenery and trees had to go, but it’s OK, because I burnt a couple of tons of carbon by having them replaced with concrete. Somewhere, some other trees thanked me for the double-dose of felling their food competitors and releasing extra nutrients into the air.
But don’t get the impression I’m some sort of carbon-loving dinosaur without any enviro-conscience at all. Not this little black duck, no sirree.
You see, I used an electric chainsaw to fell the trees. Think of the grams of co2 saved by that selfless act of eschewing the noise and fun of a two-stroke driven tree-chopper.
00
Hmm!
Just musing here.
I was, er, wonderin’ what produced the Electro Motive Force to drive that electric chain saw.
Now, er, extrapolate that out to electric cars.
Is the CO2 they save by not being petrol driven more than the CO2 produced to charge them up from the grid?
Say, here’s an idea.
How about a car with a solar panel on the roof to charge a small battery for the starting process, and then to get mobile. Then, once mobile you could deploy the large wind turbine from the trailer you’d have to tow, and as the car is going through the air, that movement turns the fan that drives a generator, that supplies the power for an electric motor that drives the car and charges the large battery bank.
Oh, sorry, that’s perpetual motion isn’t it?
Maybe the idea needs some polish.
Tony.
00
Are you talking through you bottom or what?
So, please explain oh omniscient one.
When the manual switch is left off, and the weather is overcast, the water out of my electrically boosted hot water system is cool to cold.
When the switch is on, and the weather is overcast, the water is hot.
At least until whats in the tank runs out.
Well, yes cause that’s what actually happens. And it has been what happens in every house i have lived in with a solar hot water system. Leave the switch off in winter and you get a cold shower.
I’ll take that as read, but where in this mandate does it say that the ordinary house wiring must be supplying power all the time?
00
Hmm! Catamon,
I guess I must have made a mistake here.
Naah!
As I mentioned in 28.1.1.2 :
I was wondering if you understand what that actually means.
Most Solar hot water systems (most) are ‘rated’ for the charging of the electricity bill so that they only get heated during the night times, because, after all, isn’t the solar process supposed to heat the water during the day.
The water in the tank is hot. As ‘part’ of it is used for showers, the cold water replaces what was used. Some cold into a lot of (still existing) hot makes what is in the tank between warm and hot, so it is a relatively quick process to get that warm water back up to the set level.
However, if the Solar process is not working due to overcast, then what is in the tank goes cold, I mean cold. To heat that up to the set level requires an awful lot of time, much more than warm back to hot.
Silly boy!
Surely you didn’t think I’d be just, er, ‘makin’ stuff up’ now did you.
Hmm!
Isn’t this Strike three for you now. Dunno! I’ve lost count.
Tony.
00
I thought it might have been more of your “conservative” figuring actually.
But just to clarify in case i have misunderstood, are you are asserting in 28.1.1.2.3 that the electric booster is continuously supplied with power in an electrically boosted hot water solar hot water system?
It certainly appears that way.
00
Readers might find this article also interesting
http://wattsupwiththat.com/2009/03/18/finally-an-honest-quantification-of-urban-warming-by-a-major-climate-scientist/
Warwick Hughes and there’s an interesting comment there by Geoff Sherrington
And comments by waclimate
that comment links to this website:
http://www.waclimate.net/historic-wa-temperatures.html
Historic WA temperature records compared to recent BoM data
temperature enthusiasts check it out!
00
Val thanks for the interesting data.
It just proves to me that someone is lying about AGW and it seems to be BoM and CSIRO who we rest our misplaced authority with. If proven guilty of this fraud they should all be gaoled for their crimes against science and humanity but this seems to fit the post normal science bill, so I doubt anything will come of it.
The temperature records around Australia are if anything a little scary because they are reasonably stable in that over the past 150 yrs there is little variance away from the normal for most regions. Sure they have extremes which come an go but overall seem mostly flat.
00
UHI seems to start at very low population levels, perhaps 1,000. It follows the “declining exponential” curve thereafter in intensity. Only the size of the Island changes significantly.
00
A very interesting post Geoff. It adds some Australian context to the whole grubby saga of the the Team’s scientific ethics or lack thereof.
00
14 degrees at the moment in Melbourne with rain and high winds. Not tracking so well toward that hot dry summer the government BOM prognosticated. Never mind, it’s not like any of those scientists will ever be held accountable for failed predictions and failed science.
00
Of course they are! By each other. No fault too large to be rigourously ignored.
00
I endorse all the remarks about John Daly and one of the beauties of his site is that many of his original links and records survive. At the end of his article “What’s Wrong with the Surface Record” he provided a list of long-term greenfield surface station sites. One such link is to the Valentia, Ireland record dating from 1869.
John wrote: “Pending an independent review of the GISS-CRU surface record (essential given the policy implications), it is valuable nevertheless to look at individual station records, particularly those which are known to be rural, have continuous and consistent data, and are known to be properly supervised. The `ideal’ stations are those which have everything – a long-term record, no breaks, scientifically supervised, completely rural (ie. `greenfields’), and set in a climatically strategic location.
An example is Valentia in Ireland.
Valentia is located on an island in the extreme southwest of Ireland, right on the coast of County Kerry facing the North Atlantic. It is the first point of interception for the Gulf Stream entering northern Europe, and is directly exposed to the prevailing south-westerly winds which blow in from the ocean. It is the perfect location to monitor climate change.”
“There has been variation year-to-year over a 2 degree range, but no overall trend since 1869 (a year which was itself warmer than 1999). The pre-war warming is present – just, but quickly followed by a similar cooling.”
I seek the help of any fellow poster who can post the following two graphs (I don’t have the necessary skill)as I believe they illustrate perfectly why James Hansen and colleagues chose to start their records in 1880, an extremely cold year obvious in the longterm records available and also how the choice of starting date can be used to influence perceptions and give inaccurate “trends”.
http://john-daly.com/ges/surftmp/stations/valentia.gif
http://data.giss.nasa.gov/cgi-bin/gistemp/findstation.py?datatype=gistemp&data_set=13&name=Valentia
A big thank you in advance to any good Samaritan willing and able to post this interesting and enlightening comparison.
00
here’s an interesting paper Global Warming: The Origin and Nature of the Alleged Scientific Consensus
Richard S. Lindzen
1992
http://www.cato.org/pubs/regulation/regv15n2/reg15n2g.html
conclusion
sorry to keep banging on but the very nature of Jo’s post leads to a bit of retrospectivity
10
Hi Val
Those two paragraphs are a brilliant find.
00
Val @ 33.
Great find Val. What a profound and prophetic forecast from 20 years ago is encapsulated in that 2nd paragraph by Richard S Lindzen. Essentially, it has all come to pass and not one projection came from computer modelling!
00
Just an observation re ‘UHI’.
Casino has two weather stations within 300m of each other. The manual station is next to a tarred road with buildings in the near vicinity. The automatic station is on an oval with no structures or roads within 50m.
Comparing the years from 1995 (when the AWS was set up), I calculated a max temp average of 26.39C for the manual station but only 25.84C for the AWS – an 0.56C difference.
The AWS is some 5m below the manual so even with a lapse rate of 0.03C, the ‘UHI’ seems to be about 0.5C for max temps.
00
Here’s the two measuring stations Ian.
Here’s the temperature record from BoM plus the revised Torok version
The one out on the roundabout is the automatic station and has the long temperature record but the one in the caravan park was added in 95 is read everyday around 4pm.
Neither are used in the latest High Quality data.
00
at Catallaxy files
http://catallaxyfiles.com/2012/01/11/say-no-more-2/
an example of Govt funded climate research:
Project Title: Moving with dignity: a human rights approach to slow-onset climate change-related displacement and relocation in the Pacific.
Duration: 2011-2015
Total Funding: $814,913
Project Summary: At the international, regional and national levels, climate change-related displacement poses a significant challenge to law and policymakers. This project examines potential legal responses to displacement resulting from slow-onset climate change and, in particular, the feasibility of en-masse relocation of whole communities in the Pacific.
If you have time visit and make a comment
00
I’ve tried to post this on this site a couple of times and it’s got eaten by the spam machine or I’ve posted too much
http://catallaxyfiles.com/2012/01/11/say-no-more-2/
Australian Research Council (ARC) Future Fellowship
Project Title: Moving with dignity: a human rights approach to slow-onset climate change-related displacement and relocation in the Pacific.
Duration: 2011-2015
Total Funding: $814,913
Project Summary: At the international, regional and national levels, climate change-related displacement poses a significant challenge to law and policymakers. This project examines potential legal responses to displacement resulting from slow-onset climate change and, in particular, the feasibility of en-masse relocation of whole communities in the Pacific.
I’ve made a comment; if you have time make your own
What does the project summary tell you about the desired conclusion (if anything)
00
Janama
I believe that the automatic station was placed there in 1995. The manual in the caravan park is the long-term station moved from the PO many years ago. Its data goes back to 1908 and, as you say, it is the one that records Casino’s official temp.
00
for historians
The climate science peer pressure cooker
http://wattsupwiththat.com/2012/01/10/the-climate-science-peer-pressure-cooker/#more-54575
this relates to a 2002 paper published in Climate Research.
00
climate change grant details (thanks cohenite from Catallaxy files)
http://sciencespeak.com/ClimateFunding.pdf
see http://catallaxyfiles.com/2012/01/11/say-no-more-2/#comments
00
Hi Val, thanks for the link it made my day…Pickering is a national treasure 🙂
00
Mmm … the ‘UEA de Freitas Method’ has given me an idea … Let’s all write to JB’s Pro-VC and demand that he be removed from his position at the university for writing drivel.
00
Of course I write drivel Streetcred, but they only pay me peanuts…
00
Figures.
00
Oh, the irony … http://wattsupwiththat.com/2012/01/10/the-climate-science-peer-pressure-cooker/
00
The report comment button is not working.
(I will report to Jo) CTS
—-Thanks. But it works for me? Hmmm/ Jo
00
[snip, but your points are noted.] Jo
00
Baa Humbug; The Blackadder; Memoryvault;
I think you should moderate your abuse of John Brookes. Yes, I know he is annoying…that is what he sets out to be.
He is one of those people who feel important if they are the subject of attention, so the more attention he gets the more he will carry on. If everyone ignored him he would soon drift off somewhere else.
Why isn’t he on some of the Ecolooney sites? Because slavish acceptance of “authority” and general obtuseness don’t rate any attention there.
One of his interjections (#5 ‘hassled climate scientists’) calls for comment. Science is about the ability to reproduce the claimed results. Inability to do so was what sank Cold Fusion.
The fact that Jones didn’t have the figures or calculations available was very sloppy work. Of course other scientists wanted to check, that is standard practice. For Jones to then claim that he couldn’t or wouldn’t supply the information indicates that he knew the results were the result of rather shaky assumptions or methods. He should have had that information available in the Department and accessible in house, at least.
It only had to be released into the public domain once.
The overriding sense one gets from the various Climategate e-mails and the publications of the group is of third rate scientists making things up on the run, and trying to cover up when there is opposition. The conspiracy aspect seems to occur when it is suddenly realised that the flow of grants is imperilled. Hence one the “Inquiries” on Jones in which he was the science expert who got to comment on his work. And Mann’s old University has spent at least $1,000,000 fighting to have his e-mails kept secret (in the teeth of FOI) from the prosecutor who wants to check if there was any fraud. What do those University administrators know?
00
I really don’t understand how his work could have been published at all if the data wasn’t included in the paper, how is this the scientific method?
Any scientist worth his salt would welcome the opportunity for another scientist to refute his work but not in Jones case. This work should be cast out into the dustbin of history unless he releases the data and shows his working.
I had a Math teacher during High School which I believed had the best concept of the subject. It entailed the showing of all working when dealing with an equation and he would mark exams on that pretext. Even if you had the wrong answer he was interested in the method you used to get the result and whether or not it was logical. Jones would get 0/10 from this teacher I would expect.
00
Graeme No.3
It is usually not a good idea to snip away hard at a regular commenter. While one might disagree with what is said, there have been occasions when a bogger with an annoying style has produced a valuable comment, even several. You don’t cut off promising ideas because they disagree with your ideas. That is our big criticism of the “Team’s” way of acting.
That does not mean that you cannot assist an annoying blogger to moderate his/her approach by dishing up some equally annoying repartee. It toughens them up and matures them towards better outcomes.
Censorship has no place in scepticism or scientific advancement unless the examples become so blatant an offensive that any sensible, reasonable person would step in to caution.
JB will, in time, change his views because he had chosen to expose himself to counter views of some strength. That is better than a closed mind, any day.
00
True Geoff,
But there are several commentators who have recently started to fill up space again with junk.
Contentless comment.
All they do is distort the flow of discussion.
(Moderators are watching) CTS
00
Wise comment, but I wasn’t advocating that he shouldn’t be allowed to post comments, just that some people are reacting with “repartee” well disguised as vulgar abuse.
When you react that way you have lost the argument, and I was suggesting a more useful approach.
Would you care to give an estimate of the time it will take for JB to change his mind? I see no sign of progress in the last 6-8 months. So far any change calls to mind the speed of treacle flowing down flypaper.
00
I too have noticed how heated this thread has become.
Ah, the missing hotspot! Must be global warming. I’m off to get a government science grant. Nah, might go fishing instead and do some ‘pier’ reviews.
00
Please go easy on “John Brookes”..
It is obviously an early model $CAGW$ bot of some form.
Its 100% clueless answers..its maladroit avoidance of problems with $CAGW$ data retention/usage… its cherry picking answers and its casual disregard for good science is priceless.
That FACT that it has No comments on the shoddy science of the $CAGW$ proponents..yet seeks solace in the claims from authority meme time after time is hilarious.
Its answers are so robotic and the same..with no depth or data..that it is obviously not a human.!!
Why waste time with facts with a $CAGW$ bot..?
It doesnt understand.
If thats the best “arguments” they have preloaded in this model $CAGW$ bot..then let it keep posting its non answers..!!
My suggestions to the programmer is to fix the asinine “responses” and swap it with a sense of humour “response” sometimes..
Get Ian HARRY harris from CRU on to it.!
00
The Tin Man of Oz has said that he is not on the yellow brick road or the gravy train. Maybe as Rereke Whakaaro has said [8.1.2.1] – he is playing the court jester.
00
12 Jan: Ninemsn: France convicts five on carbon tax fraud
A French court has convicted five people of a massive fraud of the EU’s carbon trading system, sentencing them to up to five years in prison and ordering them to pay millions of euros in damages.
The chief organiser of the fraud, Fabrice Sakoun, was on Wednesday given five years while four accomplices were sentenced to between a year and four years…
The case was the first of many such trials expected in France after the discovery of a series of fraudulent carbon-trading schemes that cost the French state up to 1.8 billion euros…
http://news.ninemsn.com.au/article.aspx?id=8401692
00
It’s great to see these people put behind bars Pat, but will the people who were ripped off get their money back. I don’t think so it will all go to ‘ze state’.
00
Pat, if time permitted just now I would track down the names of those convicted as part of a work in progress to link networks of plunderers. If perchance you had the time and willingness to dig deeper, I’m at sherro1 at optusnet dot com.au
Same for all with an interest in locating the Mr Bigs behind the schemes.
00
How to assess evidence beyond your own expertise
http://vicskeptics.wordpress.com/2010/05/14/how-to-asses-evidence-beyond-your-own-expertise/
00
Ross,
I think we have already established a week or two back that you are operating well beyond your own level of expertise.
Haven’t bothered to look at your ref but if you can’t explain it in your own words then you just don’t understand it.
🙂
00
Kieth,
You well know I am a moderate supporting AGW based on science.
(When will the evidence for AGW show up?)
As first principal we should return both sides to a reasoning and reasonable argument.
(When will that happen?) CTS
Attacking ones character, intellect, political alliances, religious affiliations, race or culture to win an argument is a logical fallacy.
It is functioning from the emotions. I will take it as your sense of humour – for the time being.
Ad Hominem (Latin for “to the man” or “to the person”), short for argumentum ad hominem, is an attempt to negate the truth of a claim by pointing out a negative characteristic or belief of the person supporting it.
(Stuff it!) CTS
00
There is good value in being a member of the Australian Skeptics Inc., as I have been for 15 years or more. The link by Ross James is, IMHO, well worth the read. Some topics are best expressed by the first author, not through an interpreter/summariser on a blog.
00
Hi Geoff,
Obviously the link, as you describe it, is about method.
I read many of Ross’ posts recently and they are “devoid” of any reasonable scientific content.
Hence my comment on what I took to be, apparently correctly, another post on Global Warming that had NO scientific content.
🙂
00
[snip]
00
[snip, but thanks :-)]
00
Geoff I have had a recent experience with Climate Sceptics which I would not want to repeat
So …..
00
Admin note:
Hi all, please do give us feedback about the site via the email supportATjoannenova.com.au rather than via comments (that email address, when you forget it, is always on the bottom of the right hand column of the site above “statistics”).
Please be wary of adding too much discussion about the discussion (ie comments on commenters rather than on the topic). But if you have some insight into comment tactics or arguments, by all means that’s valid…
Threads get diluted if they focus too much on a commenter (as we found with Adam Smith).
Jo
00
The Bolta is back.
On IPCCs exaggerated climate sensitivity and the emperor’s new clothes
A link from his blog.
00
Re Joanne Nova Feb 12 #51
Thank you Jo, I was composing an email to you suggesting that this could be closed or brought back more on thread. There is some thread from my comment “Warwick should have asked ‘Are your data worth having’ before he asked if he could have some. ” I did not intend the discussion to go too far down the road of value of data. The post was more to acknowledge early researchers who dared to differ & some of the responses received. The prime driver was and is the quest for good science.
00
Geoff Sherrington @ 53
“The post was more to acknowledge early researchers who dared to differ & some of the responses received. The prime driver was and is the quest for good science.”
Good call Geoff. This one fits the bill! I was browsing John Daly today and came across this page: Climate Change: Guest Papers
“This website is pleased to make this space available to guest authors,
who are making valuable contributions to the Climate Change debate.”
Mark Duchamp, a conservationist (and by no means a sceptic) in Calpe, Spain posted this devastating article absolutely demolishing the argument for wind farms
“An Ill Wind – Wind Farms as a Blight on the Landscape” November 2002.
A must read and ideal to show any Green or other AGW believer pushing wind energy.
Tony from Oz: I think you’ll be very interested as he quotes some very relevant figures.
Scroll down to the above article at:
http://www.john-daly.com/guests.html
00
I would like to thank Geoff Sherrington, Warwick Hughes and Fred Woods and all the other prescient early skeptics for their pioneering work and for the courage to stick with what was for at least a decade more than just a thankless task, but one where being constantly abused, lied to and de-humanized as “denialists” was part of the daily experience. Lesser men would have just walked away. Instead, you blokes are walking straight into the pages of science history on the side of progress and honest curiosity. You deserve whatever future honours may be bestowed upon you. Cheers, mates.
P.S. I also like to thank Harry for his classic read me file. It’s probably the most hilariously entertaining of all the Climategate docs. No doubt Harry’s place in history is also secure.
00
Sorry. extra l on htm!
http://www.john-daly.com/guests.htm
00
Jo,
One of your best!
00
I know this isn’t the main point of this post, but this email statement of Jones always pisses me off:
(Nice interface, BTW!)
See, every time they say this, to outsiders it sounds like they are being reasonable, but Jones isn’t and neither is any other Team climate reconstructor. It revolves around the term “the data.” Jones knows full well that he didn’t use “the data” he is directing people to – he used an undisclosed subset of it. So there are two batches of data that can be called “the data.” There is ALL “the data” at the archive/source Jones points at. And then there is “the data” Jones used, which – as we can see from the emails – Jones et al continually cherry-picked, leaving out what was inconvenient to “the cause” or “the message.”
Such as Email 4022 (Jul 20 2005), in which Briffa talks about cherry-picking in two separate ways:
Blithely, they not only delete that empirically acquired data (as in real world) that isn’t “on message,” which is bad enough in and of itself, but then they replace that real data with whatever they feel like, because it fits within what they believe to be true, as well as being useful to their power position at the heart of the IPCC.
So, “the data” means whatever the Team wants it to mean, without informing the listener which is being referred to. It is like “HEY! “‘The data‘ (undifferentiated) is over there! Go to it! (and have fun trying to match what we did, you wanker!)” when they want to just blow off someone. And it is “the data” (our ‘Special Blend’) when they mean the (often non-recorded) overwritten subset, mixed in with what they chose to not delete.
(BTW, I used to work in R&D. The scientists there recorded EVERY factor in their Lab Books. Every day at work had a complete record of what they did and what they thought. Every parameter was recorded, assiduously. For them to find out what they did, all they had to do was track it down in their Lab Books. There was no such thing POSSIBLE as “The dog ate my homework,” or “We didn’t have the memory to store it, so that data isn’t around anymore.” There was no such thing as “How would I know what data I used?” If they pulled that ONCE, they’d be out on the street and word would get around about them.)
Grrrr! You want to grab the kumquats, and shake them, and tell them to some day start acting like actual scientists.
00
Thank you, Steve Garcia. I read this email 4022 and more when they first came out and was also gobsmacked. Unfortunately, it’s hard to track through the Climategate emails just what the outcome of this plan was – maybe next tranche will fill in the missing bits.
00
I laughed out loud at this
Steve M was an AUDITOR, for heavens sake. As in BULLDOG. As in Gila monster. And Jones thought Steve M was going to let go? 🙂
I am sure every mining stock scam artist thought that, too. ROFL
PHIL: Have you noticed how Steve M has just gone away?
00
Geoff Sherrington –
partial google translation from:
http://www.lesechos.fr/entreprises-secteurs/finance-marches/actu/0201836648150-marche-du-carbone-lourdes-peines-pour-les-fraudeurs-a-la-tva-273824.php
Five years in prison and a million euros fine. Fabrice Sakoun, textile wholesaler, was given a heavy sentence for tax evasion as part of a scam committed to VAT on the CO2 market. His property be confiscated and his account in Israel.
His accomplices, David Cohen and Haroun Illouz were also convicted to 4 years and 3 years in prison and fines of 1 million and 100,000 euros. The prosecutor had requested a maximum sentence of seven years in prison and $ 1 million…
Finally, BlueNext, the Stock Exchange of CO2 exchange on which the transactions took place, the CDC, its shareholder, and the broker Voltalia, were accepted as civil parties…
partial google translation from:
http://www.liberation.fr/depeches/01012382716-fraude-a-la-tva-sur-le-marche-carbone-la-justice-prononce-de-lourdes-peines
The four accomplices Fabrice Sakoun were also punished: Haroun Cohen, who has taken refuge in Israel, has been sentenced to four years in prison and one million euro fine, Elie Baloukas to 30 months imprisonment of which six month suspended sentence and a fine of 100,000 euros, David Illouz to three years in prison and 100,000 euro fine and Sid Foudil to one year in prison….
00
Geoff Sherrington –
how could i leave out the final line from Liberation?
(google translation) During the procedure, Fabrice Sakoun did not hesitate to state investigators that “CO2” was the “Lady Gaga in the business”, in other words a lucrative jackpot.
http://www.liberation.fr/depeches/01012382716-fraude-a-la-tva-sur-le-marche-carbone-la-justice-prononce-de-lourdes-peines
00
Pat, thank you, most appreciated. Maybe one day I will post about people behind the schemes. There is much material, but a big jigsaw to put in place. No doubt, some tracks are covered also.
00
The first thing that came to mind, looking at the picture illustration, was that we need to call in Indian Jones, a fictional character, to get into this Treasure site and retrieve the fictional data.
00
Geoff I noticed your comment in your recent post at Jo Novas that you’ve been a member of Climate Sceptics for 19 years or so
I’ve had a recent experience with Climate Sceptics which has put me off that party
So although I appreciate your expertise and I have no doubt that the Party recognises yours I don’t believe I could support that party in the future
00
Val #63, There are 2 different groups. I belong to the Australian Skeptics Inc and do business via a quarterly paper journal. I’ve searched the Net for a Climate Sceptics blog – one exists, but I can’t recall ever interacting. Thank you for your comments above. I suspect that this topic is near the end of its logical life for now and I shall be darting off to other topics in due course.
00
Has anyone here researched a bit into the Rockefeller’s eugenics program ? Basically the same program as the UN has in store for all of us, being the eradication of approx 75% of the worlds population ? They are using the environment as a weapon of fear and thereby control. It has been going on for many years and that is why the whole global warming hoax is so heavily pushed by authority figures. Makes for some scary research….
00