
The Daily Telegraph exposed the NSW state government protecting the world from some dangerous scientific analysis of sea-levels. The officials pulled papers and posters within days of when they were due to be released, late in September 2011. Doug Lord examined 120 years of tidal data from Sydney Harbour, and found a 1 mm year on year rise which didn’t fit with the 900 mm rise projected by the Wizards of Climate Change at the Department. He finds the official figures exaggerate ten fold.
Ken Stewart has taken the dangerous data from 19 sites around Australia and finds it averaged 1.4 mm/year over the last 100 years. He finds about an 8-fold exaggeration. This is another sordid tale in the Science-perverted-for-PR category.
Sea Level Change in Australia: What’s Likely?

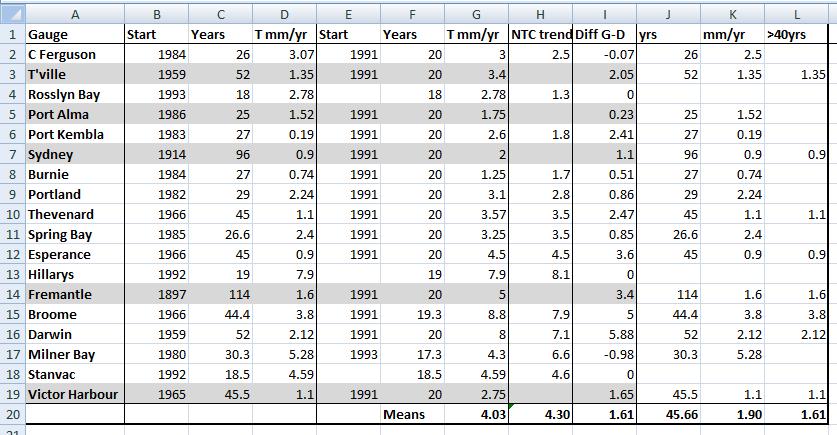
The mean sea-level rise recorded at 19 stations around Australia (warning, data is limited in the first half of the series). The trend is a steady rise. The last 20 years is not unusual.
Seas have been rising in a reasonably continuous trend around the world since 1800. The last two decades are not unusual.
The particular 19 sites are listed below (click to read). The longest continuous one is at Fremantle from 1897, then Sydney from 1914. The pre 1965 data is extremely sparse.
...
The last 20 years has seen a rapid rise but the steepest trendline around Australia was from 1938-1957 which was around 4.5mm/yr.
The west coast water is either rising faster or the land is sinking faster…. but on the East Coast, things are slow.

...
There’s a multidecadal cycle under that trendline
Playing with start dates shows the folly of making very much from 20 year trends. There is so much decadal variation that the start year affects the results greatly, which makes a mockery of bothering to put in that second decimal place. If we start in 1991 the trend is 3.8 mm/yr. But take that back to 1988 and we get 2.3 mm/yr, or 2.6 mm/year from 1987.
Ken points out their deceptive trick to help everyone feel the fear.
Officials talk of 3 mm a year being unusually fast: “ These rates of increase are an order of magnitude greater than the average rate of sea-level rise over the previous several thousand years. … but by averaging the long rise over seven thousand years, and pretending there are no other cycles, they can calculate an “average” which is meaningless. Sea level has risen and fallen and we are wandering in the dark, handcuffed and with blindfolds on, if we try to stab at say, the rate of sea level rise in twenty year periods from any period prior to 1900. Let’s pick the mean sea-level rise around Australia from 961 – 981. Was it faster? Who the heck knows?
Bottom Line:
20 year trends are dubious, but we don’t have enough data for certainty on seriously long frames that we need to avoid confounding things with the decadal cycles. Sea levels around Australia appear to be rising at about 2mm a year, and that’s nothing like the 12 mm required to get a 1 m or more rise by 2100. There is no acceleration. Things are not getting worse.
Nothing lines up with the theory that our emissions of CO2 are the main cause global warming, and our government officials are trying to keep that information from us.
See all the permutations and combinations of graphs on Australian sea level at Kens site.
Sea Level Change in Australia: What’s Likely?
PS: Thanks to the lady who rang in September to let me know about the papers being pulled. I’m sorry I didn’t have the resources to follow this story. I’m very glad the Tele did. It deserves to be told.
PPS: Has NOAA disappeared the four sites that Phil Watson used around Australia?
A comment came in from Fred Love to a different thread before this was posted. Can any one follow this up? Is this true? Were they included before?
Fred Love writes: No-one seems to have yet picked up that NOAA (Tides and Currents) has “disappeared” Fort Denison, Newcastle, Fremantle and Auckland following the publication of the Watson paper on Sea Levels. Australia is now “represented” only by Bundaberg and Townsville from mid 1960′s.
Related posts:
- Australian sea-levels respond to CO2 by slowing down…
- 10% of sea level rise is due to land rising too. Got that?
- Shock! Climate models can’t even predict a linear rise
- South Pacific sea levels – Best records show little or no rise?!
Image: Falcon Bay near Mandurah SW Western Australia. JoNova.
H/t To Fred in comments “fell the fear” typo fixed! jo


Instead of “….help everyone fell the fear.”, did you mean “…help everyone feel the fear.”?
——
Reply: I’d sack that proofreader if only I had one. Ta! Fixed. — Jo
20
All the decadal peaks line up with the 7th years except for the one I expected to see in 1917 which was several years early. What is the proposed mechanism behind this shift?
20
Also of note is that NOAA lists Bundaberg sea level change with a rise of 0.3 +/-0.5 mm/yr since 1966, and Townsville with 1.1 +/-0.5 mm/yr since 1959. This gives an average (ho ho) of 0.7 +/-0.5 mm/yr since CO2 emissions began to skyrocket. In other words, zero meters/century.
Using the Trenberth hypothesis that all climate trends are smudged with sooty human fingerprints, the inescapable conclusion is that the dead-certain-there anthropogenic impacts on sea level rise are not detectable.
20
Chris,
Is this a typo
How can a measured rise smaller than the margin of error be taken seriously?
10
The o.3mm is an average since 1966 (now 45 years). Over the same period the sea level in Bass Strait (Burnie & Point Lonsdale) has been going down at an average of 1.5mm/yr. The claims of accuracy of measurement vary. A paper by P Watson (Journal of Coastal Research Mar 2011) has +/- 0.1mm. The sea level suvey of BOM which I have downloaded does not give an accuracy of measurement but mentions timing and recording errors. Also, mentioned is vertical land movement which could have affected Port Pirie (0.07mm/yr rise) and maybe affecting Bass Strait (remember this was once exposed so aborgines could cross to Tasmania)
10
Thanks cementafriend, I missed this!
Ken
10
Ah well, when the Himalayan Glaciers are gone and there’s drought in SE Asia, i guess the sea level rise will pick up a bit huh??
http://www.theaustralian.com.au/news/breaking-news/scientists-say-himalayan-glacial-melting/story-fn3dxity-1226214585854
10
Ah, the Himalayan Glacier story…of the 54,000 glaciers in the Himalaya, the researchers only looked at 10! A very small sample and I wouldn’t mind betting that finding ten that are advancing would be fairly easy. Pretty duff article from the Australian!!
10
And Yet again, catamon displays h/her ignorance by spouting on about the disappearing himalayan glaciers.
It looks to me like you stopped learning from about 2006 there catamon.
A simple search on the web will show you that the whole section of AR4 on glaciers retreating was so completely undermined by grey literature (including the use of an article in a climbing magazine whihc resulted from a phone interview which was then exagerated by the author of the article).
Are some glaciers retreating? Of course they are – some are actually growing, which is pretty cool considering we’re in an interglacial period – will the himalayan glaciers disappear by 2030 or even 2100? – definitely not. Of course, this is based on the work of some local indian scientists who actually did science rather than just repeated activist lies and propoganda.
Hatrick – that’s three times you’ve been caught out perpetuating lies on this site catamon.
10
Wot, no REGIME CHANGE NOW!!
Are you mellowing MadJak?? Are you maintaining the rage!!! I’m missing my best bingo criteria if you cop out and will be doomed to ongoing sobriety!!
To sunsettommy @ 4.4. Sorry, i should realize by now that any attempt at anything even slightly tongue in cheek is lost on most of the posters here, and i’ll try and take myself as seriously as others in the future so you don’t get confused.
Interestingly enough this study is all about baseline data for future monitoring. Will be interesting to see how they refine their methods and whether or not they can come up with ways to do mass balance remotely? Be a remarkably difficult area to do field work i’d think, but good to see people bringing together the information.
11
Catamon,
You are falling flat on your face.
The link you posted with your B.S. make it clear that you are a liar.
You wrote:
There is nothing remotely “tongue in cheek” about it.Just your usual trolling B.S. And the usual avoidance to seriously discuss the topic.
You are trying to backpedal and you suck at it!
I wrote this below to point out why a few melting glaciers in the Himalaya’s are not going to make much of a difference to the sea level.And you are choosing to ignore it.Because you are too stupid to figure it out.So you are trying to minimize the damage I caused to your lousy attempt to beat up Jo’s blog post.
You wrote this:
It has already been exposed as a very weak study with some dishonest meddling with words and phrases.Reading in the link below.You will discover that the study is misleading.And used a very short time frame.The rate of melt will take at least 304 years to melt away for all but one of the 9 IPCC listed glaciers.
IPCC Brand Science™ – extrapolating 10 himalayan glaciers to speak for 54,000 – meanwhile Himalayagate 2 is evolving over the Stern Report
You are a few pounds short of being intelligent.
10
And you sir, are an abusive twat.
You call me a liar. Right, proof bucko me git little person. Or, are uou just talking out of your behind??
Exactly where have i posted something that you know, i know, to have been untrue??
If you cant prove that i have knowingly posted something which i believe to be untrue, then i’ll accept your abject apology as soon as you care to post it.
10
Catamon,
your reply justifies my stating that “You are a few pounds short of being intelligent.”
I have exposed and explained your lie.Too bad that you fail to see it.You come back blustering like the clueless kid.
It is obvious that you are going to continue to show the world as one of the idiot trolls.
Someday you might finally learn to drop all your mind numbing baloney and discuss the science instead.Where I pointed out how little glacial ice are in the mountains of the world.To point out how little contribution to sea level effects they have.You never addressed it at all.
10
Catamon…. So did you read the critiques on the Himalayan glacier debacle?….
How could you laugh when those who head the system you support, are found to be misleading, deceiving and exaggerating?…..Patchuri is a disgrace.
I think you only support an ideological cause, and not science…. You seem to have no interest in seeing the scientific method maintained, nor do you seem to support transparency and integrity in the interface between science and politics.
It’s a pity…I can see no further use in actually responding to your posts.
10
Another con to be taken seriously only by the gullible,the ignorant and the brain dead. For those with the ablity to do so check the sample size and the timing re Durban.
10
Catamon,
Do you realize that Mountain Glaciers amount to less than 1% of the worlds ice total?
Antarctica with 89.50% and Greenland 10% = 99+%
Maybe you should reconsider your position?
10
NEVER
We shall NEVER stop and think.
We shall NEVER admit defeat
We shall NEVER concede a point
We shall NEVER allow self doubt to creep in
We shall NEVER stop wanting to be taxed over the air we breathe
We shall NEVER question the bull shit we are fed
NEVER
Oh by the way anyone seen this
http://iceagenow.info/2011/12/satellite-sea-level-data-tilted-distort-figures-sea-level-expert/
From the worlds expert
NEVER NEVER NEVER shall i open this link what a bloody joke the warmbots are.
10
Crakar
Warmbots – If you can’t reason with them, then the next best thing is to laugh at them…
Cheers,
Speedy
10
Dog knows, i get a few laughs here!!
10
Thanks for that Joanne . The link to Ken is also very useful.
This stuff needs to get out far and wide. If there is no accelerated sea level change everything else in the AGW dogma is meaningless.
Well done.
10
Curious and probably ridiculous thought but I wonder how changes to the earth’s gravitational field and axis play out in terms of sea level changes within normal tidal cycles.
http://www.esri.com/news/arcuser/0610/nospin.html
10
How much more data like this does the team need to come out and say: we had it wrong? They will never do that of course. The politicians do it for them by not pushing through with “alternatives” and mumbling through yet another talkfest with no decision made, and there should not be. (decisions that is). The mainstream press look like idiots now with their bigoted reporting on this matter, but then journo’s are more often then not left leaning. It will be hard for them to just switch the story. It will take some time.
But there is good news for John Brookes and those like him, they can sleep easy again. Their feet won’t get wet yet. At least not because of AGW caused rising waters.
Of course scientifically this is not very sexy, measuring a bunch of tidal instruments. On top of that concluding that all is the same pretty much. Boring really. Same with thermometers, so we put them or keep them in places where we can show an increase due to man induced warming, next to heat vents etc. I guess in that sense the team is right, the reported warming at those stations is caused by mankind created warming.
Whilst it will be a long time coming yet before we know exactly what is driving the climate and what are causing the changes, and even if CO2 does have some impact on the temperature, it does not look like the current slight rise in temperature is causing anything catastrophic (let’s not forget that we just escaped from the next ice age in the 70’s).
At the moment we do better to observe and draw conclusions from that rather then to predict the future based in GIGO. Sadly for those who seek fame in climate world there are no sound bites in saying: “no change observed”.
10
Every Geologist knows that the big melt started about 18,000 years ago.
At that time the local Aborigines lived 19km offshore from the present Newcastle coastline.
The ocean was 119 metres lower then.
The big melt didn’t really get moving until about 15,000 years back but hwen it did there was a rush of about 102 metres over the next 8,000 years.
This is 13 mm per year!! Not 1 or 3 but thirteen or put another way 13 metres over 1,000 years.
There was a lot of ice to melt, in New York for example there was 1.5 km depth of ice and almost all of it is now liquified.
The last 6,000 years or so has been relatively level with some rises and some falls but mostly a gentle increase as the last of the available ice melts.
There was big drop of 1.5 metres about 5,000 years ago to roughly the present level.
It’s all over. CO2 is effectively irrelevant.
10
Gee whiz, it could be an interesting* time to get David Jones on Bolt & have a review of the “2010 CSIRO/BoM State of the Climate” paper.
( interesting in the traditional Chinese sense that is )
10
Anecdotaly, the local beaches, Bar beach and Susan Gilmore, have never had lower low tides than now.
More bedrocks are seen, the main marker rocks are not covered more at lows than previously.
Measuring the highs is not as easy.
Sixty years of rises has not been noticeable.
10
A question; given the massive change in tides from neap tides to king tides over 20 year periods, how does one measure sea level? As an example of this I know of one southern ocean location that floods the land every 20 years (it seems) which locals call the king tide. Anyone know how this works?
10
Hello incoherent rambler.
The comment @10 above probably has the corollary that if we are having lower low tides then we are probably having higher high tides, if we have the same ocean volume as is probably the case, give or take a little.
The orientation of the moon but especially its closeness to Earth is most likely the main determinant of tidal cycles.
It’s been a long time since I did orbital mechanics but would assume that the point of closest approach of the moon to the Earth’s surface moves slowly across the Earth with time.
There is probably a known pattern and periodicity to this. Maybe it has a 20 year cycle.
10
Also you’ll notice there is an annual peak in the first couple of months of each year. This is at the time of perihelion, when the earth is closest in orbit to the sun; on top of this, these months are also the peak of the north Australian Wet season, when the monsoon trough and tropical lows and sometimes cyclones swing much lower. As well, in some years these low pressures are accentuated due to La Nina when SOI (pressure difference between Tahiti and Darwin) is high. Low pressure means high tides are higher but low tides are higher as well so the MSL is up. Onshore winds and currents also cause higher tides, but SOI and MSL are very closely related- see my blog. If it was only the moon affecting tides mean sea level would be much easier to measure.
Ken
10
Thanks Ken
How could I have overlooked the sun.
10
Even your figures look too high for Broome, Frank, if there had been any rise since the 1950’s, it would have been very noticeable as the high tide springs would have covered all the streets in Chinatown instead of just the one closest to the mangroves, which it has done now for 50 or more years.
There has been no increase here, and I spent years working right on the highest tide mark. Only an occasional cyclone tidal surge raised the sea level above this.
This has links to photos and charts.
10
Even BOM couldn’t have been too concerned about rising sea levels, they have just built new offices and a radar tower less than 1 metre above the high tide mark next to the airport at Broome.
10
Tom Harley, I think you are right about the Broome figure. The BOM Survey gives in mm/yr rise over 40 yrs Darwin 1.54, Wyndham 2.06, Broome 2.23, Port Headland 0.79, and Geraldton 0.46. One can not look at short term data. Fremantle has continuous records for over 100yrs. The record shows a rise over 8mm in 5 yrs only to fall back 7 mm/yr in the next 4yrs. The variations at Wyndham and Broome in the 1970’s were greater than the largest changes in Fremantle. The Paper by Watson mentioned earlier shows an average rise over 60 yrs around Australia of about 1.5mm/yr and gives a clear indication that the rate of rise is declining (ie negative acceleration) by about 0.05mm/yr.
10
Tom, cementafriend, everyone:
What you are seeing is high tide levels, which is what concerns most people- who cares about MSL if high tide is several metres above that? And Broome’s highest high tides have not been increasing that much- 1999 had the March monthly mean 30mm above that of a couple of months in 1974 and 1975- but the trend is nearly +5mm per year. Interestingly, low tide levels are slightly decreasing, so the range is increasing. North Australian tides have a lot to do with atmospheric pressure. Also instrumental/ observation error may be involved especially in earlier years?
10
The average sea level at one place is probably calculated by averaging over a long time period. Any rise or fall in sea level will only show up over a long time. As KinkyKeith noted, there are some atypically low tides at his local beaches – but this doesn’t mean that sea-levels are falling. Similarly, as I’ve noted here before, the summer of 2009 – 2010 saw the Swan River in Perth regularly having really low tides, a feature that had vanished by the summer of 2010-2011.
Of course if you do it all over the world, you don’t have to average over a long time, because high tides in one place will be cancelled out by low tides elsewhere. You probably do have to allow for more water on land (i.e. in the QLD & Pakistan floods).
10
So as a continent Australia is surrounded by an ocean that is rising relative to land at 4.3 mm/yr. This is more than the global rate of either 3.4 or 2.1 or 0.7 mm/yr, whichever time frame you want to use. But if it is Hansen’s 3.4, there is still 0.9 mm/yr to be accounted for.
Is this land subsidence? Is there a gravity anomaly under Australia? Is it – horrors of horrors – inaccuracies within the data? Maybe it is windier all around Australia, and the seas are piling up.
If Australia is higher than the global average, somewhere there is an equally long coastline where the difference is on the other side, or 2.7 or -0.1 or -3.6 mm/yr. It all has to average out.
I know longer am sure what stupid numbers I am supposed to believe represents the sea level rise right now. I’m sure that is intentional: I can’t cross-check if they keep changing the grouping they are talking about.
This data shows, at the very least, that the error bar may be as big as the data. If Australia is, at a minimum, 21% higher than the global rate, then the global rate has got to be something like 3.4+/-1.0 mm/yr. Or 2.7+/-2.2 mm/yr or 0.7+/-3.6 mm/yr.
Help! Maybe the sea level is actually standing still but Australia is sinking due to the accumulation of lead-brained politicians now leading the charge against CO2 and the national economy?
10
Hi Doug
The recent furor surrounding Doug Lord’s Sydney harbour figures of about 1 mm per year, is important.
His work coincides with that of Nils Axel Morner.
The figure,unadorned with semi technical trivia, is 1mm per year.
Some warmers might say that Sydney Harbour is not the Pacific Ocean and they would be perfectly correct. That’s the sort of nit picking that confuses non scientists.
10
Last time I looked Kinky, Sydney harbour was filled with water from the Pacific … don’t know where the warmista think that it comes from. This is better though, land floods not the middle of the Pacific Ocean. 🙂
10
A quick look in the wayback machine seems to show that stations have been dropped.
10
Well done StraightShooter. I had a look at wayback some time back but I was too thick to get past the front door – I’m not asking for a qwik tutorial.
10
The data for Sydney and Newcastle has definitely been removed from the NOAA site.
While I can understand how different people may interpret data, the removal of raw data is ALWAYS unscientific.
10
I put Sydney in my blog- please check it- from 1885. NTC(BOM) only has data from 1914.
Ken
10
“The officials pulled papers and posters within days of when they were due to be released, late in September 2011”
Do we know exactly who pulled the papers from publication.?
Was it some remnant from the failed NSW Labor ex-government, or was it the current government.. (would be expected)
If it was the current government, WHY ???????? and a very big worry !
10
Hi Andy
You ask why?
It’s always the money.
Someone from the previous state NSW Govt had the “rights” to provide raw material for ethanol additive to local petrol.
Do we know how much ethanol (planet saving) replacement fuel we are legislated to use in NSW?
Keeping up the Global Warming (sea level) myth, justifies the continuation of legislated ethanol substitution in our fuel.
It was never about the environment.
It was always about the MONEY.
10
darn it! I meant to type (Would NOT be expected)
10
meanwhile…
4 Dec: From Sunday Star Times: Carbon credits pricing crashes and burns
Industry leaders call for limits on imports of low-quality European carbon credits, writes Rob Stock…
The price of New Zealand units (NZUs) has crashed from $22 in May to about $11 last week, stifling interest in developing carbon offsetting initiatives here, according to carbon market participants.
The price crash has been so steep that by one calculation, if the price trend continued for another 100 days, the value of NZU credits would be zero…
The reasons for the crash appear to be the unfettered ability of New Zealand emitters to import credits of dubious quality from overseas, coupled with the recent dumping of international credits by cash-strapped European industrial and utilities companies selling down their stockpiles of carbon to realise cash as the debt crisis worsens, participants in the fledgling carbon trading market say.
Big emitters here have been able to buy the UN-backed Certified Emmissions Reductions (CERs) cheaply to surrender under the ETS, gutting the price of NZUs.
As a result, those who have created NZUs – perhaps through planting timber on part of their farm – have almost abandoned the market…
As reported in the Sunday Star-Times two weeks ago, big emitters, including petrol retailers and power companies, are believed to have set their energy prices based on carbon at $25 a tonne. As a result of being able to buy it more cheaply they have had a windfall…
http://www.stuff.co.nz/business/6081834/Carbon-credits-pricing-crashes-and-burns
10
pat – was always going to be so.
A fixture of all the carbon ‘markets’ (finger-quotes, they are not a real market at all) is a floor price, which is because the government doesn’t want it to trade at it’s real price, ie zero.
Unfortunately for the meddlers-in-chief, they didn’t study their econ 101 before embarking on a trillion dollar boondoggle and forget to recall that setting a floor price on a market eventually leads to market collapse because of overproduction.
Floor price set = lots of places generating credits = excess supply = eventual price crash when excess supply dumping starts taking place.
In a market that requires the good faith of participants in order to stay afloat (unlike, say, food or energy that stays afloat because of need) – a price crash is enough to destroy the market altogether because no-one wants to be the patsy again next time.
Not even the market manipulation of supply/demand by the central planners can work against the market forces, in the same way that no monopoly or market cornering works forever.
Still, it’s surprising how quickly this has developed. Some say ‘thanks to the financial crisis’ but then I wonder how closely bound or separated the two things really are. The size of the carbon market and the misallocation of investment in windmills and solar does look about the same size as the ECB bailout figures getting thrown around.
10
this is what it is all about…
6 Dec: Australian: Graham Lloyd: Carbon links to EU, NZ forged
AUSTRALIA has formalised its negotiations with the EU and New Zealand to link carbon trading markets regardless of what happens in negotiations for a global climate change agreement in Durban this week…
Under the government’s package a fixed carbon price of $23 a tonne will be imposed from July 1 next year, rising at 2.5 per cent a year in real terms for three years. In 2015 the package will convert to an emissions trading scheme with a floating price.
A floor price of $15 and a ceiling price, $20 above the expected international price, will be imposed to prevent volatility.
After meeting EU Climate Change commissioner Conne Hedegaard yesterday, Mr Combet released the terms of reference for top-level talks next year on linking the two carbon markets.
“Expanding international carbon markets is good for the environment and good for economic growth,” Mr Combet said.
“It allows global emissions to be reduced in the most cost-effective and efficient way.”…
http://www.theaustralian.com.au/national-affairs/carbon-plan/n8-carbon-links-to-eu-nz-forged/story-fn99tjf2-1226214564691
10
But your prior article shows NZ credits being traded already at $11, below the Australian floor price.
I just love this:
It reads just like a line of dialogue from Atlas Shrugged. Call it the ‘prevent unfair prices’ regulation.
Anyone with even a passing understanding of markets knows that putting bounds on a price increases volatility. But with the expectation of the creation of derivative markets on top of the actual price, perhaps that was the intention all along.
10
Didn’t Al Gore insist there was Global Warming?
If so, wouldn’t sea-surface evaporation increase?
And sea levels fall.
If sea levels are rising, could it be that evaporation rates are falling, and by proxy, the temperature’s cooling?
Also, all these sea-based wind farms must have an effect. They’re reducing wind-velocity, which reduces evaporation, which increases sea level.
It seems mankind is torn between the devil & the deep blue sea.
10
It goes that water expands as it warms therefore sea levels should rise in a warming environment … we’re entering into a cooling trend so sea levels should start to drop at some time(what’s the delay period? )
10
An interesting point Streetcred.
If the Earth cools and there is thus less evaporation of the oceans at the equator then there will be less accumulation of ice at the poles and therefore less change in sea levels.
Whew.
The warmers conveniently overlook the “other” factors in most Global Warming theory and in this case they forget that increased temp brings with it increased deposition of water at poles.
A self limiting system?
10
Self regulating perhaps? That is what I think is the case anyway. When we see historical evidence showing CO2 increases (without any human contribution) lag temperature increases one could form the hypothesis that CO2 (in the context of the atmosphere) serves as a regulator, a temperature limiter perhaps?
The main point I think is that contrary to what some would have us accept as “fact” no one knows, we are just scratching the surface in regards to understanding all of the variables and their interactions. This would lead most to question how a trace gas making up such a small percentage of the gaseous blend of our atmosphere can be causing all these things they claim it is causing. I think it would also lead to asking why someone would refuse to question it.
10
I see that Joe Public has already dealt with this temp/ evap idea.
Joe the idea of wind farm friction is brilliant.
Should have been a comedian.
10
Dunno but Envisat has been dropping at 5mm/yr for the last 2 years.
10
Global warmers don’t like old guys. We (as an old Sydneyite) remember the coastline from surfing and fishing in the 50’s and 60’s (and the heatwaves and bushfires). Not much drowning of coastlines at all. And just go to the libraries and look at the coastline photos of places like Balmoral, Manly, Bondi, The Spit, etc in the late 19th and early 20th Century. But if anyone out there wants to swap their threatened coastal property in Sydney for my safe inland house please let me know. Come on Tim, what about it?
10
Ken has done great work
Here’s an article about sea levels looking from a historical perspective http://aoi.com.au/bcw/Sealevel/index.htm
The Rising Sealevel Myth —
Proofs that ocean levels are falling, not rising
(countering a new and expensive misconception about the Earth)
and John Daly in 2003 looking at Tasmanian Sea Levels has this report ‘The `Isle of the Dead’ Revisited’ – link to Part 2 also at this site
http://www.john-daly.com/deadisle/index.htm
I recall that recently there was news that a Port Macquarie developer is taking the Port Macquarie Council to Court for diminution of property value but I can’t find any updates to that news
10
Ken very well knows that the last few years has seen the phenomena if rotten tides which has affected sea level readings.
10
Odd. One of Ken’s conclusions is basically that the more recent the segment of data you look at, the greater the rate of rise?
“The longer the record, the lower the trend”
This is the very definition of acceleration, in this case.
However one cannot look at Australian data and make any definitive statement about global sea level. And one has to be extraordinarily careful when introducing consecutively later, potentially non-random, data into a time series analysis.
10
Yes, that is acceleration IF the short term trend continues indefinitely. The point I am trying to show is that there have been similar and greater sea level rises in the historical and prehistorical past- the recent trend is not unusual let alone unprecedented. NTC acknowledges this. The CSIRO and Climate Change Department’s predictions depend entirely on AR7. If the rate of MSL rise drops back, they will have to wait for the next cycle. Having said that, if we go into a phase of increased La Ninas, sea level will be enhanced for a while!
Ken
10
there’s also this table on page 28 http://www.bom.gov.au/ntc/IDO60101/IDO60101.201110.pdf
THE SOUTH PACIFIC SEA LEVEL & CLIMATE
MONITORING PROJECT
MONTHLY DATA REPORT
NO. 196
OCTOBER 2011
showing sea level trend THROUGH OCTOBER 2011 (mm/year)as being essentially flat since 1999
10
I picked this up at Warwick Hughes site
a report by Dr Vincent Grey in Sept 2009
http://nzclimatescience.net/images/PDFs/spsl3.pdf
10
I don’t want to scare you guys, but I was at the beach today. At one point, the sea level rose by 4.5 feet in only 5 and a half hours! I got scared and fled to higher ground.
10
OH FFS I’m sick and tired of the bullchit alarmism about a non-event like sea level rise.
How can IDIOTS (yeah I’m looking at YOU catamon you [snip]) believe any of this trrrripe?
From NOAA, here is the link to Freemantle
Under the chart it says..(read it carefully Catamon you moron)
WTF? 0.49 feet is barely 6 frigging inches. If I planked along the shore line at freemantle for a hundred years, and had a [snip, waaayy too much information] IN A HUNDRED YEARS.
At the other end of the continent, we have Sydney
The caption says….
WTF? that is not even 2.5 inches IN A HUNDRED YEARS.
If Catamon was plancking along the shoreline (with John Brookes and Gordon), they would ALL HAVE THEIR MEMBERS TOTALLY SUBMERGED before 2020.
Grow some cajones you moron and admit that this sea level rise scare scam is just that, a scam without any scientific basis whatsoever.
(Please calm down a little.Getting carried away with the name calling) CTS
10
Wow Baa1 Are you on a roll or what! (SNIPPED out the rest of the unpleasant comment) CTS
10
It’s a cumulative effect. Morons like catamon hurl insults post after post. I bide my time and return the favour all in one post.
Awwww look; the substantive parts of morons reply to me have been snipped by the mods.
I’m sure there was a response to the charts I linked to in that snipped section. Wasn’t there moron?
(It was a mocking attack on you.Your science comments were completely ignored) CTS
Give it another go, lets have your comments about the NOAA sea level data for Freo and Sydney. Quick, do it whilst the mods back is turned. Maybe you can sneak in a really intelligent comment.
10
Ok Baa, what insults where?? Or are you just being abusive, again.
On sea levels and their measurement’s, yup, some people have calculated they are rising, at different rates, in different parts of the world. Some people dispute that. There is contention in the science. Yippee. Does this invalidate all the other evidence lines for AGW? In my opinion no. However, i do not see the world through the window of a conspiracy theorist.
Sad the mods snipped your post though, it was indeed a classic of its genre.
10
But,but…..Penny Wong told us all in November 2009 that a 1.1 metre rise in tides was a “plausible figure” and 260,000 coastal homes were at risk.
Surely she couldn’t just have made this up?
10
No; she had somebody make it up for her.
“The Minister has it on good authority…”
“I have been advised …”
In other words: “I take no responsibility for anything I say”.
Just like the CSIRO and BoM disclaimers on their publications. Which the law-studied heavyweights of Parliament apparently disregard as inconsequential. After all it’s sound people in the job, providing the information. So what they say must be right; except the bit about not taking any responsibility for the use of the information and imploring potential users to independently verify.
10
The Daily Telegraph article states:-
a) What “continued global warming” exactly.
b) They cannot be alluding to thermosteric rise because solar insolation would be the cause (or have they discovered the sun?). That leaves the last great hope of the warmist – eustatic rise.
As NSW Environment Minister Robyn Parker asks, a “thorough explanation” would be helpful.
10
“But the agency insisted “historical trends of sea-level rise recorded by tide gauges do not necessarily provide a good indication of future sea levels because trends are expected to change with continued global warming”.”
The Office of Environment and Heritage, incredibly, must be stacked with even bigger dills than the Department of Climate Change is.
Perhaps the OEH forgot that the warmist spin is that rising sea levels are a proxy for global warming. However given the stupidity of the public face of climate change alarmism it is very likely they also wouldn’t notice that the alarmist cart has been placed in front of the horse by this statement from the OEH.
10
This is the “things are different now” excuse. Nothing in the past – including, if necessary, yesterday, needs be considered when you say that the future is not a continuation of the past.
Same thing goes with all science and events: when today is “special”, then new rules apply, rules you can make up at the moment an event arrives, as that is how you know there is a new trend in town.
All this not-now-as-before leads to Gore et al being “special”. They live in special times, do special things, and are specially trained and armed. To save the planet.
Superman and his friends used to be necessary when planet saving was to be done. Now it is just an over-sexed, chubby guy in an expensive suit. It is so oh-not-so-special.
10
Don’t you mean Supermandia, Doug ?
10
Lets not forget John Hunter’s little exercise in data exclusion in respect of the Isle of the Dead, in Tasmania. Some small portion of records from the year from which the mean sea level mark was made were lost. But as we know the mean for that year from the rock mark, it is easy to fill in those data gaps to get the same result.
However, the following years complete records (an El Nino year I think) made their way intact to the Royal Society and showed a mean sea level about 20cm lower than the rock mark. And it was this much lower MSL from a more limited data set that Hunter used (cherry picked) to manufacture a more pronounced long term trend.
There was never any excuse for this. If the mean of a partially lost data set is known then it is a very simple mathematical exercise to combine it with a complete data set to get a much more reliable sample. The fact that Hunter chose not to needs some very serious explaining.
10
Its really despicable that we have been lied to in this way. Because you want a picture of what really is happening with water. We want to know the mechanisms for accumulating more water, or losing that water into space. We want to know if there is any heretofore unknown way or ways that water can accumulate. These people are getting in the way entirely, and not just of climate science but of all science.
Actually I had thought that sea level ought to be considered the best indicator of warming. Since it took into account thermal expansion, and ice melting, all in one nice metric. Looking at the data, its hard to make head nor tail of it, or come up with some sort of working hypothesis of what may be going on. You waste time thinking about stuff like this only to find out that the data is not the least bit reliable. LIke the rest of the data. Surface temperature data. CO2 data. All of it currently next-to-useless. Only cutting off all funds and sacking everyone could hope to clear the air. This may be one of the few upsides of the up-coming financial collapse
10
Further to the NOAA. The Wayback machine has NOAA data for Sydney, Freemantle, Newcastle and Auckland to May 2011, and I linked to them directly on June 5 2011. Sometime after that NOAA removed all four sites from its Global Stations set, and Austalia is now represented only by Bundaberg (1966-2009, +0.25 mm/yr) and Townsville (1959-2009, +1.25 mm/yr). I have had no reply to a request for an explanation for this purging of data, which are the only four southern hemisphere tidal records continuous for more than 60 years.
10
the writer is a CAGW believer and executive director of the Sustainability Council and co-author with Geoff Bertram of The Carbon Challenge: New Zealand’s Emissions Trading Scheme, YET:
6 Dec: NZ Herald: Simon Terry: Carbon books reveal shocking gaps
An opening of the nation’s carbon books has finally been forced upon the Treasury and the results are truly shocking.
There are two shocks to absorb:
* How little has been disclosed when the stakes are so high, ecologically and financially.
* How far off the Government’s own emissions targets New Zealand is: tens of billions of dollars in payments overseas will be required to bridge the gap unless the Government gets serious about cutting emissions…
After various delays, Treasury delivered its projections the day before the election – late in the afternoon and with much of the key material blanked out.
What arrived is the carbon equivalent of a finance minister presenting a Budget and saying: “Here is the estimated tax take for the next 40 years and here is the total spending. But we are not going to tell you how much tax is coming from any sector and we are certainly not going to tell you how tens of billions of dollars of carbon subsidies and other payments are expected to be distributed.
“And no, we are not giving you the figures for the past four years of the ETS either.”
Future agricultural emissions are a state secret; future deforestation rates are a state secret; even projected fossil fuel emissions are a state secret – all blanked out…
So what does this largely obscured picture nonetheless tell us?
Treasury’s work compares projected emissions against the Government’s three policy commitments for cutting emissions by 2012, 2020 and 2050.
* 2012: Despite being 18 per cent over its Kyoto target, New Zealand is officially ahead of its UN obligations up to 2012 – but only because of the way it accounts for forest credits that are being “borrowed”. The financial books show a $997 million contingent liability as a result of this borrowing.
* 2020: After 2012, the nation’s carbon position is relentlessly negative for each of the next 38 years. Net emissions are above the current level in each year: rising not falling long term…
How credible those radically revised assumptions are is unclear as that is part of the suppressed detail.
* 2050: For 2050, the Government’s target is a 50 per cent drop in emissions but the projections are for a result 141 per cent over that. To keep to this comparatively weak policy commitment, New Zealanders would need to pay others to cut 1.119 billion tonnes of carbon. That is worth $28 billion at the low carbon price of $25/tonne assumed here – or $56 billion at the $50/tonne price used elsewhere by officials…
New Zealand has a wealth of low-cost options for cutting emissions but the ETS is tuned so that the incentive to cut back is very weak. As a result, most of today’s carbon bill will fall on future taxpayers.
One of the worst things about the lack of a decent set of carbon books is this ability to transfer vast amounts of ecological debt to our children without it even being registered…
http://www.nzherald.co.nz/opinion/news/article.cfm?c_id=466&objectid=10771132
10
The funny thing is, I’m not even remotely shocked by this.
The only thing that would shock me is if some- any- evidence were found that projected/predicted/nostradamus’d rates of sea level/rainfall/snowfall/ice extent/temperature/climate refugees/diseases/extinctions/sniffly noses matched what we have been told non stop for the last 20 or 30 years.
There isn’t one prediction that has come to pass. Not one. Even the co2 emissions have far outstripped the guessed-at values – on the upside. The carbon credits price is going in the opposite direction to what was expected. NOTHING has worked out like predicted by the doom-mongers, rent-seekers, grant-wanters and the power-hungry. Why does anyone still believe in this tripe?
And yet even semi-skeptical media like The Australian still cannot bring itself to publish these facts and self-evident truths without loading up on disclaimers, fudges, apologies and hat tips to the doomsayers.
The emperor hasn’t had any clothes on for at least a decade or more.
10
Hi brc. you say…
I honestly don’t think anybody really believes anymore. All of the man-made apocalypse theories whether it’s CAGW or catastrophic sea level rise or global cooling or global dimming or any of the other end-of-the-world scenarios; they’ve all been shown to be completetly bogus.
What we are involved in is a war. One one side you have the ‘believers’ who, as has been clearly demonstrated, have vested interests in keeping the show going. On the other side you have the skeptics who are fed up with being treated like sheep to be fleeced. And then in the middle you have the huge majority of the Earths population who are just trying to put food in their bellies and make it to the next day. They are the ‘mushrooms’ (kept in the dark and fed bullsh*t). If they are even in the fortunate position of being able to think beyond the next meal they probably have no idea how to change their situation or more likely are completly apathetic because they don’t see the way in which they are being manipulated!
Its all about power and control. The money is a way of keeping score.
In many ways you and I and others like us are extremely lucky.
Cheers.
NicG.
10
Hi NicG,
Extremely well put post. One of the best I have seen in putting it just as it is.
It is not so clear how much influence mesages on blogs really have, but in the end I think the Arab Spring shows that it is more than just a few characters stored on temporary web media.
I think that when this war is over, these blogs will take a large part of the history books on the subject, second only to the exposures of all the fraudsters and people in tow. It will make Watergate and Climategate look so trivial.
10
6 Dec: Reuters: UPDATE 2-Vattenfall drops carbon capture project in Germany
* Vattenfall blames lack of political will
* UK scrapped a leading CCS programme in October
Swedish utility Vattenfall on Monday abandoned plans for a 1.5 billion euro ($2 billion) carbon capture and storage (CCS) pilot project in Germany, due to popular opposition based on environmental fears…
“Vattenfall has emphasised that a clear legal framework is needed and that the existing draft for the CCS law is, without substantial improvement, insufficient for multi-billion investments in further development of this technology,” the company said…
http://www.reuters.com/article/2011/12/05/vattenfall-carbon-idUSL5E7N53PG20111205
10
I’ve shown this before but it’s worth repeating. SL at Sydney area was 1.5 metres higher 4,000 years ago.
http://www.abc.net.au/catalyst/stories/2278381.htm
See video at 1 min. 30 sec or read transcript. Rather buggers up the theory of recent warmer temps and higher SLs caused by humans.
10
Why Neville? I can’t see how you draw your conclusion.
The climate was probably warmer 4000 years ago, so sea levels were higher. How does that in any way preclude sea levels rising today because we are warming the planet?
Sea levels have been a lot lower and a lot higher in the past. What is your point?
10
His point is that long before anyone could claim “we are warming the planet” the same things happened both in levels of warming and increase of sea level. “It” has managed to happen without any “help” from us many times in the past. Now you want to claim “we” are causing it yet the historical evidence indicates that there is nothing unprecedented or exceptional about what is happening. “It” is a natural occurrence.
10
I wonder if a canny tribal elder imposed a fish tax on the basis that too much fishing was causing the sea level to rise? His family would have been fat with fish just from convincing the others with a bit of dreamtime storytelling that fish drink the water and keep the sea level down. (apologies to any indigenous folk if I’ve mangled the metaphor)
You can’t really be so daft as to understand that the sea level is going to do what it is going to do, and there is zero evidence that co2 emissions affects it at all.
I’ll lay it out, nice and plain.
correlation does not prove causation, but lack of correlation disproves causation.
co2 is growing fast, oceans are not. Thus, increased co2 do not cause oceans to rise. Clear enough for you? Care to provide some evidence that proves that increased co2 causes accelerating ocean rise?
10
Hello John
I have also mentioned the extra push that took sea levels an extra 1.5 m higher.
It was the last rush of the big melt from the last ice age.
Unfortunately for sea level catastrophists, John, all of the available ice has been melted.
This is why about 7,000 years ago the sea level effectively stabilised.
The extra 1.5 metre spurt was over and done in a flash, geologically speaking (about 1,000 years) but long enough to leave some nice flat rock platforms at the coast.
10
CSIRO, NTC, Climate Change dept, me- we all agree that Australian sea level has maintained roughly its current level while oscillating in a range of +/- 2 metres over the last 6000 years or so. There is ample evidence of seas being up to 2m higher along much of the Australian coastline- naturally it’s a bit harder to find evidence of being 2m lower, but it’s there. Temperature has fluctuated in this time and this was well before modern greenhouse gas emissions. Sea level rise and fall rates had to be at least as much as modern rates. (Try to imagine rising 2m, falling 4m, then rising 2m, or the other way around, just the once in 6000 years, without exceeding 1mm per year.)
So the point is: sea level rise will continue, but a rise of 10mm per year can only be maintained (and necessarily exceeded) for the next 89 years IF temperatures rise at a much greater rate than has been observed.
Ken
10
Hello John, I didn’t miss this one: “The climate was probably warmer 4000 years ago … “ We appreciate your acceptance that most recent little warm period was not warmer than in the past. 🙂
10
John B states “Sea levels have been a lot lower and a lot higher in the past. What is your point?”
So have temperatures!! – so what’s YOUR point?
As a “true believer” how can you leave yourself WIDE OPEN like that with such an innane statement?
Cheers,
10
Completely OT but………..you know what it is like when you are finaly vindicated after being told by one of the biggest losers you have ever met that you are wrong?
I will just supply the link with no further comment as the regulars here know exactly what i am talking about.
http://blogs.news.com.au/heraldsun/andrewbolt/index.php/heraldsun/comments/gunnedah_jumps_off_the_white_elephant/
Enjoy all you Smiff haters
10
This is kind related
http://wattsupwiththat.com/2011/12/05/new-hurricane-record-2232-days-and-counting-since-major-hurricane-made-landfall-on-the-usa-last-record-was-year-1900/
Another major blow to the IPCC crystal ballers. Have they got any scary booga booga stories left in thier little bag of tricks?
10
I guess that when the Himalayan glaciers have all melted thanks to Australias export of clean coal and loads of cash to ‘dirty’ Asia that you guys can un-mothball those de-salination plants and send mega-bottles of re-hydrating liquids (when the wind is in the right direction of course and the EU has redefined hydrating substances to include H2O) to the thirsty but much richer inhabitants of the future first (thirst?) world.
It’ll certainly help your trade deficit when importing all those choice Indian and Chinese goods such as lamb,beef and tin-openers! Your tourist industry will also get a boost too as long as you remember to ask respectfully when asking “Do you want fries with that?”
FGS diggers get off your fat ass*s and fight for your futures!
10
Re: NOAA plots- I’ve included the plot for Sydney in my blog – also some other interesting plots and info.
Ken
10
Yes Ken but Fort Denison data is no longer posted by the NOAA. It was taken off some time after June 5.
10
Hi Ken. RE the plot for Fremantle on your blog.
On 11/6/2003 John Daly had an article ‘Sea level at Hobart, Tasmania’ ‘A Failure to Authenticate’ in which, after detailing his diligent and exhaustive research of records, he pointed out the flaws in the relevant Hunter paper.
As part of that post, he noted the following:
“According to Australia’s National Tidal Facility, Fort Denison is only one of three tide gauges around the Australian coast to have more than 60 years of historic sea level data. The other two are Port Pirie in South Australia and Fremantle in Western Australia. Fremantle is the oldest (90 years), but because recent satellite measurements have shown Perth (near Fremantle) to be subsiding steadily, its 90-year tide gauge record cannot be used in sea level studies because the land subsidence creates an artificial sea level `rise’. Other tide gauges on the same coast as Fremantle show an average sea level fall over the last 30 years, further invalidating the Fremantle record.”
Were you aware of this subsidence and if so, do you know if there have been any adjustments made on the plots you show?
http://www.john-daly.com/deadisle/hobart-msl.htm
Keep up the good work.
10
A week is a long time to be away!
I wasn’t aware of specific subsidence problems at Fremantle (although land fall/ rise is a common problem and such an apparently rapid rise does raise questions)and I am not aware of corrections to the data.
I am not aware of any land movement, subsidence, or dredging that may ahve affected Fort Denison either.
And how about that, I missed Port Pirie somehow, there’s some more longer term data. I may do an update. Thanks!
Ken
10
George Monbiot seems disappointed about the sea level debate and takes to slandering instead…
10
Bottom Line:
Nothing to see here move along
10
reminder:
6 Oct: Gold Coast Bulletin: Matthew Killoran: Coast council wants scientist quiet
Cr Ted Shepherd lashed out at Professor Rodger Tomlinson, head of Griffith University’s Centre for Coastal Management, over comments about rising sea levels and the possible impact on the Coast.
The council gives $500,000 a year to the centre…
Cr Shepherd’s funding threat to Prof Tomlinson came with a demand he be brought before the council to explain his `alarmist’ comments.
Despite the threats by Cr Shepherd, the council’s engineering committee decided to continue funding the centre.
Cr Shepherd, however, questioned why the funding should go ahead when Prof Tomlinson `continually spoke against council policy’.
Queensland Council for Civil Liberties president Michael Cope said it would be undemocratic to cut funding because of comments made by an individual…
http://www.goldcoast.com.au/article/2011/10/06/354985_gold-coast-news.html
as u can see, Cr Shepherd got nowhere with this, and the Bulletin thought it should get a quote from Cope to back the Prof.
10
no wonder rates are going up:
24 Nov: Lakes Mail: David Quick: Council defends sea rise policy
LAKE Macquarie Council has cited the results of six community workshops it organised on flooding as defence of its planning policies relating to a forecast rise in sea levels.
But not everybody is convinced…
“Other data collected at the workshops showed that most agreed it is important to plan for future flood and inundation risks, but that it was important to periodically update our management measures as new information about future risks becomes available,” she (Council’s sustainability manager Alice Howe) said…
But local developer Jeff McCloy is reportedly organising a class action of waterfront home owners.
He claims council flood risk policies – which saw LMCC planners recently recommend refusal of a planning application because the property may be inundated by the end of the century – have devalued waterfront properties and will continue to do so…
http://www.lakesmail.com.au/news/local/news/environment/council-defends-sea-rise-policy/2369172.aspx
10
meanwhile, over in NZ, where almost everyone lives on the Coast:
2 Dec: Otago Daily Times NZ: Chris Morris: Latest flood warnings ‘ridiculous’
The Dunedin City Council’s decision to add flood warnings based on computer modelling to Dunedin homes’ land information memorandums (LIMs) has been criticised as “ridiculous” by the Real Estate Institute of New Zealand…
Council operations general manager Tony Avery confirmed at Tuesday’s infrastructure services committee meeting the warnings, based on computer-modelling of climate change, sea-level rise and floods, would be added to the LIMs of homes in areas shown by the modelling to be at risk, if predicted problems were left unchecked.
The warnings would note the maps generated by the modelling were not accurate enough to show the potential risk to individual homes…
Mr Avery this week reiterated the council had a legal obligation to disclose the results to avoid the threat of legal action…
Maps showing at-risk areas would also be made public at the same time warnings were added to LIMs, which was expected to be within “the next day or two”, he said.
It was possible most homes would receive one of the warnings, by being in an area affected by one or other of the 14 scenarios modelled, he said.
However, the council was trying to be careful about the exact wording to avoid any “fear and angst”, he said…
http://www.odt.co.nz/news/dunedin/189048/latest-flood-warnings-ridiculous
10
This is off topic but i need to vent.
We asked for a 3 year pay deal which the government rejected, now they have come back with a counter offer of 4.5, 2, 2.5% (still 3% per year which we had already rejected) and the unions walked out in disgust.
Meanwhile in other news Juliar cant decide on where to spend her extra 90K!!!!!!!!!!!!!
Can we get rid of all pollies this time and start again?
10
“Can we get rid of all pollies and start again.”
Only if the pollies are willing to be public servants.
Only if the pollies masters exercise power of recall.
Only if it is forbidden for pollies to borrow ‘money’ using the countries inhabitants and assets as surety.
Only if the current Statute/Merchant/Admiralty/Roman civil law is abolished and replaced by Anglo-Saxon Common Law.
10
meanwhile, the Met Office makes an exception for Durban:
6 Dec: UK Daily Mail: Severe water shortages, hotter days and more floods: What the weather has in store for us in 2100 (but at least we might get bumper crops)
Millions of lives could be ‘changed forever’, MP warns
By Tamara Cohen
Despite recently dropping seasonal forecasts because they kept getting them wrong, the Met Office yesterday laid out its predictions for Britain’s weather in the year 2100…
***In the most extreme scenario, 160,000 more people could be at risk of coastal flooding particularly in popular tourist areas of the south coast, the report says.
The ‘Climate observations, projections and impacts’ report, published yesterday at the UN climate conference in Durban is the first time Britain’s weather has been mapped out for this long.
‘It comes just a year after the Met Office ditched its 90-day forecasts for the public after a predicted barbeque summer turned out to be a washout…
http://www.dailymail.co.uk/news/article-2070437/Severe-water-shortages-hotter-days-floods-What-weather-store-2100-bumper-crops.html
10
What happened to JB’s post where he called me a nut case did i miss it?
Maybe it was magicked away, never mind i have been called worse and would rather be a nut case than an indoctrinator.
OOOOOOOOOOOOOOOOoh bad bad man
Good green shiny things
10
It’s over here: Link to comment
10
as per usual, making it up as they go along…
5 Dec: Bloomberg: Matthew Carr: EU Nations May Seek Funds From Carbon ‘Cash Cow,’ Goldman Says
“The EU emissions trading system could offer another opportunity for governments across Europe to raise funds, and at the same time bolster their own green credentials,” Fred Barasi, an analyst in London, said yesterday in an e-mailed research note. The nations, struggling financially, may regard the carbon market as a “cash cow” after raising taxes from utilities for climate protection the past 18 months, he said.
Carbon permits for December have plunged 48 percent this year and fell 4.4 percent today to 7.47 euros ($10.04) a metric ton on the ICE Futures Europe exchange in London as of 1:37 p.m…
EU carbon permits may rebound to 15 euros a metric ton by 2013, Barasi said. That’s 40 percent less than an earlier forecast, he said.
The U.K. has set a precedent for intervening in the market when it announced a price floor in March, Goldman Sachs said. “The level at which the U.K. carbon price floor will start, 16 pounds ($25) a ton in 2013, is currently more than double the forward-market price of 7.50 pounds.”
The U.K. Treasury estimates it will raise 740 million pounds from the power sector in 2013 through the measure, rising to 1.41 billion pounds by 2015, the bank said.
On Dec. 2, the European Commission, the Brussels-based regulator of the EU market, delivered 300 million tons of phase three allowances to the European Investment Bank, which need to be sold by Oct. 2. The third phase of the greenhouse-gas program starts in 2013 and runs through 2020.
EU governments might agree to temporarily “set aside” some allowances to boost prices and create a shortage around 2014, earlier than expected, Barasi said. Current rules would create a shortage around 2017, he said. The bloc may alternatively tighten its 2020 emissions target or introduce a carbon floor price to boost prices, he said…
http://www.bloomberg.com/news/2011-12-05/eu-nations-may-seek-funds-from-carbon-cash-cow-goldman-says.html
10
[…] Australian sea level rises exaggerated by 8 fold (or maybe ten) – The Daily Telegraph exposed the NSW state government protecting the world from some dangerous scientific analysis of sea-levels. The officials pulled papers and posters within days of when they were due to be released, late in September 2011. Doug Lord examined 120 years of tidal data from Sydney Harbour, and found a 1 mm year on year rise which didn’t fit with the 900 mm rise projected by the Wizards of Climate Change at the Department. He finds the official figures exaggerate ten fold. […]
10
about the writer: Khadija Sharife is a journalist; visiting scholar at the Center for Civil Society (CCS) based in South Africa and contributor to the Tax Justice Network. She is the Southern Africa correspondent for The Africa Report magazine, assistant editor of the Harvard “World Poverty and Human Rights” journal and author of Tax Us If You Can (Africa). Her work has appeared in African Business, Forbes, The Economist, Foreign Policy, BBC, London Review of Books, African Banker, among others.
5 Dec: The Africa Report: Khadija Sharife: Climate Change: Buying and selling pollution, who gains?
The process of financialising ecosystems assets ie: turning nature into tradeable capital, was formulated by the same actors involved in the derivatives markets. The founder of the Chicago Climate Exchange – Richard Sandor, also founded the derivatives and futures markets, and the primary financial corporations involved in tangibly developing the market – Goldman Sachs, Morgan Stanley, Barclays, BNP Paribas, etc. “I guess in many ways it’s akin to subprime. You keep layering on crap until you say, “We can’t do this anymore,” said Stuart.
As this Barclays Bank page boasted (the page has now been removed): “Unrivalled primary origination team: One of our team is a member of the Methodology Panel to the UNFCCC CDM Executive Board.”…
The Kyoto Protocol, intensively lobbied by the US, as a ‘climate change’ text which contained flexibility mechanisms enabling the industrialised nations to elide emissions, further evidenced the main promoters as revolving door actors with vested interests: though the US did not ratify the Protocol, Al Gore – the main lobbyist, was a key element in Sandor’s CCX. Gore founded, along with David Blood (former CEO of Goldman Sachs Asset Management) an entity called Generation Investment Management that would quickly acquire almost 10 percent of the world’s largest carbon credit portfolios – using similar financial regulatory management models.
The current head of the UNFCCC – Christina Figueras, until her appointment in 2010, was a vice-chair of the Carbon Rating Agency (CRA) and senior advisor to C-Quest Capital, a leading carbon trading firm founded by Ken Newcombe. Newcombe is arguably one of the top ten architects of the carbon market.
According to his biography: Newcombe has “over 30 years of experience in developing financially viable sustainable energy and forestry projects around the world for entities including Goldman Sachs, Climate Change Capital and the Carbon Finance Unit of the World Bank Group.
At the World Bank, he started the first public-private partnership Carbon Fund, which went on to pioneer the global carbon market. He also managed the growth of the World Bank’s carbon finance business to a total of eight carbon funds and a billion dollars under management…. ”
Meanwhile, the founder of CRA, Lord Stern, a former World Bank economist and climate change advisor to Tony Blair’s government, who advocated that ‘decarbonisation’ should be a market activity, is head of Ideacarbon, a firm providing financial and other advice to ‘buyers, sellers and hedgers’.
Yet, with no automatic information exchange, corporate country-by-country reporting (CbC), or mandatory sanctions against the normalized viral use of secrecy jurisdictions as the central base for entities (ranging from multiple subsidiary units by hedge funds, development finance institutions, accounting firms, to banks and other financial entities) regulating the notoriously opaque market is a dangerous illusion.
As with other CDM initiatives, REDD is touted as a ‘market solution to market pollution’ – a principle proposed by CCX at the very founding of the nascent UNFCCC – the Rio Earth Summit. It is also a principle that developing nations are forced to bank the future on.
In the process, just as natural resource exploitation enabled corrupt leaderships at the helm of rent-seeking African regimes, to benefit from unearned revenue, so too does financialising pollution locate value in permits that now represent another form of rent.
The question must be asked then: why are the solutions proposed to halt and reverse climate change, placed firmly in the hands of financiers and key state polluters, who consistently elide investigation of the macroeconomic system at the root cause of both the economic and environmental crisis?…
But this closing out of real solutions should come as no surprise: Lex de Jonge, current head of the CDM executive board described the CDM system, “at its best, is a zero sum game, because its credits are used to offset reduction obligations of Annex 1 countries.”
And in this zero sum game, there may be much activity at the COP17 – like those that have passed before. But COP seems bound to succeed mainly for the global banksters eager to maintain the status quo: profit from pollution, whatever the consequence.
http://www.theafricareport.com/index.php/2011120550176882/columns/climate-change-buying-and-selling-pollution-who-gains-50176882.html
10
Hasn’t anyone realised sea level rise is caused by an increase in shipping. Archimedes or any child would know if you drop an ice cube into a full glass of water, yes it floats, but the water in the glass will overflow. The same is happening on a larger scale in the world’s oceans.
The increase in shipping during 20th century correlates well with the increase in global sea level during the same period. Not only are more ships on the seas than 100 years ago there are also more resting on the bottom as well. The higher rates seen in the 20 years after 1938 is probably related to the increase in shipping convoys of the Second World War and the prohibitive expense of air travel during the 1950s.
The slight flattening off in the last the last five years is almost certainly due to the cutting up and recycling ship’s steel rather than sending them to the bottom when they reach the end of their service life. The dredging of harbours may also play a role in the slight decline in recent years.
The map of the Australia showing sea rise since 1990 is also explained by shipping. The higher rises on the west coast of around 8mm are due to supertankers laden with heavy ironore sitting lower in the water, while on the east coast the main export is coal which of course being mainly carbon is much lighter, therefore the ships displace less water.
The above hypothesis is based on long established scientific principles just as co2 has been long known as a greenhouse gas:)
10
ROFLMAO!
10
Well as thers no warming, whats the rise if any due to? Got any bright ideas..millimeter rises are probably just noise fluctuations. Do your math!
10
According to this BBC doco [which seems to say that global cooling is causing global warming]evaporation should have lowered sea levels.
http://www.informationclearinghouse.info/article15809.htm
“Global Dimming”
10
OMG Kevin for Gods sake dont give the alarmists another word for it!!
10
Thanks for admitting JB that there is nothing unprecedented or unusual about the slight modern warming.
Whatever causes CC I agree that the climate changes all the time, but that’s my point.
Here’s an unusual extreme warming for you , how about 10c over just 10 years and it definitely wasn’t caused by humans.
http://www.ncdc.noaa.gov/paleo/abrupt/data4.html
10
Putting Sea Level changes into a proper perspective is difficult. Here’s a Global Mean Sea Level Change Map from one of the WUWT reference pages; 1993 to Present.
It basically shows that the Oceans aren’t filling up like a bathtub. The Sea Level changes are regional and appear to have more to do with ENSO cycles and related regional temperature anomalies. Global Mean Sea Level Change has actually been negative off the west coasts of North and South America during the period of time.
Global Mean Sea Level Change Map with a “Correction” of 0.3 mm/year added May, 5th 2011, due to a “Glacial Isostatic Adjustment (GIA)” – 1993 to Present
http://sealevel.colorado.edu/files/current/sl.jpg
10
‘Brinicle’ ice finger of death filmed in Antarctic -BBC
http://www.bbc.co.uk/nature/15835017
10
Best post you’ve ever done, thank you.
I’ve heard of these before; for someone to go to the effort to hunt down an active event and then predict its path and set up their cameras is quite incredible.
10
I’ve figured out how warmists see rising sea levels everywhere they look!
10
Another article in the MSM about this issue by Miranda Devine.
http://www.heraldsun.com.au/opinion/drowning-in-a-tide-of-fear/story-e6frfhqf-1226216622028
P.S. Just thought I’d put out a quick thanks to the Editor on here who has helped my problem with linking. 🙂
10
Ian Mott: I’ve only just come across your post on the Isle of the Dead. I’m afraid what you say makes no sense at all to me. Perhaps you can explain in detail what you object to in our two papers, and possibly even submit your own paper on the data (which is publicly available).
You may be interested to know that more recent research, using completely different techniques (cores from local salt marshes) suggests that far from overestimating the rate of sea-level rise in Tasmania, we may well have underestimated it.
10
It is a few years since I looked at this issue, Mr Hunter, so my recollection may not be entirely clear. I am up to my gills in finalising tax returns today but will give an informed response early next week. However, my conclusion at the time was that the reasons for excluding the incomplete records that produced the Isle of the Dead rock mark of MSL were tenuous. Simple forensic accounting techniques for filling in the gaps in incomplete records would have enabled the compilation of a larger and more representative sample. And that more representative sample would have produced a higher MSL than the shorter sample you relied upon. Given the well documented instances of other climate insiders manipulating data to maximise the extent of trends, I look forward to a detailed discussion on your methodology.
10
For Ian Mott:
So – standard contrarian tactics – make outrageous claims on the web when your “recollection may not be entirely clear” and then patch them up afterwards.
This is really old stuff you know, and has been gone over many times by contrarians on the web. You don’t make any more sense than they did.
I note that you “look forward to a detailed discussion on your methodology” – it’s all in the two papers, and the original data is publicly available on the web. I look forward to you publication in due course.
Just please don’t make disparaging claims on the web for which you can provide no evidence.
10
John Hunter; I would have thought my post @58 above was quite clear, even for a climate cadre. I will get to the detail of this matter in due course as advised but you are being rather presumptuous in your belief that it will be me who is doing the “patching up” afterwards.
In the mean time, can you confirm that the data set you chose to inform your estimate of MSL in this instance was for the year after the one that produced the rock markings at the Isle of the Dead?
Would you care to repeat for us what your rationale was for being selective with data that could have been incorporated into a larger, more representative sample? I seem to recall that your paper was a little vague on this point.
Do you accept that an officer in the British Navy at that time would have been more than capable of calculating a mean sea level figure from the data at hand and would also be very mindful of the utmost need for accuracy?
And do you accept that even in the event of a subsequent loss of some of the data that formed that calculation of mean, the very existence of that mean figure and the known duration of the data interval would have made the combining of both data sets a comparatively simple task for all but the most innumerate?
Do you know understand that many reasonable observers, in the absence of additional information that you may or may not care to provide, may be inclined to form the impression that a shorter data set that indicated a greater rise in mean sea level since that time was chosen over a larger, and therefore more representative, set that indicated a lesser trend?
And please note that at this stage I am not drawing any conclusions, merely asking pertinent questions regarding your work.
10
Ian Mott:
> can you confirm that the data set you chose to inform your
> estimate of MSL in this instance was for the year after the
> one that produced the rock markings at the Isle of the Dead?
No – I don’t know where you got this idea from. Our estimate of MSL is for 1841 and 1842 and the benchmark was struck on 1/7/1841. There was some additional data for 1839 and 1840 but this includes a datum shift in December 1840, rendering all earlier data of no use to us. This is all clearly stated in our published papers (see staff.acecrc.org.au/~johunter/ihr_paper.pdf and staff.acecrc.org.au/~johunter/as_published.pdf) – please read them.
> Would you care to repeat for us what your rationale was for
> being selective with data that could have been incorporated
> into a larger, more representative sample? I seem to recall
> that your paper was a little vague on this point.
See above – we were not at all vague on this point.
> Do you accept that an officer in the British Navy at that time
> would have been more than capable of calculating a mean sea
> level figure from the data at hand and would also be very
> mindful of the utmost need for accuracy?
Yes
> And do you accept that even in the event of a subsequent loss
> of some of the data that formed that calculation of mean, the
> very existence of that mean figure and the known duration of
> the data interval would have made the combining of both data
> sets a comparatively simple task for all but the most
> innumerate?
I really don’t know what you think you are getting at here – presumably some conspiracy theory. We were quite clear in our papers about what data exists and why we used a subset of it (see above),
> Do you know understand that many reasonable observers, in the
> absence of additional information that you may or may not care
> to provide, may be inclined to form the impression that a
> shorter data set that indicated a greater rise in mean sea
> level since that time was chosen over a larger, and therefore
> more representative, set that indicated a lesser trend?
I think you are suggesting that we somehow cheated in order to get an higher estimated rate of rise. We didn’t. We have said what we did. We have made the data publicly available.
Now, Ian, I wasted far too much time arguing these points with people like John Daly many years ago. I’m not going to start again. You have my answers – now go and do your own analyses if you want to but don’t waste any more of my time.
And don’t make unsubstantiated and incorrect claims about our work on the web.
10
As I have already said, at this stage I am working from memory only and will look at the detail early in the week. I regret to note that your “wasted far too much time arguing” line has also been used by proven data manipulators and cherry pickers like Mann, Jones, Hansen, et al. I do hope this is mere coincidence. And frankly, if the late John Daly had serious issues with your methodology then we all need to take a good close look at your work.
10
Ian Mott: You obviously think that making serious accusations of data manipulation and fraud “from memory” is an honourable way to proceed. I don’t. You similarly make the completely unsupported claim that Mann, Jones and Hansen are “proven data manipulators and cherry pickers” – this may be your opinion but it does not match the findings of numerous professional investigations, or the wider climate science community.
John Daly had serious issues with many people’s methodology – he was mostly wrong. However, he is dead, his website is dead (no one could be bothered to take it on although there were grandiose plans just after he died), and the issues of sea level at Port Arthur are on old ground that has been travelled much. Move on Ian.
10
I am sorry to note that Mr Hunter appears to have developed a habit of extrapolating from limited data. I have gone back over my posts above, and hiss, and the only “accusations of data manipulation and fraud” I can find are ones from Mr Hunter suggesting that this is what I have claimed of him. Many readers will recognise this as a classic “straw man” argument, attributing actions and values to me the he regards as dishonourable.
As I have already said, I will get the time to closely examine Mr Hunter’s explanation as to why he excluded part of a data set early in the week and share my conclusions with this forum. It is one thing to provide an explanation in a paper as to why something was done or not done but the public also has a right to form their own opinions on whether that explanation is valid.
10
Ian Mott,
If you want my unsolicited advice I would not waste one second of time with John Hunter. A better investment in time would be to read through these 622 comments at Climate Audit and you can see first hand that John Hunter graduated with honours from the Michael Mann school of obfuscation. To give you just one example of his hypocrisy and childish behaviour there’s this comment from Steve McIntyre
10
IPCC’s exaggerations 2007 –
http://www.guardian.co.uk/environment/2007/feb/02/climatechange.climatechange
10
Kevin Moore:
I’m not sure of the point of your link, but the first thing I saw when I went to it was:
“The research shows that between 1993 and 2006, sea levels rose by 3.3mm a year on average, while the 2001 IPCC report had predicted an annual rise of less than 2mm.”
This is just as true now as it was in 2007. The IPCC projections of sea-level for the present time appear to be UNDERESTIMATES rather than overestimates.
10
Ian Mott – some quotes from you:
6 Dec:
“And it was this much lower MSL from a more limited data set that Hunter used (cherry picked) to manufacture a more pronounced long term trend. ….. There was never any excuse for this. ….. If the mean of a partially lost data set is known then it is a very simple mathematical exercise to combine it with a complete data set to get a much more reliable sample. The fact that Hunter chose not to needs some very serious explaining.”
9 Dec.:
“Given the well documented instances of other climate insiders manipulating data to maximise the extent of trends, I look forward to a detailed discussion on your methodology.”
“Do you know understand that many reasonable observers, in the absence of additional information that you may or may not care to provide, may be inclined to form the impression that a shorter data set that indicated a greater rise in mean sea level since that time was chosen over a larger, and therefore more representative, set that indicated a lesser trend?”
10 Dec.:
“….. John Daly had serious issues with your methodology …..”
(John Daly also frequently accused me of “data manipulation and fraud”.)
Just the phrase “….. that Hunter used (cherry picked) to manufacture a more pronounced long term trend” to me constitutes an “accusation of data manipulation and fraud” – does it not to you?
Or perhaps you just have different ethics to me.
10
Athlete: Thank you for your contribution. I was thinking of directing Ian to the climateaudit “discussions” to save him the time of going over well trampled ground.
There is one significant difference between Ian’s conduct and mine. Ian’s original comment (6 Dec) came completely out of the blue. I have showed that this comment was quite untrue, and Ian admits that they were “from memory”. The implication from the start (“lets not forget John Hunter’s little exercise in data exclusion in respect of the Isle of the Dead, in Tasmania”) was that I had manipulated data.
On the other hand, the thread to which you refer consists mainly of Steve McIntyre’s cheerleaders trying to pretend that I was withholding data. The fact is that (as I have already said to Ian), our methods were described in details in our two papers. The cheerleaders were apparently unwilling to (a) take the trouble to access these papers themselves (one would have thought that anyone seriously criticising climate change science would organise to have access to a science library!) and (b) divulge their identities. About the only good thing I can say about Ian at the moment is that he seems to be one of the few people on this thread who is honest enough to say who he really is. As I said on the climateaudit thread “I’m not interested in sending things to ghosts”. When the cheerleaders eventually accessed our digitised data (which, as I have said, is publicly available), what happened? – virtually nothing – after all the bluster, they just didn’t know what to do with the data. There is a pathetic high-school-level analysis at http://futurehistoric.wordpress.com/2011/03/06/frequency-analysis-of-tide-data-from-port-arthur-tasmania/, a site run by “John A”, the clown who used to run McIntyre’s site – but this does absolutely nothing to support his professed aim to “test and reproduce that work in conjunction with the much larger question of global sea level rise”. After all the posturing on climateaudit, where is the “audit”? – nowhere to be found. In this context, I think the words “intellectually bankrupt”, “naive”, “sycophants”, “lazy”, “posturing”, “mischievous”, “garbage”, “clowns”, “obtuse”, “stupid” and in need of having their “bottoms wiped” sum up pretty well the generic climateaudit cheerleaders.
Let me make a bet with you. The data to “validate” our work on sea level at Port Arthur is all publicly available and has been for a long time. I bet that neither Ian, or any of you, have the competence or stomach to go through all this data, produce a useful critique, get the new findings checked by someone competent, and then have them published.
10
Tell you what, John Hunter, why don’t you have a chat with your well connected mates and arrange for me, or any other sceptic, to get the same amount of funding that you had in preparing your papers so a proper critique can be done. It is all very well to give us a rant about others not having the “competence or stomach” to produce a useful critique but the fact is that most of us have to earn a living by other means while you were obviously paid for your effort.
And once again, you are misstating the issue. The problem is not with your processing of the data that you chose to process. The problem is with the reasons you gave for excluding other data. And the only claim of fraud has come from yourself. Fraud requires deception and no-one has claimed that the work you actually did involved deception. And no-one has claimed that you have hidden your reasons for not including other data. We simply have reasonable doubts as to the validity of your publicly stated reasons, and have expressed those doubts in this forum.
These doubts are the same ones expressed by the late, and lamented, John Daly. And yes, he may well be dead, as you say, but while we continue to think of him he, and his work, remains very much alive.
Of course, as you would be the one most familiar with your own work, you could do the truth a very great service if you were to cut and paste the part of your paper dealing with your reasons here.
For my own part, I remain surprised that your intellectual curiosity did not extend so far as to present two conclusions in your report, one based on the limited data that you chose to work with, and another based on your best efforts at reconstructing the entire data set. This approach would have enabled all interested parties to better understand the whole issue. But this ongoing shadow over your earlier work is entirely attributable to your trenchant insistence that yours was the only valid interpretation of all data from that period and your tediously common assertion that anyone who didn’t agree with you was either; stupid, in the pay of big oil, or any of the epithets that you have shared with us above and previously on Climate Audit.
I suspect that you, and a great many of your colleagues, need to read up on narcissistic personality disorder, and recognise that it is not all about you, rather, it is about the reasonable range of conclusions that could be drawn from what we see.
10
Ian Mott:
> why don’t you have a chat with your well connected mates and
> arrange for me, or any other sceptic, to get the same amount
> of funding that you had in preparing your papers so a proper
> critique can be done. It is all very well to give us a rant
> about others not having the “competence or stomach” to produce
> a useful critique but the fact is that most of us have to earn
> a living by other means while you were obviously paid for your
> effort.
Wrong again – much of the work that I did on the Port Arthur study was done in my own time, partly because I worked as a contract scientist (on other jobs) at CSIRO from 1998 to 2000, and partly because, in the early years of my present position (at the Antarctic Climate & Ecosystems Cooperative Research Centre), the Port Arthur work did not come under my responsibilities (which were to develop models of flow under Antarctic ice shelves). The same goes for my collaborator, David Pugh (who initiated this project) – all his work on the study (including the tedious transcribing of the handwritten data to the computer, and subsequent checking) was done in his spare time. Anyway, can you suggest why I should want to “arrange” for you to get funding “so that a proper critique can be done” (quite apart from the fact that our work has already undergone all normal processes of review)? The conventional process for getting a job in climate science (as in any other job) is to acquire suitable competencies in the subject and convince an employer that you have those competencies and that he/she should employ you. As far as I know you do not satisfy any of these criteria. If, however, you do satisfy the first criteria then I suggest that you apply for one of the climate-related grants that are available (I am told it is a “gravy train”) to carry out your “critique”. This is precisely what scientists on “soft money” do all the time.
> The problem is with the reasons you gave for excluding other
> data.
I have already explained why we excluded data for 1839 and 1840, when I said (9 Dec) that “there was some additional data for 1839 and 1840 but this includes a datum shift in December 1840, rendering all earlier data of no use to us.” Clearly, data with an unknown datum is useless for estimating the height of mean sea level. Now what part of this don’t you understand?
> Of course, as you would be the one most familiar with your own
> work, you could do the truth a very great service if you were
> to cut and paste the part of your paper dealing with your
> reasons here.
This is one reason why a used the word “lazy” to describe climate contrarians in the climataudit thread – I’ve already shown you where to download the papers. If you are not interested in reading them in their entirety, then I call that “lazy”. As far as I recall, there is a search facility in Acrobat – why not try searching for “datum shift”?
> For my own part, I remain surprised that your intellectual
> curiosity did not extend so far as to present two conclusions
> in your report, one based on the limited data that you chose
> to work with, and another based on your best efforts at
> reconstructing the entire data set. This approach would have
> enabled all interested parties to better understand the whole
> issue.
So, you “remain surprised” that we did not include data which was clearly from a different and unknown datum? I “remain surprised” not just that you think that this would be a good idea, but that are prepared to admit that you think that this would be a good idea.
10
Nice try Mr Hunter but it won’t wash. Of course there was a new datum, it was the mark made on the Isle of the Dead, was it not? And it does not matter that the previous datum is not known today because the mean of the 1839 and 1840 records produced a height that was a calculated variation from the original approximated datum.
You appear to have assumed that there were no local observational inputs prior to the first formal data collection in 1839. But you forget that only the best available sea captains of the time were trusted with the extremely long and challenging journeys to Tasmania. They were also at the very leading edge of what was later to become known as science and they had been visiting Hobart on a regular basis for the previous 50 years. And the probability that they, and the others stationed there, would not have arrived at a fairly close approximation of mean sea level during that time is extremely remote. It was, after all, a piece of information that was vital to the safety of the very shipping the Colony depended on for its survival.
The act of gathering formal data would have simply been done to confirm the exact position of a point that was already approximated by a number of well known local reference points. And that formal datum mark would not have been made unless the mean of the two year record from 1839 to 1840 was quite consistent with the accepted local approximations.
The mark was not put there as some lone and random act of gaffiti, rather it was a key community information product, provided by the relevant authorities for the purpose of public service. And the fact that records from that period may now be incomplete gives you absolutely no grounds for assuming that they were never complete in the first place. The presumption of competence must prevail because there can be no other implied motive on their part than the accurate recording of fact based on credible data.
I note that the overly exacting, almost anal, evidentiary tests you have applied in discounting the 1839/40 data gives an initial appearance of high professional standards, but the broader test is whether your approach is reasonable in both historical context and circumstances. And the answer to that remains a resounding no. And the contrast between this instance of excess exactitude and the many loose extrapolations to totally fanciful extremes on the part of many of your climate colleagues is also quite obvious.
It is my understanding that the 1841 tide records, that you have unwisely and somewhat belligerently sought to establish as the only valid data for that period, are likely to have been lower than ‘normal’ (ie the previously validated datum) due to the influence of ENSO. And when all these relevant matters are considered I am bound to agree with John Daly’s conclusions.
10
Ian Mott:
You don’t appear to have read (or at least understood) our two papers. Here again is a summary (although it is all clearly stated in the papers):
1. Thomas Lempriere collected sea-level data at Port Arthur from the late 1830s to the early 1840s.
2. We found Lempriere’s data (times and heights of high and low water) for the period December 1839 to December 1842. THESE RECORDS GIVE NO INDICATION OF THE DATUM TO WHICH THEY ARE REFERRED.
3. When we screened this data, we found a clear shift in December 1840, which coincided with a relocation of Lempriere’s observatory, which was noted in his meteorological records. There appears to be no datum shift in the records for 1841 and 1842. There are therefore at least two datums – one or more prior to December 1840 and one for the years 1841 and 1842. As noted above, Lempriere’s records give no indication of what these datums actually were – i.e. how the values in his record related to any point on the ground.
4. On 1 July 1841, Lempriere installed a benchmark on the Isle of the Dead, Port Arthur. A plaque near the benchmark related the level of the benchmark to the sea level recorded at the time on Lempriere’s tide gauge. This enabled us to relate Lempriere’s observations for 1841 to 1842 to the level of the benchmark. It did not tell us anything about the datum prior to the shift in December 1840 – this datum is therefore unknown.
5. You seem to find it hard to understand this, but given that Lempriere’s data from December 1839 to December 1940 was RELATED TO A COMPLETELY UNKNOWN DATUM it is of no value for estimating mean sea level at that time. It is as if I took data with a known datum and added a single unknown and random number to it – any useful information on mean sea level has been lost.
6. So THERE IS NO NEW DATUM. The only datum we have comes from the words on the plaque when the benchmark was installed on 1 July 1841. This relates the 1841-1842 data to the benchmark.
The “discussion” in you posting makes little sense, although I suspect it is an attempt to regurgitate John Daly’s theories about the benchmark. Daly had a fixation that the benchmark must have been installed at mean sea level at that time, and that sea level at Port Arthur has actually FALLEN since 1841. However, for this to be true you would have to explain away a number of inconsistencies arising from this claim, such as other observations of sea level later in the 19th century (see for example http://www.members.iinet.net.au/~johnroberthunter/www-swg/home.html#pa and http://www.members.iinet.net.au/~johnroberthunter/www-swg/reply.html). Also more recent observations using paleo techniques suggest that instead of OVERESTIMATING the rise in sea level, we may have actually UNDERESTIMATED it – this completely excludes any possibility of a sea-level fall since the 1840s (see http://www.sciencedirect.com/science/article/pii/S0012821X11005103).
Now Ian – as I said earlier “I wasted far too much time arguing these points with people like John Daly many years ago”. It appears that you have no new information and no new ideas. You appear to be simply regurgitating the stuff on John Daly’s website. I have no interest in wasting further time on this.
Move on Ian.
10
John Hunter; You have an interesting technique of implying that the things you don’t understand somehow qualify as evidence that the person saying things you don’t understand is talking babble. I have seen it before, but from people of much lesser ethics than your own.
It is even clearer now that you have approached the problem with a view to finding plausible pretexts for excluding inconvenient data. I note that there is two complete years of data for 1841 and 1842 but I also note that the benchmark was put in place on 1 July 1841 which neatly bisects the entire data interval from December 1839 to December 1842 into two 18 month intervals. And this renders your apparent desire to have two complete records and a known datum for the first half redundant.
Aside from some anal desire for a verifiable audit trail, you do not need to know what the datum was because we can be certain that Lempriere did know it. He could not have done the calculations that provided the mark he made without it. And once you have a credfible mean calculation for the first half of the data set you can simply take the mean from the second equal period, add the two together and then halve it to get the mean of the entire 36 month interval.
I accept that you may have detected a shift in data from the time that Lempriere moved house but you are merely assuming that it came from a datum shift. If the move of location was to a place further up the estuary then one would expect the normal tidal lags to produce lower maximum and higher minimum tide levels. But it simply beggars belief that, when faced with a change of location half way through a data collection exercise, that a competent person at the time would not take steps to ensure he was working off the same datum. A very short interval of data overlap between the two points, with the help of a second person, would have enabled a fairly accurate calibration of highs, lows and medians in respect of the original datum.
Yes, it would be nice to have a single, consistent data set to play with and tick all the boxes. But in the case of incomplete record reconstruction, we must start with a presumption of competence, and the entirely reasonable presumption that Lempriere took the time to think about the consequences of his change of location, before the event, on his data collection project and took appropriate action to maintain his datum.
The variance between the two halves of the data set is entirely within the normal range of annual MSL variation and the conclusion remains that the longer reconstructed set would have provided a more valid MSL figure for that period.
10
Ian Mott and John Hunter
Thank you for this discussion even with the tension.
I’ve been reading the tête-à-tête with an eye of neutrality. Frankly before this thread I knew nothing of John Hunter. John, you have presented your posts with sufficient restrained anger so as to convey a personal sense of indignation but not outside justifiable indignation. After reading your first post here, Google provided enough information for me to place you properly in the discussion.
Ian, I’ve read here before but have not met you nor is it likely since I’m in the USA. In all the previous writings from you I can’t recall a time where you would fall into the class of “standard contrarian” and I have most always found your posts to be logical and well thought. I know little more and have not used Google to advance my knowledge of Ian.
I say all this so that you both might know that I have no axe to grind myself. That said when Ian made this last post I’ll admit that it rang true with me. One has to assume that when a careful observer like Lempriere moved observation posts, he would have done his best to “adjust” his data to the new reference. I’d like to know what details are in the hands of the devil here.
John, you came here to make a point. So far you’ve made bluster. As I said above, that is somewhat understandable. You are an educator though and here is your opportunity to patiently educate all the rest of us reading here. I would encourage you to follow your natural indignation with more information. The end result may be the same, but I and others would appreciate hearing more.
Regardless, thank you both for your efforts to advance science in a true fashion.
MarkD
10
you don’t seem to understand what is meant by different datum.
I could measure and compare the height of all my office window sills by measuring the distance to my office floor. Now I want to compare my heights with measurements taken in the neighbouring building, but wait, I don’t know how the height was measured. What if it was measured to the ground outside? How could I compare the numbers?
If you have a way to correct the data not used in John Hunter’s paper so that it is comparable to the published data, you will easily be able to publish your findings.
10
Gee Aye, why do you bother to tell me about the unrelated height of your office windows? Even though I could easily tell you several ways to compare those heights with the neighboring windows it does nothing for you to argue why Lempriere wouldn’t have been painstaking with his efforts to adjust his new vantage match to match (or zero out) with his earlier measurments.
There are different datum and then there are different datum. For example if someone else other than Lempriere picked up the task. This apparently was a case of the same observer with some level of diligence moving his vantage point. If done carefully, this should not be a serious problem and further a reasonable adjustment would resolve the step up or down if Lempriere goofed. If one assumes Lempriere was sloppy then his whole series is useless right? As Ian has suggested it seems reasonable to assume that Lempriere was careful with ALL of his observations. Keep them all or dump them all.
10
Well all you need to do then is to verify that he was painstaking with his adjustments. If you can verify this then you can add them to the existing data and get a publication. If you can’t then a reviewer will tell reject the paper.
If you can show that Lempriere was sloppy, write up your justifications and get them published. I’ll publish them if you want to be a ghost writer. I could do with some cv padding.
The neighbouring windows are in a secure building and were measured by a now deceased person. Besides, the building fell down.
10
It appeared there because you are slower than me…..
Actually the post at 73.2.1.1. was pretty funny. I still could offer some pretty easy ways to get that building window height.
PS I’m feeling rather diplomatic at this moment. Don’t spoil it
10
by the way, I was replying to Ian Mott, but my reply appeared under your comment.
I also agree that this exchange was a better read than most… better than the lead article.
10
Ian:
Just what is it that you don’t understand about “I have no interest in wasting further time on this”?
10
Hmmmn, takes ball and goes home. Just one final data test for the record. If the mean of the first six months data from 1891 is any different from the mean as described by the benchmark put in place on 1 July 1891 then we can be absolutely certain that Lempiere knew exactly what his datum was for the 1839-1840 records. If it is the same then we would have the highly unlikely event that the benchmark was determined on the basis of only 6 months data.
Rest assured, I will, eventually get around to taking a good close look at this stuff. For the moment, my assumptions about Lempieres basic competence are a great deal more conservative than the lurid and outrageous crap that is fed into core IPCC projections like the SRES emission scenarios.
10
Thanks, MarkD, I was glad that John also took the time to provide more information to this process, especially as he was most familiar with it and could retrieve it with more ease than anyone else. My respect for him increased when it became clear that he and a colleague did this study on their own time. And that fact also partially relieves him of some of the professional duties expected of a report that might have been formally commissioned as input to a policy process. What we have seen here are the kinds of exchanges that should take place during peer review but even in peer review there is potential for broader perspectives, like forensic data reconstruction, to be excluded. And of course, the antidote to that is to detach the ego and just put it out there for all to see. An honest effort with mistakes is always more valuable than no effort at all.
10
Ian, thank you. I know that these threads seem to go “dead” as they get older. I also believe more people read them than post so even though they seem dead they still are valuable.
I agree that academically this is “pre peer review” (I think that is a reasonable paraphrase of what you said). I hope John will accept my thoughts and take a moment to go further without the feeling of being amongst “enemies”. I may not always seem like the most neutral arbiter here at Jo’s, but that is blogging. It doesn’t mean I can’t see value in a fair screening from both sides of an argument.
10
Mark D:
Thank you for you contribution, but I don’t agree that I’ve just “made bluster”. I’ve explained to Ian in very simple term, several times, the situation regarding the sea-level records and he just doesn’t seem to get it. I assume he has never dealt with these kinds of records before.
Let me repeat what I said earlier and provide a little more explanation (sorry if this get a bit repetitive but saying something once doesn’t seem to work):
1. Thomas Lempriere collected sea-level data at Port Arthur from the late 1830s to the early 1840s.
2. We found Lempriere’s data (times and heights of high and low water) for the period December 1839 to December 1842. THESE RECORDS GIVE NO INDICATION OF THE DATUM TO WHICH THEY ARE REFERRED. They give a series of heights relative to some unknown level. They can therefore, on their own, give NO INDICATION of mean sea level relative to a known height on the land.
3. When we screened this data, we found a clear shift in December 1840, which coincided with a relocation of Lempriere’s observatory, which was noted in his meteorological records. There appears to be no datum shift in the records for 1841 and 1842. There are therefore at least two datums – one or more prior to December 1840 and one for the years 1841 and 1842. As noted above, Lempriere’s records give no indication of what these datums actually were – i.e. how the values in his record related to any point on the ground. With this information, we still have no indication of mean sea level relative to a known height on the land.
4. On 1 July 1841, Lempriere installed a benchmark on the Isle of the Dead, Port Arthur. A plaque near the benchmark related the level of the benchmark to the sea level recorded at the time on Lempriere’s tide gauge. This enabled us to relate Lempriere’s observations for 1841 to 1842 to the level of the benchmark. It did not tell us anything about the datum prior to the shift in December 1840 – this datum is therefore unknown. The wording on the plaque tells us what Lempriere’s tide gauge read when the sea-level was at the same level as the benchmark during 1 July 1841. This therefore allowed us to reference the 1841 and 1842 data to a known height on the land (because we believe that the height of the tide gauge wasn’t altered during this period. However, from looking at the averages of various sections of the record, it was apparent that the vertical position of the tide gauge was changed in December 1940 – the record effectively has a “step” in it. So we can’t use Lempriere’s benchmark to reference the data prior to 1841. Mott seems to think that you can just join the records together like sticking the head of one worm onto the tail of the next – I assure you, from years of experience of looking at such records, that this is virtually impossible to do with any reasonable accuracy, given the shortness of the records. All we have is a series of high and low waters. The “step” only appears when we take averages over substantial portions of the record – it not evident at the “join” (i.e. in Dec 1840). The uncertainty of our estimate of mean sea-level from Lempriere’s 1841 and 1842 data was +/- 2 cm. To gain anything from the pre-1841 data, we would need to be able to match the two records together to at least this accuracy (or else there is no point in doing it). I contend that you can’t do it. Mott thinks he can and he is welcome to try (and to convince others that he has done something useful). However, even if you could specify the datum of this earlier accurately, the extra information would make a negligible change to the uncertainty. The way in which averaging might me expected to reduce the uncertainty is by reducing the interannual variability. I assume that Mott hasn’t done an error budget for these, but here are our estimates of the various contributions to the uncertainty (these are summarised in our second paper):
Inter-annual variability: 1.2 cm (for a 2-year record) and 1.2 cm (for a 3-year record) – so increasing the record by one year makes no substantial reduction in inter-annual variability
Levelling error between Isle of Dead and tide gauge (we assumed that the “levelling” was done by simply assuming the water surface at the time was level: 1.4 cm
Measurement error (dominated by the thickness of the line on the benchmark): 1.0 cm
On the assumption that these errors are independent, they were added together in quadrature to give a total uncertainty of +/- 2.1 cm FOR BOTH A TWO-YEAR OR A THREE YEAR RECORD. SO, EVEN IF WE KNEW THE VERTICAL DATUM OF THE PRE-1841 DATA, THEN IT WOULD MAKE A NEGLIGIBLE REDUCTION TO THE UNCERTAINTY.
5. You (i.e. Mott) seem to find it hard to understand this, but given that Lempriere’s data from December 1839 to December 1940 was RELATED TO A COMPLETELY UNKNOWN DATUM it is of no value for estimating mean sea level at that time. It is as if I took data with a known datum and added a single unknown and random number to it – any useful information on mean sea level has been lost.
6. So THERE IS NO NEW DATUM. The only datum we have comes from the words on the plaque when the benchmark was installed on 1 July 1841. This relates the 1841-1842 data to the benchmark.
I hope you understand this, Mark D, better than Mott. If Mott persists in his claims, you should also suggest to him that he gets hold of the publicly-available data, analyses it, writes a paper on the results and gets it published.
And good luck to him.
10
John Hunter:
A reasonable correction would be “more bluster than substance” and that is simply from my perspective. I didn’t mean that all of your contributions were bluster that was my over all impression of the tone. The explanation that you just made is much appreciated.
Thank you again.
10
Mark D: A couple more points. Firstly you say:
“For example if someone else other than Lempriere picked up the task. This apparently was a case of the same observer with some level of diligence moving his vantage point. If done carefully, this should not be a serious problem and further a reasonable adjustment would resolve the step up or down if Lempriere goofed. If one assumes Lempriere was sloppy then his whole series is useless right? As Ian has suggested it seems reasonable to assume that Lempriere was careful with ALL of his observations. Keep them all or dump them all.”
But this is the whole point of what I’m trying to say – there is a “step” in Lempriere’s record coinciding roughly with when he moved his tide gauge. He clearly DID NOT try to keep the recorded levels to the same datum. And he also didn’t “goof” in this apparent lapse – at that time he was only interested in the TIDES and not mean sea level. It was only when James Clark Ross wintered in Hobart in 1840/1841 that he was asked to install the benchmark. When you are only interested in tides, you generally only bother about the times of high and low water, and whether it is a “big” tide or a “small tide” – absolute levels at the accuracy of a few cm are not of interest.
Secondly, you say “I agree that academically this is ‘pre peer review'” – no, it is most certainly NOT “pre peer review”. This work went through pre-peer review in my own institute nearly a decade ago, and through “proper” review prior to publication in 2002 and 2003. Since then there has been a huge amount of NON-PEER REVIEWED and largely uninformed comment on the web about sea level at Port Arthur (e.g. John Daly’s stuff).
And, speaking of “uninformed comment”, do you wonder that I got a bit frustrated when Mott launched into this part of the thread with “lets not forget John Hunter’s little exercise in data exclusion in respect of the Isle of the Dead, in Tasmania”, when he was “at this stage ….. working from memory only”?
10
John,
We are crossing comments on the web. I’ll do my best to explain. I wasn’t referring to your published paper. I was trying to say that discussions like these (on this blog) are pre-peer, an attempt to convey that there are people educated enough and interested enough to go beyond news stories. I didn’t mean to convey that this blog is the equivalent to true peer review.
Our posts crossed and I again thank you for the added information. Ironically I was typing some additional questions regarding the measurements that pertain to “big tide” “small tide” and how that gets translated to “level”.
Finally, I do appreciate how people become frustrated, I’ve been regularly reading and posting here for several years. I’ve seen competent people with expertise ignored or ridiculed by people with “more expertise” and “less expertise”. I’ve been frustrated many times, we are all human. I posted my recent comments here in an attempt to first calm the “waters” and perhaps have some helpful exchanges.
10
John continues to assume that whatever is not on record now is what was not on record then. This is highly unlikely. He also continues to suggest that the benchmark made on 1 July 1841 refers to the entire 1841-1842 period when this is only in hindsight. When that mark was made it could not possibly have been derived by data that was recorded after that date. So the benchmark can only be derived from two lots of data. It is either the mean of the data after the move, from December 1840 to 1 July 1841, or it is a mean derived from additional data. And that additional data can only be from 12/1839 to 12/1840.
And as I have already said, if the mean is any other figure than the mean of the first six months of 1841 then Lempiere clearly knew what his earlier datum was. And if the benchmark is the same as the six month mean then the benchmark has been derived from an inadequate sample and I will be the first to concede that John is right and I was mistaken.
10
Ian Mott: you don’t seem to understand what a “benchmark” is. It is a mark on a rock. The Port Arthur one included a nearby plaque which effectively said “when sea level was at this mark at time X on 1 July 1841, the tide gauge read Y” This therefore relates Lempriere’s observations at that time to heights relative to the benchmark. For example, when Lempriere’s record read Z, this meant that sea level at the time was Z-Y above the benchmark. Now, annual averages of Lempriere’s observations (i.e. the numbers read off his data sheets) were as follows:
1840: 1.651 metres, 1841: 1.415 metres, 1842: 1.403 metres (these are relative to the zero of Lempriere’s tides gauge, and obviously we have converted from Imperial to metric units).
The closeness of the averages for 1841 and 1842 (within 12 mm) convinced us that there had been no datum shift during 1841-1842, but the large difference between these averages and the one for 1840 (over 20 cm) also convinced us that there had been a datum shift – probably when Lempriere moved his gauge in December 1840. So, yet again: THERE IS NO DATUM INFORMATION PRIOR TO DECEMBER 1840. If you just throw the data prior to 1840 into the average you will get the wrong answer – because you are including an unknown datum shift.
Hopefully this explanation shows that statements like “the benchmark can only be derived from two lots of data” are meaningless. A benchmark is a MARK and NOT A NUMBER.
Mark D – can you explain this to Ian? – I don’t seem to be getting through to him.
By the way – this is all in the papers (links above) if anyone can take the trouble to read them.
10
I’ve been away for some days and have read these comments with some interest. I don’t have access to Port Arthur’s historic data, having accessed only the data on the BOM site for Spring Bay from 1985 and Hobart from 1960.
Ian: This problem is similar to that of making a combined temperature record for a town where the measuring site has been moved. If there is a discontinuity in the record this can be resolved by comparing the two records IF THEY OVERLAP. If they are two discrete sets of data they can not be combined.
John: However, a mere 200mm difference in annual averages can not be assumed to be due to a datum shift alone. There are examples of much greater variances in Hobart’s record in recent times e.g. 1974 1.185m, 1975 0.716m – that’s 469mm inter-annual difference, or 54% of Hobart’s MSL. I understand there’s only a few centimetres difference betwen Hobart and Port Arthur. Was the possibility of changed meteorological conditions considered?
So, I beg to differ with you both, and look forward to continued (polite) exchange.
Ken
10
Ken Stewart:
Thanks for your comment about datum shifts – this is the point I’ve being making for a while on here ….
As for the comparison of annual average sea level for Hobart for 1974 and 1975 – these values are erroneous – the annual average cannot change by nearly 0.5 metre from year to year. I have spent a long time (like weeks) cleaning out all the bad data from the Hobart record (it is probably the worst data I’ve ever come across) – when I did this, I deleted all of 1974 and 1975 as being of poor quality (basically shifted by some unknown amount in the vertical). Your values are identical to the ones I get by downloading the file 838.metdata from http://www.psmsl.org/data/obtaining/met.monthly.data/838.metdata. Plot this file out (actually, you don’t need to do this because John Daly has already done it for you – see below) and you’ll see how bad the data is (the monthly average changes over 1.4 metres from mid 1974 to early 1976 (the tidal range in Hobart is only about 1 metre!). Also note that the data from Hobart is so bad that it doesn’t merit an “RLR” dataset at the Permanent Service for Mean Sea Level (PSMSL) (these are the ones with trusted and stable datums) and are only classified as “Metric” for which PSMSL gives the caveat “use only with extreme caution”. There is an interesting story about the Hobart tide gauge – there was a period of several years when whoever was in charge of the gauge used to come in every day and adjust it so that it agreed with the tide tables – and didn’t make a note of the amount of the adjustment!
Interestingly, John Daly fell into the trap of ignoring datum shifts in tide-gauge records – go to http://www.members.iinet.net.au/~johnroberthunter/www-swg/ and scroll down to “Example 2: Datum Shifts in the Hobart Tidal Record”. Your 1974/1975 excursions are very clear there. I think the fact that Daly presented this data as trustworthy shows just how a “careful” a “scientist” he was …..
Thanks for your interest.
10
No John a benchmark is a mark that expresses a number. You continue to talk about how the current unknowns prevented you from replicating a calculation that was done in 1841. And you continue to assume that because you cannot identify the datum today then no-one in 1841 could either. I did get a brief chance to look at John Daly’s site http://www.john-daly.com/deadisle/index.htm and was reminded that aside from the plaque you refer to are written references by Capt. Clark Ross to the mark being mean sea level for 1841. He also pointed out that the tidal range at the Isle of the Dead was only 75cm, and that Lempriere was working with the benefit of fixed tidal gauges. He also provides a very good map and explanation of conditions at the site which is quite sheltered and with few wave height issues to complicate matters. A 200mm error in such a modest range is highly unlikely.
John, you have constantly protested the call on your time on this issue but have also continued to post and try to pre-emptively settle this matter before I have had the time to properly go back over both your own and Daly’s material.
10
Ian Mott:
I continued this discussion because I encountered two apparently intelligent and receptive people who, with a little explanation, could understand what was going on. You seem incapable of this. Ken Stewart explained how you cannot join two records together in order to establish a common datum unless there is substantial overlap. In the case of Lempriere’s pre-Dec 1840 and post-Dec 1840 data, there is no such overlap. The pre-Dec 1840 data is simply hanging in the air with no reference level – it is just a set of numbers, like thermometer readings where the original numbers have been rubbed off and replaced with a new set of numbers with an arbitrary and unknown offset.
I work with tide-gauge records all the time. They often contain unrecorded datum shifts which render some of the data useless (as I showed with the Hobart data). It is very rare (and unnecessary) for the datam to be retained when a tide gauge is moved – all that is necessary is to record the new datum for posterity – unfortunately this information often gets lost – WHICH MEANS THAT IT IS GENERALLY IMPOSSIBLE TO KNOW WHAT THE DATUM WAS.
You say that “a 200mm error in such a modest range is highly unlikely” – it ISN’T AN “ERROR” – it the difference between annual averages which is too large to represent a change in the real world. It therefore most probably represents an unknown datum shift (just as there are many in the Hobart record). As I have explained numerous times, this is a perfectly normal occurrence in tide-gauge records. Incidentally, the person who did the analyses on Lempriere’s records was David Pugh, who is one of the world’s experts on tides and their observation. He has written a definitive book on tides and another more generic one on sea level. He, too, understand these things because he has spent his life working on them. I am continually astounded at the arrogance of people like you who come upon what is a trivial and yet well-understood issue in science and think you have unearthed something that everyone else has missed.
Finally, you say: “you have constantly protested the call on your time on this issue but have also continued to post and try to pre-emptively settle this matter before I have had the time to properly go back over both your own and Daly’s material”.
Ian – this is NOT the way to do science – you don’t make an initial pronouncement like
“Lets not forget John Hunter’s little exercise in data exclusion in respect of the Isle of the Dead, in Tasmania. Some small portion of records from the year from which the mean sea level mark was made were lost. But as we know the mean for that year from the rock mark, it is easy to fill in those data gaps to get the same result”
and then check your “facts” later. You’ve got yourself into a deep hole by not doing your homework and are now having to do the wriggling to get out of it. Don’t blame me if you are making a fool of yourself for all the world to see.
10
I’m afraid the audience is not as big as the whole world but the observation still holds. You might like to head over to another dead thread with a kick in the tail http://joannenova.com.au/2011/11/the-chemistry-of-ocean-ph-and-acidification/
In this one a whole heap of astoundingly arrogant statements from early in the thread are debunked at the end but none of the posters noticed.
10
John:
Thank you for the information on Hobart. I certainly did notice the wild swings in Hobart and a number of other records. Question: If the data from a station is so spurious, why is it kept on the BOM website for sea level statistics? (Including the 1968-9 data for Spring Bay- the minimum recorded level refers to 0.0 on 21/12/68.)
Also, is any Hobart data useful? How far back can we go e.g from 1991? I ask because from 1991 gives a (albeit short term) rise of very roughly +0.25mm/yr which is much different from that of Spring Bay.
I should point out that I fully agree that there is a continuing long term sea level rise of 1 to 2 mm/yr but I do not see any sign that this is unusual or accelerating.
10
John Hunter. You have consistently failed to deal with the simple fact that the records you have to work with today are unlikely to be as complete as the full suite of information employed at the time the mark was made. You see what you hope is evidence of an unrecorded datum shift but the extent of the shift could have been so obvious to the participants at the time that it did not merit mention. We do know that the mark that has been made is the universal mark used to denote a mean sea level. And we know that Lempriere’s supervisor went to print a few years later describing the mark as exactly that.
I also note that you provided means for each of the three whole years but we still don’t know what the mean was for the six months of the new data set up to 1 July 1841 when the mark was actually made. So we don’t know if it is a product of just six months data or the previous 18 months. Nor do we know if earlier overlapping data has been lost.
You may well regard the asking of specific questions to clarify a point as a sign of a fool but your own approach to this discussion has given many readers some useful insights into your own character and approach to legitimate inquiry.
10
Science does not proceed using unsupported assumptions like
the paper would not have been published if JH and coauthors had stated this as a reason to keep the data in their submitted manuscript. You go find support for this statement and go publish it.
10
Ian Mott:
I still don’t understand where you have a problem. Let me respond to your sentences one at a time:
> You have consistently failed to deal with the simple fact that the
> records you have to work with today are unlikely to be as complete
> as the full suite of information employed at the time the mark was
> made.
There was undoubtedly other information which has been lost. This is a fact of data archaeology. What you don’t seem to appreciate is the fact that no earlier data was necessary in order to locate the mark. It was simply put in at a convenient level, like all survey marks. They do not have to be put at a specific level – just at a STABLE level – and they need information which relates this level to something else of interest, which was in this case Lempriere’s tide gauge. The plaque which accompanied the benchmark noted the reading on the tide gauge when the sea level was at the benchmark. THIS IS ALL THAT IS NECESSARY TO ESTABLISH A DATUM FOR THE TIDE GAUGE. THERE WAS NO REQUIREMENT FOR ANY OTHER EARLIER DATA FROM THE TIDE GAUGE.
> You see what you hope is evidence of an unrecorded datum shift but
> the extent of the shift could have been so obvious to the
> participants at the time that it did not merit mention.
You also don’t seem to appreciate that datum shifts in tide gauge records are very common (as I showed with the Hobart record). Records of such datum shifts (other than is implied from the actual tide gauge observations, such as the shift in December 1840) often don’t survive. It isn’t a matter of it being “obvious to the participants” – of course it would be “obvious to the participants” – if you move a tide gauge to a new place, the datum almost always changes – and, as I indicated earlier, if you are only interested in the times and range of the tides, then it doesn’t matter. It wouldn’t have been a major concern to Lempriere UNTIL he was instructed to install the mark (which was specifically put in to indicate any changes in mean sea level). It is significant that there doesn’t appear to be a datum shift in the records AFTER the mark was installed – if you are interested in mean sea level (as Lempriere would have been AFTER 1 July 1841) then you try not to change the datum, or if you do you then you make sure the amount of the datum shift is recorded securely for posterity.
> We do know that the mark that has been made is the universal mark
> used to denote a mean sea level.
Now this does show how you don’t check your facts. A “broad arrow” mark is a universal SURVEY MARK, and NOT a universal mark of mean sea level. To show this, I just Googled ‘arrow “survey mark”‘. The third entry was a link to:
http://www.cumberlandgroup.com.au/Documents/SURVEY_MARKS_ACT_1902.PDF
which is the SURVEY MARKS ACT 1902 for New South Wales, which states:
“In the conduct of official surveys made by the direction or under the authority of the Government, the distinguishing mark to be used by the surveyors appointed or licensed by the Government to conduct the same shall be in the form of a broad-arrow, which mark shall not be used by private surveyors or other persons not authorised in that behalf by the Government.”
So – pretty easy to find, yes? But that didn’t stop you pretending that a broad arrow mark is an indication of mean sea level.
Now you seem to be attempting to dig up the “Daly-fossil” that claimed that the mark was originally located at mean sea level. As I have indicated before, this has been discussed at length and I am not interested in pursuing this further. See:
http://www.members.iinet.net.au/~johnroberthunter/www-swg/reply.html
for my final views. This document, incidentally, was prepared as a short paper to be published in Geophysical Research Letters in response to a Comment from John Daly criticising our work. However, the referees decided that Daly’s Comment was not worthy of publication, so our response also was never published. You can read Daly’s jaundiced view of this affair on his website.
> And we know that Lempriere’s supervisor went to print a few years
> later describing the mark as exactly that.
Again, I’m not discussing this – it has already been discussed ad nauseam.
The second paragraph of your posting is irrelevant to the siting of the mark, as I indicated above.
Finally you say “you may well regard the asking of specific questions to clarify a point as a sign of a fool”. No – I don’t. Both Mark D and Ken Stewart asked straight and relevant questions and got straight and relevant answers (at least, they seem to be happy with them). You, on the other hand have very much the resemblance of a cracked record – nothing I say seems to change your statements – you just keep rolling out the same stuff. Others may judge whether this is “a sign of a fool” or not.
10
Ken Stewart:
> If the data from a station is so spurious, why is
> it kept on the BOM website for sea level statistics?
You probably ought to ask them that question. I would certainly only make such data publicly available if it was accompanied by a significant caveat (such as the one provided by the Permanent Service for Mean Sea Level, which holds one of the major global sea-level databases). Also, this should be a lesson to anyone dealing with historic sea-level data – MOST OF IT WAS NEVER COLLECTED FOR SCIENTIFIC USE – it was generally collected simply in support of day-to-day marine operations, which requires much less accuracy than scientific studies. It is only in the last couple of decades that tide gauges have been installed purely for scientific studies, such as investigations of mean sea level.
> Also, is any Hobart data useful? How far back can we
> go e.g from 1991? I ask because from 1991 gives a
> (albeit short term) rise of very roughly +0.25mm/yr
> which is much different from that of Spring Bay.
OK – here is my take on the Hobart tide-gauge record. Observations started in 1889, so this was one of the earliest tide records in Australia. However, after removing spurious data and data that quite clearly has no known datum, we are left with only 39 years starting in 1962. This data is still probably not suitable for estimating changes in mean sea level, and I believe that the datum is only really reliable after 1989. So – a century of data which can’t be trusted for studies of mean sea level! – but recall my comment that this data has never been collected with the intention of providing scientific data – it is collected solely for marine operations.
> I should point out that I fully agree that there is a
> continuing long term sea level rise of 1 to 2 mm/yr
> but I do not see any sign that this is unusual or
> accelerating.
This is another issue, and of course the subject of this original thread. People (both contrarians and some scientists) seem to get fixated about seeking an “acceleration” in the 20th century observations. This ignores the fact that, in order to have the present rate of rise (about 1.7 mm/year over the 20th century and around 3 mm/year over the past few decades), sea level must have accelerated recently from the quite stable state which existed over the past few millennia. Contrarians love to pretend that what we are seeing at present is just a recovery from the last ice age. However, if you look at the actual paleo data, you will see that sea level stabilised at close to its preindustrial level about 6000 years ago – see:
http://www.ipcc.ch/publications_and_data/ar4/wg1/en/figure-6-8.html
One way of putting the present (relatively modest) rate of rise in context is to consider that:
THE LAST TIME SEA LEVEL WAS RISING AT THIS RATE WAS ABOUT 7000 YEARS AGO WHEN THERE WERE ONLY AROUND 7.5 MILLION PEOPLE ON THE EARTH (ONE THOUSANDTH OF THE PRESENT POPULATION).
This is why even the relatively modest rate of rise is significant. It is very “unusual”.
Thanks again for your interest.
10
John:
So would you disagree with the CSIRO and the Climate Change Department who say in “Climate Change Risks to Australia’s Coast” (referring to Australian sea level): “For the past 6,000 to 7,000 years, the sea level has oscillated within a narrow band of plus or minus 2 metres”?
There is ample evidence of sea levels about 2m above present heights around Australia; Beachmere in Qld shows sealevels c. 1700 years ago at about +1.7m, and there are older ridges further inland. Oscillating up and down in a 4m range in 6-7000 years is close to 1mm/yr. I would be interested in your comment.
Ken
10
Ken Stewart:
The Figure 6.8 of the IPCC Fourth Assessment Report to which I referred shows the “ice-equivalent eustatic sea level”. This is the amount of water added to the ocean by melted ice (which dominates sea-level change over glacial cycles) – it is effectively “global-average” sea-level change.
The quote to which you refer from “Climate Change Risks to Australia’s Coast” relates to RELATIVE sea level, which is the sea-level measured relative to the adjacent land. As explained in Box 1.1 (which is referenced in the same paragraph as your quote), relative sea level is significantly affected by vertical motion of the crust of the Earth (“glacial isostatic adjustment” or “postglacial rebound”) for millennia after the actual ice has stopped melting. This caused the “highstand” of relative sea level seen over most of Australia roughly 5,000 years ago. So – it is complicated, but it is the explanation for your statements about relative sea level around Australia.
My remarks in my last posting related to “ice-equivalent eustatic sea level”, and not relative sea level (although it doesn’t change the magnitude of the rates very much). Here are some approximate numbers for ice-equivalent eustatic sea level from paleo analyses:
7,000 years ago: Sea level 6.5 metres below present, rate of rise 2.7 mm/year
6,000 years ago: Sea level 2.5 metres below present, rate of rise 0.8 mm/year
4,000 years ago: Sea level 1.0 metres below present, rate of rise 0.7 mm/year
2,000 years ago: Sea level 0.1 metres below present, rate of rise 0.4 mm/year
Note that ice-equivalent eustatic sea level has been increasing monotonically over this period – i.e. there was no highstand.
These are consistent with what I said in my previous post and also with the report “Climate Change Risks to Australia’s Coast” (which referred to relative sea level, which is slightly different). Over the past 7,000 years ice-equivalent eustatic sea level has changed by over 6 metres.
I hope this helps.
10
John Hunter, could you please comment about the effects of agricultural irrigation on present day sea level?
I know here in the US alone we have pumped a substantial amount of water from underground aquifers primarily since 1950. Additionally, much volume of surface water was drained and converted to agriculture during the last 150 years. Presumably all this water is now in the oceans.
Has this been studied? Just using “napkin” calculations, the above US water use should have caused measurable effects on sea levels. I presume that similar irrigation and surface water uses have occurred worldwide wherever intensive agriculture is done, making any such effects even greater.
I’d appreciate your comments.
Some reference:
The US Ogallala aquifer has lost 312 km³ since 1950.
http://en.wikipedia.org/wiki/Ogallala_Aquifer
http://www.epa.gov/wetlands/vital/status.html
10
Mark D
fascinating comment.
10
Mark D:
Yes – my colleagues John Church, Neil White (CSIRO, Hobart) and others have done the major work on this – the contribution of dams and aquifers is quite significant. For the most recent stuff, see:
It is this good closure of the
Church, J.A., N.J. White, L.F. Konikow, C.M. Domingues, J.G. Cogley, E. Rignot, J.M. Gregory, M.R. van den Broeke, A.J. Monaghan, and I. Velicogna (2011), Revisiting the Earth’s sea level and energy budgets from 1961 to 2008, Geophysical Research Letters, 38, L18601, doi:10.1029/ 2011GL048794
and
Church, J. A. and N.J. White (2011), Sea-level rise from the late 19th to the early 21st Century. Surveys in Geophysics, 32, 585-602, doi:10.1007/s10712-011-9119-1
You can download both of these by going to: http://www.cmar.csiro.au/sealevel/sl_pubs_peer.html
(the links on this page will take you to the publishers’ sites – but don’t worry – the papers are both free to download).
The fact that we can close the water budget reasonably well gives us confidence that sea level is indeed rising and that we understand pretty well why it rising.
Cheers.
10
Mark D: Sorry for the typos in my last post – ignore “It is this good closure of the” before the first reference.
10
John
I have read a number of your posts above and as you are someone who professes to be looking at things from a scientific point of view you leave me extremely worried for the future of Australian Science.
Your inability to get away from the “number of people” concept and just look at the evidence is VERY disturbing.
First we have an end of ice age melt which had several thousand years at 13 mm per year.
Then we have a final ice melt flux and then several thousand years of relative stability.
You now claim we humans are causing catastrophic sea rise which is NOT BEING MEASURED anywhere but in CSIRO labs or in the minds of CSIRO staff.
Cant you see there is something wrong here??
10
John H
Your last comment: ” The fact that we can close the water budget reasonably well gives us confidence that sea level is indeed rising and that we understand pretty well why it rising.”
You have to be kidding??
I am tempted to ask do you have any training in Geology or modeling?
Have you been to the Geology museums where they have a piece of granite and long side of it a beaker with an astounding volume of water which was extracted from the granite?
You have accounted for all the water in the Earths crust and biosphere?
I should mint you a medal!
10
John:
I am quite aware of the different factors in relative sea level, especially post-glacial rebound in Europe and North America. Are there other fairly stable areas of the world similar to Australia i.e. where relative sea level was 2m higher 4000-6000 years ago and then steadily decreased? Is there no evidence of sea level in Australia being lower in the past 3000-4000 years?
Ken
10
John H
Your comment :: “This ignores the fact that, in order to have the present rate of rise (about 1.7 mm/year over the 20th century and around 3 mm/year over the past few decades), sea level must have accelerated recently from the quite stable state which existed over the past few millennia.””
This comment is to the best of my knowledge completely unsubstantiated by any current data outside of the CSIRO.
10
KinkyKeith:
I don’t know why you guys have this fixation with CSIRO-bashing. I don’t even work for CSIRO and much of what I say comes from non-CSIRO scientists. For example, taking my quote:
“This ignores the fact that, in order to have the present rate of rise (about 1.7 mm/year over the 20th century and around 3 mm/year over the past few decades), sea level must have accelerated recently from the quite stable state which existed over the past few millennia.”
The estimates of sea-level rise for this century come from a variety of sources – for example, see:
Church, J. A. and N.J. White (2011), Sea-level rise from the late 19th to the early 21st Century. Surveys in Geophysics, 32, 585-602, doi:10.1007/s10712-011-9119-1
(see earlier post on where to find this) which shows (Fig. 6) the good agreement between The Church and White (i.e. CSIRO) reconstruction with the results of other (international) groups and with observations from satellite altimeters.
For the stability of sea level over past few millennia, I already referred to the Figure 6.8 in the IPCC Fourth Assessment Report at:
http://www.ipcc.ch/publications_and_data/ar4/wg1/en/figure-6-8.html
for which there was absolutely no input from CSIRO.
Rate of sea-level rise over the past 20,000 years are discussed in the recent paper:
Stanford, J.D., Hemingway, R., Rohling, E.J., Challenor, P.G., Medina-Elizalde, M. and Lester, A.J., 2011. Sea-level probability for the last deglaciation: A statistical analysis of far-field records, Global and Planetary Change, Volume 79, Issues 3-4, Pages 193-203, doi:10.1016/j.gloplacha.2010.11.002.
– but, again, nothing to do with CSIRO.
So, your statement that “this comment is to the best of my knowledge completely unsubstantiated by any current data outside of the CSIRO” simply illustrates your lack of knowledge – nothing else.
10
KinkyKeith:
In response to your other post:
> First we have an end of ice age melt which had several thousand years at 13 mm per year.
– actually, more like 30-40 mm/year at it’s maximum rate. But, again the world was rather different then – what we think of as “civilised” society was nowhere to be seen.
> Then we have a final ice melt flux and then several thousand years of relative stability.
Correct.
> You now claim we humans are causing catastrophic sea rise which is NOT
> BEING MEASURED anywhere but in CSIRO labs or in the minds of CSIRO staff.
You made this bit up. I never mentioned “catastrophic sea rise” – I quoted the rates of rise being reported by sea-level scientists from institutions from all over the world.
> Cant you see there is something wrong here??
Only with your interpretation of the science.
10
KinkyKeith:
Finally, your post starting “Your last comment:”
Perhaps you should read the papers to which I referred, which estimated the various components of sea-level rise (ice melt, thermal expansion, building of dams etc., which are all estimated INDEPENDENTLY of any observations of sea-level rise). When these are added together, the result follows closely the observed sea level change over the past 40 years. This is what I mean by “closing the water budget” – it doesn’t require that “all the water in the Earths crust and biosphere” be accounted for.
10
Hi John Hunter
Why do you so easily fall into the trap by illustrating your prejudices in the very next post.
“what we think of as “civilised” society was nowhere to be seen.”
Look at the science and leave the fantasy to the IPCC and warmers.
10
John Hunter
I hope I’m not misreading you because I have been responding because of the strong feeling you are saying that the development of civilization and production of CO2 is the primary cause of the recently discovered 3mm per year rate for the last couple of decades.
Nils Axel Morner and our local Sydney Harbour study by Doug Lord indicate 1 mm or less as the current rate.
10
Ken Stewart:
> Are there other fairly stable areas of the world similar to Australia i.e. where relative
> sea level was 2m higher 4000-6000 years ago and then steadily decreased?
Yes – you need to look at the literature relating to models of glacial isostatic adjustment (GIA) – look for stuff from Lambeck, Peltier and Mitrovica for a start – these papers will show global maps of GIA.
> Is there no evidence of sea level in Australia being lower in the past 3000-4000 years?
Interesting point – it may that Tasmania didn’t have a highstand since the last glaciation – it would be useful to know this, as it would help constrain the history of land-ice (which we need to know better in order to better model GIA). However this is an open question at the moment.
10
John:
Thank you very much, that info is very helpful. I am interested in this and will probably post about it after some reading- I have some ideas of my own.
On the last point, such evidence would be hard to find being submerged (and eroded/silted), and dating would be difficult, and I haven’t been able to find any mention as yet in the literature but will keep looking.
By the way, I forgot to query with you re Hobart- if Hobart’s data is fairly reliable after 1989, I did a quick calculation and including 1989 puts Hobart’s MSL trend at about +0.4mm/yr; from 1990 still puts it at 0.4mm/yr. So it’s very different from Spring Bay.
I appreciate your helpful comments – but I still think MSL in Australian waters will continue at the historic rate, increased and decreased by SOI influences: 20 years of satellite and NTC data is far too short.
Ken
10
KinkyKeith:
Just out of interest, do you have anything substantial to contribute rather than unsubstantiated, ignorant and disparaging comments? Read the posts of Mark D and Ken Stewart if you want to find out what I mean.
10
Hi John
I started to read back up the post chain and found a comment from you that you had worked for CSIRO for a few years. Is that correct?
It contrast with your recent comment : “I don’t even work for CSIRO”.
John I can see from other posts that you are discussing matters of interest at a very technical manner and that those comments are valued and that certainly these other correspondents are much more civilsed than me.
I have been reading this stuff for too long and detected some items which set me off.
10
Well I read a couple of John Hunters posts and became disturbed by the familiarity of method in his writings. Familiarity with the eventual warmer stance that:”we theugly human race, via CO2 , did it; yes we caused sea level rises.
And so I started to read up the chain and found this at 64:
“If you want my unsolicited advice I would not waste one second of time with John Hunter. A better investment in time would be to read through these 622 comments at Climate Audit and you can see first hand that John Hunter graduated with honours from the Michael Mann school of obfuscation. To give you just one example of his hypocrisy and childish behaviour there’s this comment from Steve McIntyre”
First impressions mostly ring true.
10
KinkyKeith:
As far as I know “I don’t even work for CSIRO” and “I worked for CSIRO over ten years ago” are consistent statements.
All the references I have given are to science that was done SINCE I worked for CSIRO.
10
KinkyKeith:
> Well I read a couple of John Hunters posts and became disturbed
> by the familiarity of method in his writings. Familiarity with
> the eventual warmer stance that:”we theugly human race, via
> CO2 , did it; yes we caused sea level rises.
As far as I recall I have not mentioned anything about whether humans were responsible or not for the present warming. I have mainly defended the work we did on historical sea level at Port Arthur and provided information as requested to Ken Stewart and Mark D. So – NO MENTION OF the “ugly human race” or AGW. I did use the phrase ‘“civilised” society’ for the simple reason that, to call a society “civilised”, is very much a value judgment; I think most people would know what I mean. I also referred to “society” in this case to indicate that, as the world came out of the last age, humankind was very different – a hunter-gatherer lifestyle, no stable agricultural systems, no cities (and, of course, virtually no vulnerability to sea-level rise).
> And so I started to read up the chain and found this at 64:
> etc etc.
> First impressions mostly ring true.
You appear to be criticising the words I used in another blog, where I was subjected to a similar level of harassment to the treatment I have received from some people on here. I explained all this in post 68, where I also indicated how the “Port Arthur” topic started in this thread and noted that: “Ian’s original comment (6 Dec) came completely out of the blue. I have showed that this comment was quite untrue, and Ian admits that they were “from memory”. The implication from the start (“lets not forget John Hunter’s little exercise in data exclusion in respect of the Isle of the Dead, in Tasmania”) was that I had manipulated data.”
Is it any wonder that climate scientists generally refrain from discussing science with people like Ian and you?
10
KinkyKeith:
I’ve only just noticed your statement:
> I hope I’m not misreading you because I have been responding
> because of the strong feeling you are saying that the
> development of civilization and production of CO2 is the
> primary cause of the recently discovered 3mm per year rate for
> the last couple of decades.
>
> Nils Axel Morner and our local Sydney Harbour study by Doug Lord
> indicate 1 mm or less as the current rate.
Firstly, over “the last couple of decades”, the global-average sea-level rise (as measured by satellite altimeters) has been a little over 3 mm/year – I don’t know any competent analyst who disagrees with this.
Secondly, here is a copy of an exchange of emails with Nils-Axel Mörner:
http://www.members.iinet.net.au/~johnroberthunter/www-swg/morner_emails.txt
Read them and tell me what his says about his sanity and his trustworthiness. I, like many others, discount his opinion totally.
Thirdly, if you care to download the annual sea-level data for Fort Denison from the Permanent Service for Mean Sea Level, you will find that the trend for 1993 to 2010 (the same period as the satellite altimeter record) is 2.9 mm/year (close to the global average over the same period) – much larger than 1 mm/year (the average rate over a longer period). Of course this (1993 to 2010) trend carries two strong caveats:
1. Records from single tide gauges which are only about 20 years long are not indicative of the long-term trend (due to interannual and interdecadal variability).
2. There is no reason why the trend from a single tide gauge should be the same as the global-average trend (i.e. any single number included in an average doesn’t have to be the same as the average).
10
I don’t know if his sanity can be inferred from this exchange but he is very evasive. Did you ever get to see his data or analysis?
10
Hi John
So you think that 17 years from “1993 to 2010” is a good statistical sample?
Just for the record, do you believe that man is the cause of the Global Sea level rises occurring at this time and that therefore we need to limit CO2 output?
Could you please clearly state what your position is on this.
10
John
The longer this goes on the more suspicious I get.
You give a wonderful list of sea level rise rates from about 7,000 years back.
That’s great.
Could you explain to me why you OMITTED the fall rate that should have been included from about 5,000 in?
Or is it just embarrassing to have to include evidence of sea level falls?
10
I think it is timely to go back to how this particular sub-thread began. John responded to my reference to “John hunters little exercise in data exclusion” in a way that clearly indicated that he felt he had been accused of something akin to a lifetime of serial paedophilia. But the essential and uncontested fact remains that data for 1840 was excluded. It is the reasons for doing so that has been under question.
And it is worth reflecting that John has not so much been his own worst enemy but, rather, his own unhelpful ally. In defending what he regarded as an unjustified slur on his professional standards, he was not reluctant to jump to conclusions of his own in respect of my grounds for making that statement. I didn’t help by not being more specific about my recollection of John Daly’s substantial earlier input which left me with the clear conclusion that the matter remained unresolved.
And John has demonstrated a number of times in this thread that he doesn’t mind impugning other people’s intellect and ethics, and is even willing to question the sanity of someone on the basis of a short exchange of emails. He also showed a tendency to bail out of particular corners, like Capt. Ross-Clarks reference to the mark as being MSL for 1841, with claims that it had all been dealt with elsewhere. And there were other elements of his MO that indicated to me that we needed to keep checking.
On balance I do not think he has absolutely proven his case for excluding the data but there is obviously room for the benefit of the doubt. And accordingly, I have no problem in withdrawing any adverse imputation that might have been drawn from my original statement.
If John Daly has not uncovered the full story, for what is clearly a very small part of the whole sea level picture, then it must be seen in the context of the broad range of issues he was attempting to deal with and the extent of the outrageous climate extrapolations that were being tossed about without scrutiny in 2003/4. Robin Williams was flogging his 100 metre sea level rise and Greenland was going to first, collapse and second, cause New York to freeze over. Anyone who raised the slightest doubts about these preposterous inconsistencies was pilloried. So when confronting that sort of work load, if John Daly didn’t make a few interpretation errors then he would have felt that he wasn’t trying hard enough.
And compared to what others in the climate industry have to answer for, John Hunter could be accused of being a touch over sensitive.
10
And for the record,the reason for my continued doubts rest on the fact that the mark was apparently in use six months prior to the mark actually being made. The mark was made on 1 July 1841 but the new data set begins in December 1840.
I have been constrained in this whole exercise over this last week by the need to complete my article for Quadrant on the Murray mouth flows. See http://www.quadrant.org.au/blogs/doomed-planet/2011/12/has-it-worked
10
KinkyKeith, Ian, could I ask that we remain civil? I have several more questions I’d like to ask John but I do not have time to type right now. This is a unique opportunity to learn.
I’d be disappointed if John lost patience. I think we can show good manners to our guest even if we disagree.
Thanks in advance.
10
I ‘m with you Mark. We can all learn from polite exchange of views and insights.
A question I have for John is how is it that gauges only a short distance apart can show such wildly different trends over identical time spans? I’m speaking of Hobart and Spring Bay. And John’s points 1 and 2 re Fort Denison are a given.
Ken
10
Sorry MarkD, but I don’t see anything uncivil in what I have said above.
10
Sorry Mark & Ken if I seem to be a little “incivil”.
As soon as I started reading the posts it became obvious that the end result would be that we, the human CO2 excreters, have caused threatening Global Sea Level rises.
This was confirmed in a recent post.
There is no evidence or scientific theory which could show any mechanism by which the human component of world CO2 could affect the sea level changes claimed. There are quantitative aspects of the analysis which fail the theory miserably.
I find the attempt to exclude information that puts doubt on this theory but to push anything which will confirm man made sea level rise as a bit lop sided scientifically.
The very fact that John says “Over the past 7,000 years ice-equivalent eustatic sea level has changed by over 6 metres.” points to another “quantitative” issue, namely, that there are other effects beside man Made CO2 which can and do interfere with the “evidence”.
The core issue of the quantitative effect of man made CO2 on sea levels must be demonstrated scientifically as being a possibility before we get too worked up about trying to separate its presence from all the chatter.
All that we have at the moment is that water vapour and natural origin CO2 are the predominant greenhouse gases which may influence energy/heat residence times in the atmosphere.
Human origin CO2 has inconsequential quantitative input to world sea levels.
While I appreciate discussion on points of science (Lamprierre ) the main issue that sea level measurements do not give evidence of man made causation. All they do is show that the crust is moving, the Earth is shrinking, the moon and sun are exerting periodic gravitational effects etc.
Association with CSIRO or IPCC does not provide proof, that is obtained by use of hypothesis, measurement and confirmation (dis confirmation).
10
KinkyKeith:
I don’t have the time to counter all the erroneous statements in your post – which would be hard anyway as you mainly provide bald statements like “there is no evidence or scientific theory which could show any mechanism by which the human component of world CO2 could affect the sea level changes claimed” – it would most of a day to provide all the refutations of this.
However, you come to the crux of the matter in your last sentence, which says:
“Association with CSIRO or IPCC does not provide proof, that is obtained by use of hypothesis, measurement and confirmation (dis confirmation).”
There is a huge difference between the “CSIRO” and the “IPCC” – the first is a government research organisation and the second is a “Panel” which regularly (on a roughly 5-year time scale) organises a comprehensive review (by many climate scientists) of what is known about climate change, of which one aspect is the “Science” (WGG1 report). Unless one subscribes to a massive conspiracy theory (as I’m sure you do), most people would take what the IPCC reports say as being a pretty good reflection of the science – they wouldn’t need to go out and do the “hypothesis, measurement and confirmation” themselves (which I assume you do to check the theory of hydrodynamics before you get on a plane).
Let’s hear it from you clearly: do you believe there is an international conspiracy involving the majority of climate scientists?
10
I believe that many “Climate Scientists” ie. Environmental Science people have little very basic science skills that are the prerequisites for accurate analysis of the relationship between CO2 atm Total, CO2 atm Natural and CO2 Human Origin and the Earths “Greenhouse” effect and consequent? ocean rise.
John I believe you are well versed in the topic of ocean levels but I can’t see any evidence that you have any comprehension of how much effect any level of CO2 , let alone the puny human contribution, can cause substantial ocean level rise.
Basic Physics and the quantitative analysis of the greenhouse effect show that human origin CO2 is inconsequential in the atmospheric temperature balance.
You just can’t escape the basic science no matter how much you dress it up.
Both the IPCC and the CSIRO (once a great organisation) are discredited.
10
OK KinkyKeith: tell us your academic qualifications, specifically as they relate to the radiative forcing of CO2 and its effect.
And, if you were actually an “honest broker”, you would tell us who you really are.
10
John
My two degrees are sufficient to deal with the very basic concepts involved in isolating the human CO2 effect from the Greenhouse effect.
It is small.
If we really want to prevent global warming the first step would be to de-humidify the Earths atmosphere.
Having a PhD doesn’t change that but it does make it more difficult for the Warmers to see the big picture.
Also, incorrect modelling, and I am qualified here, does not trump real physics.
10
KinkyKevin:
You are prevaricating – what exactly are your degrees in, and at what level, and what is your expertise in atmospheric or climate science?
> It is small (i.e. the human-induced Greenhouse effect)
Can you quantify this and give your calculations, please?
> If we really want to prevent global warming the first step would be to de-humidify the Earths atmosphere.
And how would you do that?
10
“”And how would you do that? “”
Wrong answer.
The whole point is that by dehuidifying the air you woulld save the world from incineration.
Human CO2 abstinence has NO effect on world temp.
You have NO idea what you are talking about .
You are an exopert in sea levels and since you don’t acknowledge the head of the IPCC sea level group (Nils Axel) I assume you are a dedicated warmer not focused on the science.
Sad day for science.
10
“”And how would you do that? “”
Wrong answer.
The whole point is that by dehuidifying the air you woulld save the world from incineration.
Human CO2 abstinence has NO effect on world temp.
You have NO idea what you are talking about .
You are an expert in sea levels and since you don’t acknowledge the head of the IPCC sea level group (Nils Axel) I assume you are a dedicated warmer not focused on the science.
Sad day for science.
10
> “”And how would you do that? “”
> Wrong answer.
No – it is actually a question – one of those things you are most reticent to address.
> You are an expert in sea levels and since you don’t
> acknowledge the head of the IPCC sea level group
> (Nils Axel) I assume you are a dedicated warmer not
> focused on the science.
Nils Axel Morner isn’t, and never was, “the head of the IPCC sea level group”. If you think he is/was, then please provide your evidence for us all to see. If you knew anything at all about Morner you would know that he spends much of his time disparaging the IPCC.
10
Hi John
“” Morner …. spends much of his time disparaging the IPCC.”
Since he left it, like so many principled scientists whose work was “edited” and distorted by the politicians at the IPCC.
10
No KinkyKeith – read what I said – which was:
“Nils Axel Morner isn’t, and never was, “the head of the IPCC sea level group”. If you think he is/was, then please provide your evidence for us all to see.”
If you can’t do this, we will take it that you were wrong.
10
Hi John
I withdraw my comment about Morner being the former head of the IPCC.
I haven’t checked but accept your comment.
Sometimes, outside the basic science, I too can use hyperbole to engage in a discussion.
You may have become aware that my comments do not relate to your expertise in Ocean Levels and their variation.
What I have taken offense at is the attitude that because I am not associated with the Global Warming “Movement” via the IPCC or the CSIRO, that I am incapable of understanding the CO2 – Atmospheric temperature link.
I can assure you that I am uniquely qualified to understand attempts to model the Earth’s atmospheric thermal balance particularly wrt man made CO2.
The Global Warming “Machine” has brought science into disrepute and has antagonised real scientists with its patronising, deceitful attitude.
10
KinkyKeith:
Sorry – you have promulgated enough distortions and untruths in this thread and I am weary of correcting them.
Your latest one:
> What I have taken offense at is the attitude that because
> I am not associated with the Global Warming “Movement”
> via the IPCC or the CSIRO, that I am incapable of
> understanding the CO2 – Atmospheric temperature link.
I have never suggested that you should be “associated with the Global Warming ‘Movement’ via the IPCC or the CSIRO” – just that you be open about your qualifications in atmospheric or climate science (which you have singularly failed to be).
And why this continued fixation with CSIRO? Don’t you know the names of any international science organisations which accept the same fundamentals of climate science as CSIRO?
10
John, you have the typical preoccupation with “My PhD is bigger than your PhD”.
Surely we are here to discuss the science?
A long discussion on sea level measurement is great to see, I love science, but what I took exception to was the quoting of facts interspersed with comments about “civilization” and the inferences, scientifically unfounded, that the spread of the man made CO2 disease is bad for the planet.
We need to remove pollutants from the environment and at the moment China and India are polluting the hell out of the world and NOTHING HAPPENS to fix this.
Instead we have a scientifically preposterous notion of saving the world through CO2 sequestration????
I don’t understand this nor accept that we meekly “let it pass”.
The AGW myth is doing great harm in many areas including our education institutions.
10
KinkyKeith:
> So you think that 17 years from “1993 to 2010” is a good statistical
> sample?
You chose the period of “the last couple of decades” (post 97.2), and if you cared to read what I said in my respoonse (post 104), I said as a caveat:
“Records from single tide gauges which are only about 20 years long are not indicative of the long-term trend (due to interannual and interdecadal variability).”
I was simply showing that the Fort Denison tide gauge DOES NOT show a trend of 1 mm/year over the last couple of decades.
> Just for the record, do you believe that man is the cause of the Global
> Sea level rises occurring at this time and that therefore we need to
> limit CO2 output?
Of course – this is what the majority of climate scientists have found.
> Could you explain to me why you OMITTED the fall rate that should
> have been included from about 5,000 in?
> Or is it just embarrassing to have to include evidence of sea level
> falls?
You obviously don’t understand the difference between “ice-equivalent eustatic sea level” and “relative sea level”, which I explained in post 89. The numbers I was quoting are the former. The heights are from Kurt Lambeck’s work and the rates are from Stanford et al (2011 – reference given earlier). These show no “evidence of sea level falls”.
Ian Mott:
I’m not sure what your long discourse is really about (post 107), but you seem to be trying to withdraw from your original claims – yes?
> And for the record,the reason for my continued doubts rest on the fact
> that the mark was apparently in use six months prior to the mark
> actually being made. The mark was made on 1 July 1841 but the new
> data set begins in December 1840.
This is a non-sequitur if ever there was one. Just because there was tide gauge data, why does this mean that the mark was “in use”? Why on Earth do you make this new assertion? You still don’t seem to understand the meaning and implications of a benchmark.
> I have been constrained in this whole exercise over this last week by
> the need to complete my article for Quadrant on the Murray mouth
> flows.
Oh dear – so you write for Quadrant – enough said.
Mark D:
Thanks for that – I don’t need to agree with you but as least we seem to be able to discuss things rationally.
10
Ken Stewart:
> A question I have for John is how is it that gauges only a short
> distance apart can show such wildly different trends over identical
> time spans? I’m speaking of Hobart and Spring Bay.
I’m not aware of any “wild differences” between Hobart and Spring Bay – if there are any apparent ones, I’d strongly distrust the Hobart data, especially if it was prior to about 1989.
10
John:
Spring Bay 1991-2010- 3.2mm/yr
Hobart 1991-2010- 0.25mm/yr.
Ken
10
Ken: I wouldn’t compare the average trends (where did you get these trends?) – I’d compare the actual hourly values and see how they compare. This is one of the standard ways of validating tide-gauge data (i.e. looking for consistency with nearby gauges). When you do this, you see where the differences occur – often at a datum shift or some erroneous data – for example, there was a deliberate and significant change in the Hobart datum in 2006 – this may not have been addresed in the estimation of the Hobart trend.
10
OK, I can see the gap in October 2006, then no data from October 2007 to February 2009, so point taken. I wish you had mentioned this earlier when I asked about how reliable Hobart was! How much was the 2006 shift?
10
Ken:
The shift was quite large. Assuming that the local hydrographic datum is the same as the tide-gauge datum (which it should be), then the datum prior to 1/1/2006 was AHD-1.20 metres, and after 1/1/2006 it was AHD-0.83 metres (so the datum moved UPWARDS) (see for example http://www.ipwea.org.au/IPWEA/ClimateChange/UploadedImages/PDFS/Impacts%20III/Carley_SeaLevelRiseAndClimateChangeImpactsForPlanningNewHospital.pdf )
10
Gee Aye:
> I don’t know if his sanity can be inferred from this exchange
> but he is very evasive. Did you ever get to see his data or
> analysis?
Nope – zilch.
10
OK- I thought some of the assertions in his article were “interesting” – what about Lord?
Ken
10
Ken: Doug Lord has just analysed one long tide-gauge record – this, on its own, has very little bearing on where global-average sea level is going to be by the end of this century. It is pretty naive to expect to be able to extrapolate the trend from the last century and assume that it is going to be the same this century (as I’ve already shown with paleo data, extrapolating the trend from the past 2000 years would yield virtually no sea-level rise during this century or the next).
Therefore, the statement:
“Doug Lord examined 120 years of tidal data from Sydney Harbour, and found a 1 mm year on year rise which didn’t fit with the 900 mm rise projected by the Wizards of Climate Change at the Department”
is meaningless – the rate of rise from last century would not be expected to match the rise projected for this century.
Here are a couple of numbers to illustrate where we are at present:
Over the last two decades, the rate of global sea-level rise has been around 3 mm/year – few would dispute this figure (and I don’t know any climate scientists who would)
The projections of the Fourth Assessment Report of the IPCC give a rate of global-average sea-level rise of around 2 mm/year over the past two decades (NOTE that this is NOT just the overall rise over a century divides by 100 – the rate of rise is projected to accelerate during the century).
So the IPCC AR4 projections are actually SMALLER than the present observations – this is a FACT – you may dispute whether the projections are right or not, but you can’t dispute what they actually are.
10
With apologies to Rudyard Kipling.
IF
If world atmospheric temperature rose by 0.6 C degrees over the last 150 years from 1860 (maybe).
And if Greenhouse gases are the only cause of this rise (very debatable).
And if human origin CO2 is to be taken into account.
THEN.
Our part of the world’s green house gas effect is 0.0009 C degrees of the temperature rise of 0.6 C degrees. (calculated as a max).
The rest is nature.
Likewise we are responsible for 0.0045 mm of the annual 3mm ocean increase.
Over 100 years we would cause 0.45 mm sea rise.
Holy Crap Batman.
We’ve been had by the IPCC, WWF and many politicians.
The “revelation” above is simply confirmation of the real science.
When you quantify the “Green House” ( if I can use that term) effects:
• we have a major winner in Water
• followed by Natural produced CO2
• and way behind both in magnitude, Human Related CO2 struggling to make any visible impression on the system.
CCS and Carbon Abatement, Carbon Footprint, Responsible Energy and other catchphrases of
the Church of AGW may now be consigned to the sin bin where they belong.
10
The above is based on the following,
I feel it important to give examples of how the CO2 we produce really influences the climate and will use a very concrete example of a real measured period from our recent past.
Again.
With apologies to Rudyard Kipling.
IF
Active Carbon Dioxide Distribution is:
a. 98% of Earths ( active ) CO2 is dissolved in the oceans.
b. 2% of Earths ( active ) CO2 is in the atmosphere.
c. 97% of atmospheric CO2 is of Natural Origin.
d. 3% of atmospheric CO2 is Human attributable.
And
e. Atmospheric H2O is about 95% of the total greenhouse effect.
It would seem then that if we want to control CO2 levels we need to control three systems:
1. The oceans and 2. Water vapour 3. Natural CO2 emissions.
Logically the Atmospheric CO2 and Ocean origin CO2 interaction needs serious study and Human CO2 emissions are rendered insignificant by the shear weight of the Water GHG effect.
So the Total GHG effect is
1. Water about 95%
2. Total CO2 about 4% of GHG effect
3. Human proportion of CO2 is 3% of the above 4% or 0.12 % of all CO2 effect.
10
John
I see that you have acquired the interest of some sensible educated people.
10
That tends to suggest you know what you are talking about when it comes to measurement of sea level.
Stick to that.
Don’t postulate on the “cause” of sea level rises because IT IS NOT YOUR AREA OF EXPERTISE.
You are wrong in saying that man made CO2 is the cause of rampant sea level change.
If I had submitted the Models for CO2 linkage to Atmospheric Temperature that are used to justify the theory of man made global warming in my undergraduate degree I would have been given a FAIL.
All models, regardless of who pays for them, must have a measurable input factor and a measurable output factor. The Global Warming models FAIL this test.
10
KinkyKeith:
Your 4 posts of numerical diarrhea are good example of a standard contrarian tactic – the scattergun approach. You fire so much garbage in quick succession that the someone who doesn’t know about the subject might think that you actually know something. I am not going to waste my time on every point now, but will take each point in turn from the beginning.
> IF
> If world atmospheric temperature rose by 0.6 C degrees
> over the last 150 years from 1860 (maybe).
> And if Greenhouse gases are the only cause of this rise
> (very debatable).
> And if human origin CO2 is to be taken into account.
> THEN.
> Our part of the world’s green house gas effect is 0.0009 C
> degrees of the temperature rise of 0.6 C degrees.
> (calculated as a max).
Please indicate where these numbers come from (well actually, I know – you just cut and pasted them from another post – see below).
And please just answer two more questions. The first is from post 110.1.1 which you never answered:
Do you believe there is an international conspiracy involving the majority of climate scientists?
The second is:
Do you think the world’s climate scientists are so stupid as to have ignored a ludicrously simple argument just based on multiplying various proportions together?
(or perhaps they ignore it because it is just plain ludicrous – have you thought that might be a possibility? – but never mind – you’ll have your chance to prove your worth as we work systematically through your claims.)
OH AND BY THE WAY KINKYKEITH, CAN YOU EXPLAIN WHY YOUR POST 114.1.1 LOOKS UNCANNILY LIKE MaryFJohnston’s POST 158 at:
http://joannenova.com.au/2011/09/dr-david-evans-four-fatal-pieces-of-evidence/
ARE YOU ACTUALLY MaryFJohnston OR DO YOU SURVIVE ON A LITTLE CUT-AND-PAST PLAGIARISM?
You’re priceless …..
10
Hi John
Your outrage IS priceless.
Everybody who read MaryF some time back is aware that I was MaryF.
If you look hard enough you will find that I explained the move to a new blogg name very openly.
This really is priceless and a classic example of the Straw Man;
being accused
of
plagiarising
MY OWN WORK.
Ha ha ha ha ha ha
Hilarious.
It was ALL my own work, a unique view of the subterfuge of the Global Warming Movement.
10
“”OH AND BY THE WAY KINKYKEITH, CAN YOU EXPLAIN WHY YOUR POST 114.1.1 LOOKS UNCANNILY LIKE MaryFJohnston’s POST 158 at:””
Ha ha ha ha ha ha
10
And I suspect there will be attempts to say I copied someone else.
Unfortunately there are copies of this outline “IF” that predate recent Blogg Topics here so it is my own arrangement and thinking.
A cheap and effective way of disposing the AGW scare.
10
KinkyKeith:
> A cheap and effective way of disposing the AGW scare.
“Cheap” is certainly the correct word here – otherwise, the rest of the sentence, and what it describes, is drivel.
As I said above, I am weary with correcting your mistakes, and asking you questions which never get an answer. In addition, I abhor the common web practice of anonymity – if you haven’t got the courage to be open with your name then you haven’t got much courage, full stop. And if you play games by having multiple names on the same blog, that is another good reason to be finished with you.
Sorry – stay happy in your delusions but don’t expect me to encourage you.
10
John- perhaps you could be a real help by telling me (or pointing me to where I can find) : the reliability (and since when) of pre- 1991 data from each of the 18 sites in the table in the main part of this post;
Also, I would like to continue discussion with you on sea level from time to time, not in the near future, including seeking your critical advice on some ideas I’m working on (to do with sea levels in the past 6000 years) outside this forum. Is there another forum/ means of contact? I won’t be offended if you say No. (Too bad if I am!)
In your view I may be a “contrarian” but I’m not a nutter- I’m a genuine seeker of truth with a respect for observable data.
Ken
10
Ken: I’ve cleaned up most of these records for use with our decision-support tool at http://www.sealevelrise.info. However the cleaned-up data isn’t at the moment publicly available (before the vultures swoop on what they think is a tasty morsel, the reason for this is simply that most of the records were collected by port and marine authorities who own the data – these authorities currently place restrictions on the supply and use of the detailed (hourly) data, which are the records which I cleaned up). The monthly and annual data which is mostly used for trend estimation may contain some of the errors that I unearthed in the hourly data. The best thing for you to do is to go through the data point by point, and also to compare each gauge with its neighbours. I know this doesn’t sound very satisfactory, but you have to remember that most of this data wasn’t collected for science purposes and therefore isn’t as good as we would like. When scientists use this data, they generally clean it up and produce their own “private” sets. Also, these “private” sets will not necessarily be appropriate for use by others – it depends on the ultimate use. For example, if you are interested in tidal phenomena, you will be careful to correct any timing errors, or else remove the offending data. If you are interested in extremes associated with storm surges, you will remove the tsunamis.
Yes – you are welcome to contact me at [email protected]
10
So now , this is copied and is someone else’s work.
Oliver K Manuel:
“Hopefully we will soon see a world-wide collection of barefooted politicians and scientists explaining the 40-year history of this global climate scandal”:
For too long “Climate Scientists” have relied on the creation of “Computerised Projections” which they have mistakenly or wilfullness called “Models”.
The purpose of real modeling is to examine and measure real factors at both input and output levels.
Models allow that a multivariate system where most of the factors are irrelevant can be treated as a “black box” with only measurements of the target inputs and outputs.
Modelling does not allow for the exclusion or dismissal of relevant factors from consideration as happens with Global Warming “modelling”.
eg The dismissal of atmospheric water vapour from the active greenhouse gas list or the creation of a mythical open ended “Water Forcing”.
Unreality hiding inside a $2,000,000 computer and the driver saying: “if only we had a bigger computer we could find the answer”.
Yes of there would need to be indefinite tenure of position to go with the new computer.
10
Hi John H
I must respond to this slur on my scientific acumen.
I have already indicated that I would defer to your apparent expertise in sea levels assessment but when you say :
” Sorry – you have promulgated enough distortions and untruths in this thread and I am weary of correcting them” the exchange is not to be left there.
The assessment of the place of Human Origin CO2 in the Global Warming scenario is not really that complicated.
The biggest problem most people have is the deliberate confusion created by Global Warming proponents and the , mostly, childlike belief that the Human CO2 effect is omniscient in the determination of world atmospheric temperatures.
In this area of science I am certainly more qualified than most and especially more qualified than almost ALL Climate Scientists.
I am NOT a skeptic.
To be a skeptic you need something to be skeptical about and the idea that Human Origin CO2 can in some way control the Earths atmosphere is laughable.
10
Ken Stewart said:
“In your view I may be a “contrarian” but I’m not a nutter- I’m a genuine seeker of truth with a respect for observable data.”
KinkyKeith said:
“….. the, mostly, childlike belief that the Human CO2 effect is omniscient in the determination of world atmospheric temperatures.
In this area of science I am certainly more qualified than most and especially more qualified than almost ALL Climate Scientists.
I am NOT a skeptic.”
From the conversations I have had with you both, I think it is pretty clear that Ken is a genuine skeptic and not a contrarian. And KinkyKeith is correct when he says that he is not a skeptic – he is demonstrably the contrarian and the nutter.
10
Hi John
Go to your own website the ACE page with sub headings”
Our Research
Antarctic Ice Sheets
Antarctic Sea Ice
Ice Cores
Ice Shelves
Southern Ocean Circulation
Southern Ocean Carbon Sink
Ocean Fertilisation
Ocean Acidification
Ecosystems Impacts
Sea-Level Rise Impacts
Climate Futures
Research Utilisation
How much of that stuff is dispassionate science and how much is worded to comply with the requirements of the current paradigm of man made global warming.
For example, is the ocean “acidic” and getting more acidic or is it “alkaline” and becoming less alkaline “IF” man made CO2 gets too active?
I personally would like to see our governments invest more money to explore alternative energy systems. At the moment we have a politically driven research and investment “dogs breakfast” whose prime aim is to sequester votes from a particular group of voters.
The interests of science or the national interest is of no concern to politicians.
The huge amount of money going into the global warming vote gathering machine would, in my opinion, be better used for pure research into energy systems.
You criticise my comment “….. the, mostly, childlike belief that the Human CO2 effect is omniscient in the determination of world atmospheric temperatures.” presumably because you believe it to be wrong. I recently spoke to two very smart fellows in their mid thirties who work for CSIRO. Both work in climate science related areas but I don’t want to describe their work in detail.
The point I want make is that while both have PhDs they were both unaware of a vast body of relevant material that impacted on the CO2 – temperature paradigm. They were completely focused on their own work space and relied absolutely on other experts for the “truth” or “confirmation” of the man made via CO2 concept.
They were the people I had directly in mind when I wrote the comment you took exception to.
The truth is out there somewhere , it’s just that people are not going to go looking for it while they feel comfortable in a group that gives them all they need.
10