
The Daily Telegraph exposed the NSW state government protecting the world from some dangerous scientific analysis of sea-levels. The officials pulled papers and posters within days of when they were due to be released, late in September 2011. Doug Lord examined 120 years of tidal data from Sydney Harbour, and found a 1 mm year on year rise which didn’t fit with the 900 mm rise projected by the Wizards of Climate Change at the Department. He finds the official figures exaggerate ten fold.
Ken Stewart has taken the dangerous data from 19 sites around Australia and finds it averaged 1.4 mm/year over the last 100 years. He finds about an 8-fold exaggeration. This is another sordid tale in the Science-perverted-for-PR category.
Sea Level Change in Australia: What’s Likely?

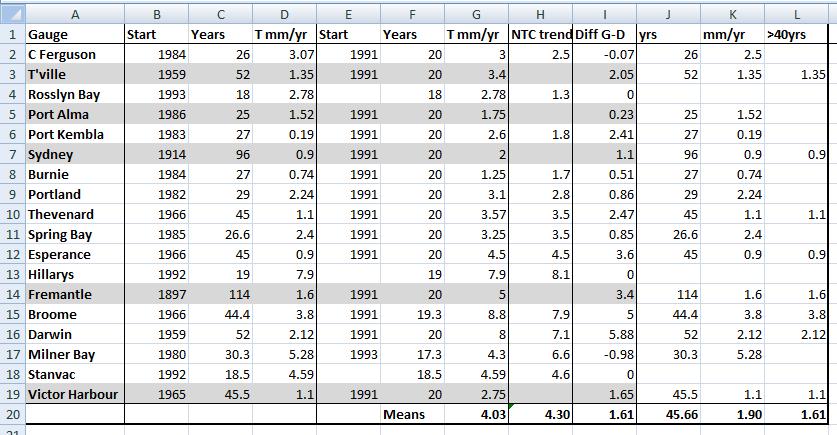
The mean sea-level rise recorded at 19 stations around Australia (warning, data is limited in the first half of the series). The trend is a steady rise. The last 20 years is not unusual.
Seas have been rising in a reasonably continuous trend around the world since 1800. The last two decades are not unusual.
The particular 19 sites are listed below (click to read). The longest continuous one is at Fremantle from 1897, then Sydney from 1914. The pre 1965 data is extremely sparse.
...
The last 20 years has seen a rapid rise but the steepest trendline around Australia was from 1938-1957 which was around 4.5mm/yr.
The west coast water is either rising faster or the land is sinking faster…. but on the East Coast, things are slow.

...
There’s a multidecadal cycle under that trendline
Playing with start dates shows the folly of making very much from 20 year trends. There is so much decadal variation that the start year affects the results greatly, which makes a mockery of bothering to put in that second decimal place. If we start in 1991 the trend is 3.8 mm/yr. But take that back to 1988 and we get 2.3 mm/yr, or 2.6 mm/year from 1987.
Ken points out their deceptive trick to help everyone feel the fear.
Officials talk of 3 mm a year being unusually fast: “ These rates of increase are an order of magnitude greater than the average rate of sea-level rise over the previous several thousand years. … but by averaging the long rise over seven thousand years, and pretending there are no other cycles, they can calculate an “average” which is meaningless. Sea level has risen and fallen and we are wandering in the dark, handcuffed and with blindfolds on, if we try to stab at say, the rate of sea level rise in twenty year periods from any period prior to 1900. Let’s pick the mean sea-level rise around Australia from 961 – 981. Was it faster? Who the heck knows?
Bottom Line:
20 year trends are dubious, but we don’t have enough data for certainty on seriously long frames that we need to avoid confounding things with the decadal cycles. Sea levels around Australia appear to be rising at about 2mm a year, and that’s nothing like the 12 mm required to get a 1 m or more rise by 2100. There is no acceleration. Things are not getting worse.
Nothing lines up with the theory that our emissions of CO2 are the main cause global warming, and our government officials are trying to keep that information from us.
See all the permutations and combinations of graphs on Australian sea level at Kens site.
Sea Level Change in Australia: What’s Likely?
PS: Thanks to the lady who rang in September to let me know about the papers being pulled. I’m sorry I didn’t have the resources to follow this story. I’m very glad the Tele did. It deserves to be told.
PPS: Has NOAA disappeared the four sites that Phil Watson used around Australia?
A comment came in from Fred Love to a different thread before this was posted. Can any one follow this up? Is this true? Were they included before?
Fred Love writes: No-one seems to have yet picked up that NOAA (Tides and Currents) has “disappeared” Fort Denison, Newcastle, Fremantle and Auckland following the publication of the Watson paper on Sea Levels. Australia is now “represented” only by Bundaberg and Townsville from mid 1960′s.
Related posts:
- Australian sea-levels respond to CO2 by slowing down…
- 10% of sea level rise is due to land rising too. Got that?
- Shock! Climate models can’t even predict a linear rise
- South Pacific sea levels – Best records show little or no rise?!
Image: Falcon Bay near Mandurah SW Western Australia. JoNova.
H/t To Fred in comments “fell the fear” typo fixed! jo