| Oceans are critical to proving that humans are having an impact on the climate.
The big scary number of the week is 15 × 1022 (or 150 million quadrillion). It’s the number of Joules the ocean has apparently heated by since 1961. But convert it to degrees per year and suddenly the big scary 15 × 1022 becomes three thousands of one degree per year. Unmeasurably small. So realists everywhere, lets check the math, and get ready to spread the word. Everywhere you see the ocean heat capacity argument or graph, let people know the numbers just don’t add up. THIS POST HAS BEEN UPDATED SEE HERE FOR THE LATEST FIGURES. … |
|
The developing Bumper Sticker Message to cut and paste is:
15 × 1022 Joules since 1961 = 3 thousandths of a degree warmer per year. Who cares?
… Below Michael Hammer goes through the calculations he started on the comments thread for “Ocean temperatures: The new bluff in alarmism.” Essentially he confirms Kininmonths numbers and calculates:
Yes the numbers below are not easy reading, but this is worth sorting out. This is a joint posting with Jennifer Marohasy, so for those interested in her view and more analysis check there too. Thanks to Michael for his dedication in doing the maths. I will update the numbers if we make any further advances in calculations so check back here. If CO2 is warming our planet, why can’t we find the heat? Cheers! JoNova |
A Climate Change Paradox
Guest Post By Michael Hammer
AUSTRALIA’S Minister for Climate Change, Penny Wong, recently suggested that most of the global warming since 1960, about 85 percent, has happened in the oceans and that change in ocean heat content is thus the most appropriate measure of global warming.
But, calculating from first principles, according to this data the oceans have absorbed far less energy than the IPCC estimates for the impact of rising carbon dioxide levels. While the government data suggests a warming rate of 0.38 watts/ m2 the IPCC data suggests a warming rate of 3.6 watts/ m2. This is a significant discrepancy of nearly 10:1 3:1 and needs to be resolved. If the oceans really are the major heat sink for the planet where is the rest of the energy going? Alternatively, is the error in the IPCC estimates.
THIS POST HAS BEEN UPDATED SEE HERE FOR THE LATEST FIGURES.
Here’s my logic:
On June 24, 2009, the Minister for Climate Change posted a ‘Response to Senator Fielding’s questions about the climate change science’.
This article included the above graph and comments reproduced below. The straight red line on the ocean heat content graph, however, is my addition and was not part of the original article. The line was placed by eye and is not claimed to be a least squares line of best fit.
The quoted items below are taken from the Minister’s website.
“In terms of the climate system as a whole, only about five percent of the warming since 1960 has taken place in the air.”
“Most of warming since 1960 (about 85 percent) has happened in the oceans. Thus, in terms of a single indicator of global warming, change in ocean heat content is the most appropriate.”
“The change in ocean heat content since 1960 is shown in the figure below. Note the significant warming trend since 1998.”
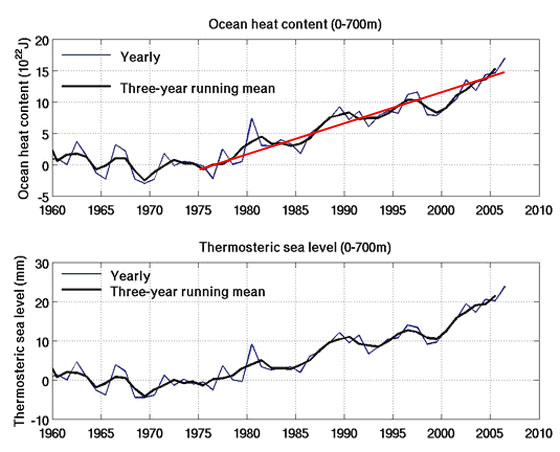
I note that the graph is labeled ocean heat content which cannot be correct given that the value is shown as zero prior to 1975. However the text suggests it is actually change in ocean heat content which would seem reasonable. I have assumed that to be the case.
The graph shows that over the last 30 years the oceans have absorbed 15×1022 joules of energy and as the red line shows this has been very close to linear over that time. Using a linear approximation implies the oceans have absorbed about 15×1022 / 30 or 5 × 10²¹ joules per year.
How does this compare with the claimed degree of global warming from rising carbon dioxide – expressed in watts / m2. Convert ocean warming first to watts = joules per second. There are 60 × 60 × 24 × 365 seconds per year = 3.15 × 10⁷ seconds per year. So the oceans are absorbing 5 × 10²¹ / 3.15 × 10⁷ joules per second = 1.6 × 10¹⁴ watts.
Now to get watts / m2 we need to divide the watts by the surface area of Earth. The Earth is a sphere of radius 3960 miles = 6336 km. Its surface area = 4 × pi × radius2 = 5 × 10⁸ sq km (Wikipedia quotes 5.1 × 10⁸ sq km). Since there are 106 m2 per km2 this equates to 5 × 10¹⁴ m2. Thus the oceans are absorbing energy at the rate of 1.6 × 10¹⁴ / 5 × 10¹⁴ watts/ m2 which equals 0.32 watts/ m2.
The article states that 85 percent of the warming has taken place in the oceans which would seem to be saying that 85 percent of the retained heat due to AGW is being stored in the oceans. From this it follows that the total retained heat is 0.32/0.85 or 0.38 watts/ m2.
The Intergovernmental Panel on Climate Change in their 4th assessment report (summary for policy makers) claim (page 12, 4th bullet point) that “…..global average surface warming following a doubling of carbon dioxide concentrations. It is likely to be in the range 2 to 4.5°C with a best estimate of about 3°C”.
Now to get a 3°C rise at the average claimed emission temperature (255K) requires an additional energy input (additional energy retained by greenhouse gases) of 11.3 watts/ m2. This assumes the 3°C is an equilibrium level. If it is not then the retained energy must be still higher so the 11.3 is a minimum figure.
The ocean heat graph from the Minister ends in 2006. According to Mauna Loa data in 2006 the carbon dioxide concentration was 383 ppm which represents 0.45 doublings and hence an increase in global warming retained energy of 11.3 × 0.45 = 5.1 watts/ m2. Not all of this represents energy absorbed by the planet because of the claim that the planet has warmed. This warming will increase the energy radiated back out to space.
The Climate Research Unit at the University of East Anglia shows the claimed warming in 2006 was 0.4°C. SkepticalScience.com shows temperature rise graphs from three sources and all show about 0.4°C temperature rise in 2006. Using the same claimed effective emission temperature as above (255K), a rise of 0.4°C will increase emitted energy by 1.5 watts/ m2. Thus the net additional energy retained by Earth will be 5.1 – 1.5 = 3.6 watts/ m2.
This presents a considerable conflict. Ocean heat assessment suggests earth is gaining energy at the rate of 0.38 watts/ m2 while carbon dioxide analysis suggests the rate is 3.6 watts/ m2. This is a difference of nearly 10:1 in two different analyses of the same quantity. Both cannot be right.
I note that the Minister specifically draws attention to the “significant warming trend since 1998”. This could be taken to mean a claim that the linear slope does not apply.
This is a somewhat risky assumption since there are other periods where the slope is well above the slope of the red line. None the less, using the local slope over the years since 1998 corresponds to about 8.8 × 10²¹ instead of the average of 5 × 10²¹. That would make the retained heat in the oceans about 0.56 watts/ m2 for a total retained heat of 0.66 watts/ m2. This is still 5.5 times lower than IPCC claim for the impact of carbon dioxide. Also, if we accept the higher slope since 1998 it means the average ocean energy absorption over the earlier years is reduced to 8 × 10²² joules over 23 years corresponding to 0.22 watts / m2. Since the carbon dioxide concentration from the Mauna Loa data in 1998 was 366.6 ppm this represents 0.39 doublings equivalent to an additional 4.4 watts / m2 or about 3 watts/ m2 after allowing for temperature rise making the discrepancy over those years worse (3 vs 0.22 is a ratio of 13.6:1).
What the Minister’s own data shows is that the oceans have only absorbed between about 9 and 14 percent of the excess anthropogenic global warming energy implied by IPCC data. Yet they claim the ocean absorption represents 85 percent of this energy. The oceans are by far the biggest heat sink on the planet. If they are only absorbing at most 14 percent of the excess energy it is extremely difficult to see where the rest of the energy could be going.
Could the error be in the ocean heat content – maybe the exponent should be 23 not 22? Oceans cover 70 percent of the Earth’s surface or 3.5 ×10¹⁴ m2. If the energy is spread over the top 700 m as the graph caption states, the volume of water is 3.5 × 700 × 1014 = 2.45 × 10¹⁷ m3 . Water has a thermal capacity of 4.18 million joules per degree per m3. Hence the 15 × 1022 joules will raise the surface ocean temperature by 15 × 1022 / ( 2.45 × 1017 × 4.18 × 106 ) degrees = 0.15°C (This by the way is exactly the same result as Bill Kinninmonth cited in his email to Professor English). This result assumes the energy is distributed uniformly throughout the 700 meter depth. If it is concentrated near the surface the rise would be higher. To match the IPCC predictions the energy absorption would have to be 5.5 to 10 times higher suggesting an ocean temperature rise of at least 0.8°C to 1.5°C over the last 30 years. No such rise has been reported.
It would seem that the only plausible alternative left is that the error is in the IPCC estimates and that the current value should be about 1.5 + 0.38 = 1.88watts/ m2 (additional energy radiated plus rate of energy storage in the oceans). If so by 2070 the additional energy input over today would be 1.88 × 0.55/0.45 = 2.3 watts / m2. (We have had 0.45 doublings with a further 0.55 to go by 2070).
Such an energy rise at equilibrium would give an additional temperature increase of 0.6°C. This is of course if we assume that the currently claimed temperature rise is correct and is all due to carbon dioxide.
So many assumptions and such a paradox!
Michael Hammer,
Melbourne, Australia


I’m confused by “Now to get watts / m2 we need to divide the watts by the surface area of Earth. The Earth is a sphere of radius 3960 miles = 6336 km. Its surface area = 4 × pi × radius 2 = 5 × 10⁸ sq km (Wikipedia quotes 5.1 × 10⁸ sq km). Since there are 106 m2 per km2 this equates to 5 × 10¹⁴ m2. Thus the oceans are absorbing energy at the rate of 1.6 × 10¹⁴ / 5 × 10¹⁴ watts/ m2 which equals 0.32 watts/ m2.” is 1014 actually 10 to the 14, and the superscript has not come through?
20
Genuine question… The 700m depth only covers about 1/7th of the volume of the ocean (4-5km average depth depending on sources I’ve dug up). Does that not leave 6/7th of the ocean not covered by the graphs. As nominally an undergrad qualifed environmental engineer from a centre for water research I could make a call or two tomorrow to make sure this is not an insane question due to the complex nature of ocean circulation… but what the heck.
20
[…] This article has been cross-posted at Joanne Nova: http://joannenova.com.au/2009/07/06/the-antidote-to-150-million-quadrillion-joules/ […]
10
Lastly – everywhere I search has similar graphs all starting at 0, which you claim can;t be correct. Obviously you are correct heat content was not zero in 1960… but it does suggest to me that you are new (as am I) to the terms being used. Which implies you are approaching this with essentially zero background in ocean heat… which suggests to me that regardless of whether I can explain why you are wrong, well my gut skeptical instinct tells me you are wrong. There appears to be mountains of peer reviewed literature, and thread after thread of blogosphere comment on warmins and skeptical sites about ocean heat content… they all use these graphs and the information in them, and none of the complaints seem to be that the basic order of 10 x 10^22 is an issue… even the work that claims ocean cooling is suggested by the Argo buoys is not worried about the basic order of magnitude.
Just as an example: http://bobtisdale.blogspot.com/2009/05/levitus-et-al-2009-ocean-heat-content.html
So again I appreciate the explanation of your logic, but my hunch is you are missing something critical here, and if not then journals will lap up your papers with glee. If you are missing something I’m sure the journals you try to publish in (even E & E) will show you the flaws in the logic.
10
The scary 15 × 10^22 Joules reminds me of a sign I saw in a university physics building during the 1950’s: “Caution 100,000 Meg ohms”.
Big numbers can be scary simply because they are big numbers. However, as in the case of the big number of Joules we have to consider full context. A Joule is a tiny amount of energy = one watt second. Or in more common terms, one Joule is one hundredth of the energy a person can receive by drinking a drop of beer. We also have the context that its supposedly the amount of energy absorbed by a huge ocean. Hence the final result the ocean was warmed 3/1000 of a degree per year.
10
Ok so Lastly was a lie… but this is a useful pieve at WUWT: http://wattsupwiththat.com/2009/05/06/the-global-warming-hypothesis-and-ocean-heat/
now while it deals with Loehle, and Pielke, well I just can;t fathom that WUWT has missed what this post cites as a signifncant factor of 10 issue.
Key bits: “Radiative Imbalance. The IPCC and GISS calculate the global mean net anthropogenic radiative forcing at ~1.6 W/m2”, and then…. “Physically, the climate system responds to the entire 1.6 W/m2 forcing, not just a portion of it. But while energy is being absorbed, it is also being lost by radiation. The radiative imbalance is better described as the difference between the global mean net anthropogenic radiative forcing and its associated radiative loss. The global radiative imbalance of .75 W/m2”
so the “claimed” radiative imbalance is .75W/sqm…. of which 80% is in this upper 700m of ocean (according to WUWT)…. = 0.6W/sqm
which is quite close to your 0.38W/sqm give or take a few backs of a postage stamp.
Now my conclusion is your error lies in using IPCC values for the total climate forcings due to feedbacks etc, not just the radiative imbalance.
10
You’ll also note the WUWT paper shows that deep oceans only take about 14% (despite being 80% of the oceans)… so makes a 14% difference, but not the extent I suggested may be the issue in post 2. Good tennis game yeah?
10
There are some obvious and very large conversion errors in Michael Hammer’s guest post.
He stated that:
“Now to get watts / m2 we need to divide the watts by the surface area of Earth. The Earth is a sphere of radius 3960 miles = 6336 km. Its surface area = 4 × pi × radius 2 = 5 × 10⁸ sq km (Wikipedia quotes 5.1 × 10⁸ sq km). Since there are 106 m2 per km2 this equates to 5 × 10¹⁴ m2. Thus the oceans are absorbing energy at the rate of 1.6 × 10¹⁴ / 5 × 10¹⁴ watts/ m2 which equals 0.32 watts/ m2.”
Wikipedia — correctly — shows the surface of the Earth to be 510,072,000 km². It follows that the ocean surface is about 0.71 x 510,072,000 km² or 362,151,120 km².
There are not “106 m² per km²” but 1 x 10^6 m² or 1 million m² per km².
That is probably the source of the error made by Michael Hammer — simply but importantly a misreading of engineering notation for 1 million; an incorrect substitution of 106 for 1 x 10^6, or 106 m² for 1 million m².
As that error involves about four orders of magnitude, Michael Hammer will most likely want to correct his calculations accordingly.
10
Hi Walter, Thanks for drawing my attention to that paragraph. Both Jennifer Marohasy and I had inadvertantly lost the superscripts on that patch of text. Michael’s original word document reads:
“Now to get watts / m2 we need to divide the watts by the surface area of Earth. The Earth is a sphere of radius 3960 miles = 6336 km. Its surface area = 4 × pi × radius2 = 5 × 10⁸ sq km (Wikipedia quotes 5.1 × 10⁸ sq km). Since there are 106 m2 per km2 this equates to 5 × 10¹⁴ m2. Thus the oceans are absorbing energy at the rate of 1.6 × 10¹⁴ / 5 × 10¹⁴ watts/ m2 which equals 0.32 watts/ m2.”
A gremlin stole the superscripts out of this para. I have corrected the post. Thanks! 106 really was originally 10^6. (And no, I can’t explain why the superscripts from other paragraphs survived the transition for MS word to wordpress.)
10
And Thanks Matt, who I see correctly spotted the problem first.
Yes 1014 was 10^14 or 1014
And if anyone can be bothered (because it is easier to read) the html code in comments for superscript is 10<sup>14</sup>.
And subscript, surprisingly is CO<sub>2</sub> CO2
and no, it’s probably not cool to know that.
10
Something I like to point out with regard to ocean heat, is how much energy is coming from the Sun. The Earth receives about 1.09E19 joules per day from the Sun. The oceans comprise 70% of the planet and have an albedo of 0.05, meaning that 95% of the incident energy is absorbed by the ocean. Adding this all up, the oceans are taking in more than 718 joules per day, which is about 14K times more than the claim of CO2 related heat energy.
—–
UPDATE: 7-07-09 More accurate calculations:
PI*(6.3366)2 * 1366 * 3600 * 24 = 1.522 joules
-> total solar input per day
70% oceans
oceans have an albedo of 0.05 -> 95% of the incident energy is absorbed
1.522 * .95 * 0.7 = 122 joules/day of solar energy absorbed by the oceans each day
1522 joules of heat over 48 years -> 8.518 joules/day
ratio – 1/1168
This could be as low as 500 times, if we count clouds as blocking energy, but it’s still a lot. Of course, solar energy entering clouds eventually finds it’s way to the surface.
—–
A couple of other nuggets:
Energy content is measured as the energy it takes to raise the temperature of water from 0K. Relative to the ocean, what matters is the energy it takes to raise the temperature of water from OC because the only way for the deep ocean to drop below 0C is for it to freeze from the surface.
Energy is stored in the climate system (predominately in the oceans) in the form of equal and opposite pools of hot and cold, separated by an isotherm whose temperature is the average temperature of the Earth. While the energy in the hot pool (which is enclosed by the isotherm) acts to pull the average temperature up, the energy in the cold pool acts to pull average temperatures down.
The deep ocean is close to OC and solar energy is only stored in the top couple of hundred meters or so. Separating the deep cold and warm surface is the thermocline. If you examine the temperature profiles, the thermocline is acting as a layer of insulation between the deep pool of cold and the shallow pool of warm and there is little energy flowing between them. In fact, the energy flux flowing down is the same in magnitude, but opposite in sign, to the energy flux flowing up from internal heat (i.e. hot water rises). It like the convection currents in boiling water.
George
10
Water expands as it heats. There is a lot of water in the ocean, so it is possible that even a small amount of heating will have a significant effect on sea levels. Also, the oceans take a long, long time to absorb this heat. They will also take a long time to lose it, so once we see the ocean levels start to rise (and hopefully we will not see this), then the problem cannot be fixed quickly.
10
Matt Buckels; Joanne has already corrected the superscript issue you mention – Thanks joanne. With regrda to why only the top 700 metres. There is a transition at about that depth called the thermocline which separates the warm surface water from the deep cold water. There is relatively little transport across that thermocline since it represents a strong temperature inversion. Thus while the deep oceans do indeed store lots of heat the time constant is very long and the impact over 30 yuears is less than for the top 700 metres. (reports I have seen for the deep ocean time constants from AGW advocates is about 800 years).
With regard to the point that how could others not have noticed this issue, I can say that I have come up against this more than once in my working career and the outcome is almost always a very nice useful and valuable patent for my employer. The comment is really in the same vein as “if its such a great idea why hasn’t somneone thought of it before”. The issue, here is an argument and some mathematics. If its wrong, where is the error. If not then implications flow from it whether someone has thought of it before or not. In short the analysis stands by itself.
10
Walter Schnieder; the original text was correct, there was a simple conversion error as Joanne has noted. PLease check my maths using the corrected scientific notation and let me know if my maths is in error.
10
Roger,
You’re missing a key point, which is that only a tiny fraction of the ocean’s mass is involved with storing heat. Most of it’s mass is storing cold. While both heat and cold are forms of thermal energy, in the context of climate, heat is the portion of the Earth’s thermal mass above it’s average temperature and cold is the portion below.
The bulk of the energy stored in the cold pool is anchored to 0C at the bottom of the ocean. This is why the energy stored in the system should be relative to 0C and not 0K. The warm pool is not anchored to anything but the Sun, and it’s temperature adapts to the incoming energy. The average temperature of the Earth is then the average of these 2 energy pools.
The pool of cold is comprised of the ice caps, deep ocean and cloud tops, all of which are thermally connected. This connection becomes evident when you draw an isotherm, whose temperature is the average temperature of the Earth. This will enclose a flattened torrid around the equator, enclosing the warm pool, whose center seasonally varies between the tropics.
The deep ocean cold is insulated from warm surface waters by the thermocline, which is identified by stark inflection points in the ocean’s temperature gradient. The average temperature of the Earth is the temperature of the water in the middle of the thermocline. Another way to think about this is that since the bulk of the energy in the 2 pools is in the oceans, the middle of the insulating layer separating them would be the average temperature of the planet. The average temperature of the cold pool is about 4C +/- 1C, while the average temperature of the warm pool is about 28C +/- 1C, whose isotherms, as they pass through the ocean, delineates the thermocline.
Much of the solar energy entering the system is added to the warm pool (oceans absorb 95% of the incident solar energy) and leaves through the cold pool into the vacuum of space. The rest of the solar energy enters the cold pool (cloud tops and poles). Energy also leaks from the warm pool and out into space. The temperature difference between the pools drives a Carnot cycle heat pump manifesting weather whose action is to strike a balance between the energy pools by transferring energy between them. Similarly, ocean currents can be modeled as Carnot engines operating on the temperature difference between the pools which also acts to transfer energy between them.
This is a very dynamic system which responds much faster to change than the AGW hypothesis requires. Evidence of this fast response is found in the satellite data, which shows local ocean surface temperature variability responding to the seasonal changes in the incident energy with about a 45 day lag.
George
10
By way of comparison, World annual energy consumption is of the order 500 EJ (1 exajoule = 10**18 Joule)
of which approximately 300 EJ is derived from the combustion of fossil fules
At the present projected growth rate for energy demand, the value of energy quoted by Joanne is annual World fossil fuel energy demand over the next 150 years.
and Joule rhymes with fowl and howl and dowel and Jacoby James the wise old owl
10
only somebody from the DOE would know crud like that
10
I have a correction for post 11. The energy per day is 1.49E22 joules, where the oceans take in 9.8E21 joules/day which is over 1000 times larger than the CO2 related effect.
10
So sorry to correct your math, George.
Let x be a positive number.
Let m be the steady state heat effect from CO2.
Then xm=0 for any x
10
Guys, a big thank you goes out to Steve from http://www.globalwarmingskeptics.info/.
The star – he’s finally managed to get me that PREVIEW button on comments that we’ve been waiting for! I’m so pleased.
The power of a team of dedicated expert volunteers…
Thanks Steve 🙂
10
Glad to help.
Just give me a shout out and I’ll help you fight the fight against this absuridity.
10
Jo
You are doing a better job than I am at exposing this AGW nonsense.
Keep up the good work and if ANYONE needs help with their WordPress site, just email me.
10
Roger Pielke writes:
> I have written on the observation that the diagnosed heat uptake in the
> oceans is significantly less than the IPCC estimate of radiative
> forcing; e.g. see
> http://climatesci.org/2007/11/30/climate-metric-reality-check-1-the-sum-of-climate-forcings-and-feedbacks-is-less-than-the-2007-ipcc-best-estimate-of-human-climate-forcings/.
>
> Either the IPCC net forcing is in error and/or the radiative feedbacks must be negative.
> I hope these comments help.
10
BTW, the implication of post 18 is that a 0.1% increase in solar output will have the same effect as CO2, which it seems is catastrophic warming.
It’s the same old story, where scary big numbers are used while ignoring the even bigger numbers that aren’t scary.
George
10
Hi all, George has updated his estimates in #11. (I added them in just now). Let me know if I got something wrong George 🙂
So roughly: The energy the oceans takes in every day is 1000 times the amount of surplus that Team-AGW claims is what will cause catastrophic warming? Am I reading that right?
That sure is a fine balance if 1/1000th more energy can push us over a tipping point.
10
Joanne or anybody,
for reference as a discussion point
Please point to a “tipping point” of the natural climate that occured in the some 1 bn years for which a reliable record of geology can be discerned.
That is, any rapid and irreversible change of the climate that occured within a few years of the event responsible for some change (volcanoes, sun spots, etc).
10
Brian,
I’m aware of no such tipping point in the record. Even the known large volcanic and impact events have only transient effects which are barely, if at all, evident in the climate record.
Relative to man’s potential impact, even the nuclear winter that would result from detonating the worlds atomic arsenals would be invisible in the long term climate record.
The AGW crowd surely considers the climate system to be far more fragile and sluggish than the record supports. This is somewhat ironic since the more sluggish it is (i.e. resistant to change), the less fragile it will be.
George
10
hmm –
Isn’t it funny how “man-made” CO2 has such lethal and toxic peoperties.
My goodness, “organic” CO2 is “good” for the planet, but that “man-made” stuff is so sh*tty!
that is
sofa king
we tod did
[oops – sorry – I am in one of those off beat moods of mine]
10
As shown in the graph of atmospheric carbon dioxide level and average global temperature for the last 500 million years which is presented at http://www.geocraft.com/WVFossils/Carboniferous_climate.html , in the late Ordovician the planet plunged in to the Andean-Saharan ice age while the atmospheric carbon dioxide level was more than ten times what it is now. It is appalling that people who should be aware of this are scaring people with threats of a ‘tipping point’.
10
Not just that – but during that period, the average atm pressure at sea level was 1.2-1.3x what it is now – meaning that the partial pressure of CO2 in the atm was more than 12 or 13 times what it is now,
the periodic climate change of 100 000 year cycles carried on excatly has it has done since the Earth had a measurable atmosphere
10
Brian
I refuse to take seriously the notion of manmade tipping points (click on my name to see my Skeptics Climate Science primer).
However, there is plenty of geological evidence for sudden natural changes. Not just once but again and again, at 62M yr intervals or so. Frozen mammoths for a start – there is a heck of a lot of evidence, only it’s not fashionable in current science to be a “catastrophist”.
If you’re interested, look up Magnetic Reversals by Robert Felix, and Prof Mellott on “The Extinction Oscillator”.
10
Not entirely illogical when you consider that part of the emotional energy of the Green Movement is really a type of neo-Luddite behaviour. The story goes that technology is bad because technology brought us atom bombs and CCTV cameras spying on us, and complex things that are too difficult. Thus, technology must be defeated because it is too powerful and it is trying to take over the world. Go back to the simple golden age when life was simple and people lived in harmony with nature.
It’s a feeling that runs deep, even amongst well educated individuals.
10
Jo
There’s problems here
(1) Mauna Loa increase is from c. 331ppm in 1976 to c. 381ppm in 2006, or 50/331 doubling ie 0.15 NOT 0.45 AFAICT.
(2) George’s update figures don’t read right. You want figures like 6.336 x 10^6 (or 6.336E6) not 6.336^6
(and I cannot get the superscript to work either)
I think you need to be very careful here. It’s quite likely there are problems with Penny Wong’s maths just as Monckton showed that the IPCC’s maths fell down on its own criteria. I’ve not got the time to check more – but I know the maths is important and is an easy one to misuse to fool folk. It helps to use graphics to be sure you’ve understood each step aright.
10
Recent email exchange I thought was worth posting
> Dear Joanne:
>
> Michael Hammer notes the discrepancy between the IPCC projected temperature increase from CO2 and the actual heat energy absorbed in the oceans. But don’t the IPCC’s temperature scenarios depend upon the multiplying effect of water vapor (about which, of course, there is much dispute)? I don’t think you can extrapolate the expected heat in the oceans from the IPCC’s temperature estimates by using the estimated forcing from CO2 alone.
>
> Is this correct?
>
> Ben
Michael Hammer replies:
Hello Ben;
You are right to say the IPCC temperature scenarios depend on the multiplying effect of water vapour. According their claims the rise in CO2 leads to some additional retained heat which in turn causes a rise in absolute humidity (they claim constant relative humidity at the higher temperature) and the additional water vapour in the air in turn traps still more heat since water vapour is also a green house gas. ie: a positive feedback effect. You are correct that this heat must also be taken into account and I have done so. IPCC claim that a doubling in CO2 levels leads to 3C of warming, a figure that includes the positive feedbacks from water vapour. They also claim that the effective emission temperature of earth is 255K. From the first derivative of Stefans law, at 255K each 1 watt/sqM will raise the temperature by 0.266C. Thus to raise the temperature by 3 degrees takes 3/0.266 watts/sqM or 11.3 watts/sqM.. Of this 11.3 in fact only about 3.6 watts/sqM comes from the direct effect of CO2, the rest is claimed positive feedback effects. Now to date we have only had 0.45 doublings of CO2 and for such small changes in temperature we can expect even a quite non linear system to respond linearly. Thus we can infer 11.3*0.45 or 5.1 watts/sqM of additional heat.
The point is that I have included the additional claimed multiplying effect of water vapour by working from the claimed 3C outcome together with the temperature sensitivity of the planet.
I hope this clarifies the issue.
regards
Michael Hammer
10
1. Mammoths getting stuck in mud and freezing over epochs would give another appearance when discovered millions of years later
2. Magnetic fiels reversals are not what the appearance suggests
3. Let’s go back in time in live to harmony with Nature, when typhoid, diphtheria, cholera, and plague were truly King
10
Right, here’s my best. It depends on all my source figures being correct, and I’ve only been able to draw on the article itself, and MLO for CO2; I’ve also had to best-guess certain time intervals for measurements. I’d be grateful if someone could check and correct the figures. I’m using the convention “E” represents “times 10 to the power of”
MEASURED HEAT
Oceans’ measured heat increase = 15 E 22 joules over 30 years = 5 E 21 joules per year = 1.6 E 14 joules per sec (watts or W)
Wong says this is 85% of Earth’s heat
>> Earth’s total heat is 1.865 E 14 watts
Divide by Earth’s surface area of 5.1 E 14 square metres (m^2)
>> heat increase is 1.865/5.1 watts/m^2 = 0.365 watts/m^2
CARBON DIOXIDE MEASURED at Mauna Loa
CO2 levels are: 316 ppm in 1960, 331 ppm in 1976, 381 ppm in 2006.
Increase from 1976 to 2006 = 50 ppm over 331 ppm = 50/331 = 0.15
Increase from 1960 to 2006 = 75 ppm over 316 ppm = 75/316 = 0.24
(both are amount of “doubling”. Take your pick.)
IPCC THEORY
Doubling carbon dioxide levels supposedly causes 3ºC warming.
At “normal” Earth temperature of 255K, a 3ºC rise in temperature is supposedly caused by a radiative increase of 11.3 watts/m^2
MEASURED TEMPERATURE
During the 30 year period 1976-2006, global temperatures have apparently risen by 0.4ºC
CONSEQUENT MATHS
CO2 levels between 1976 and 2006 increased by a proportion of 0.15
Temperature increase should therefore be 0.15 x 3ºC = 0.4ºC
AHA!!! this is what was measured. It must be correct!……….
No, waaaaaaaaaaaaait…………
In this case, the heat increase should be 0.15 x 11.3 watts/m^2 = 1.7 watts/m^2
What the oceans indicate is a heat increase of 0.36 watts/m^2
This should correspond to a temperature rise of… what?… 0.1ºC
NOT the 0.4ºC the measurements appear to show.
TEMP MEASUREMENT PROBLEMS
We suspect the urban heat effect is grossly underestimated
We know that the surface stations are being fried alive by asphalt, heat exhausts, and all the items WUWT has noticed.
Looks like we have a smoking gun….. indicating just how far the temperature measurements may be skewed.
10
Ah, of course, the extra temperature increase must be the amplifying GHG effect of water vapour…
…except the water vapour has NOT increased at the height critical to the GHG effect (see here) and so, of course, the tropical troposphere hotspot is missing
10
IPCC “theory” has the remarkable property of being valid only for the future, and meaningless for the past.
That is because “man-made” CO2 is so “dirty” and “awful”. It’s “yukky”.
You don’t need to be Einstein to figure that one out
10
Lucy Skywalker has pointed out a problem with the IPCC’s treatment of CO2 that has long bothered me — CO2 concentrations are rising only 40% as fast as the IPCC assumes (and, perhaps, as Michael Hammer assumes as well.) Using the real rate of CO2 growth would result in an even greater disparity between the claimed “crisis” and reality.
Consider this data:
CO2 concentration in 1958.21 = 315.71 ppm
CO2 concentration in 2009.21 = 388.78 ppm (data from Mauna Loa via http://www.woodfortrees.org/plot/esrl-co2 for a graph — click on “Raw Data” for numbers)
This data follows closely an exponential curve with a yearly increase of r = 0.41% and a doubling time of 170 years. (doubling time, tau = (2009-1958)*log(2)/log(388.78/315.71); 1+r = 2^(1/tau) for a rough estimate from the endpoints — a least squares fit to the whole curve gives essentially the same result.)
HOWEVER, all of the model runs the IPCC uses take 1%/year (doubling time = 70 years) as an “idealized” (!!?) estimate for CO2 increase. (See: http://www.cgd.ucar.edu/ccr/publications/meehl_cmip.pdf )
One excuse sometimes heard for this is that the 2.5x rate for CO2 “stands in” for the increase of other greenhouse gases such as methane. I have never seen, however, any data that would show (or even suggest) that CO2 and methane are coupled in such a fashion. In the recent past methane showed a significant rate decrease for a number of years while CO2 continued to climb.
The fact is, that these GCM models supposedly based on atmospheric physics are routinely run with completely unrealistic and non-historic CO2 concentration increases (2.5 times larger than the rate for the last 50 years). Instead of putting in the measured rate of increase of other gases such as methane (and having to try to explain the rate variations) they make coupling assumptions that are completely unjustified by either theory or measurement.
Thus, the output of these models (and the IPCC’s conclusions from them) have NO real-world implications whatsoever, and there is NO BASIS for basing any policy decisions on them.
And what the heck is meant by the current claims that “CO2 is rising faster than expected!)?? What pathetic excuse for a scientist couldn’t forecast that the nearly constant rate for the last 50 years is the best estimate for the future rate? If anyone expected the rate to change, they would certainly expect it to increase, not decrease — when it didn’t increase then it would be “rising slower than expected”. This statement (“faster than expected increase” is too dumb to be even a lie — it’s just inane.
10
Another data problem. I don’t know what the source of the top Ocean Heat Content graph is, but I think the best available source is Bob Tisdale yesterday (!!) which uses the same data that RealClimate uses but goes further and shows different trends from different studies and different start/end of dates of course. All trends are less than the above 5 x 10^21 joules/year. They vary between 1.5 x 10^21 and 4 x 10^21 joules/year, ie let’s just halve the values I used earlier.
That would mean that the measured temperature rise of 4ºC is just ten times bigger than that which the oceans indicate.
Back to – ten times too big.
10
Lucy there is an error in what you wrote. The relationship between co2 concentration and retained heat is logarithmic not linear. Thus using your numbers for the increase from 1960 to 2006 the calculations should be fractonal increase = (316+75)/316 = 1.24. This represents log(1.24)/log(2) doublings or 0.31 doublings which would increase retained heat by 11.3*0.31 = 3.5 watts/sqM. Now some of that retained heat is in fact re-radiated to space because of the increase in surface temperature. If that increase is 0.4C then the additional radiation can be estimated as 11.3*.4/3 = 1.5 watts/sqM (Note that this assumes the 3C is an equilibrium rise in temperature. In fact this is an invalid assumption becuase if we assume the earth is not in equilibrium now and CO2 keeps rising then it will also not be in equilibrium in 2070. Under those circunstances the 11.3 is a significant under estimate since it assumes no net retained heat ut lets ignore that for now). Using your numbers the net retained heat is 3.5 – 1.5 or 2 watts/sqM which is still far in excess of the 0.38 computed from ocean warming.
10
I would argue that we don’t know the real relationship and both the logarithmic and the linear estimates are guesswork. Some people prefer one, some prefer the other.
10
You have to keep in mind that your average city office worker is traumatized by traffic, train timetables, and by their computer and their telephone on a daily basis, but they have no experience of any major life threatening epidemic (yes I know that Swine Flu is the latest “pandemic” BS, but I mean a real epidemic rather than media/WHO beat-ups). Most of them don’t consciously understand that they are traumatized.
Human brains are designed to react to what it hurting me now, not what once hurt great grandpa. These people are operating at an emotional level, and then back-rationalising their emotional decisions to convince themselves they have thought about it. The Al Gore’s of the world know how to tap into that energy and channel it.
10
Michael you may be right, but I’m not up to any more maths right now and I need it spelled out really carefully. Certainly the logarithmic link sounds right but it actually does not change the numbers that much and does not upset the basic thesis that figures do not add up!
One query: this maths of yours “11.3*.4/3 = 1.5 ” does not compute with me. Have I missed something?
I think we all suspect that IPCC have played fast and loose with the maths. But to nail them, we have to be very, very sure – and clear, so that others can follow the maths. Otherwise Schmidt of RC, who is a mathematician, can run rings round us.
I might finally go back to Monckton’s analysis of the IPCC maths, and might now be able to understand it and check it myself! I’ve already used it in my primer. Monckton answered every single challenge of Schmidt, and since Schmidt never deigned to respond, and the issue is crucial, I am certain that Schmidt could not respond, that Monckton was correct.
10
Hello Lucy; I fully understand. I managed to prove the logarithmic relationship for myself from first principles but it is a lengthy calculation and beyond the scope of this debate. Lets accept for now that the relationship is in fact logarithmic as most people on both sides have accepted. You are right by the way, for your calculations the difference although significant is not all that great and that is because you are looking at relatively small changes. If the changes in question were larger it would matter more.
However to come to the more significant issues. The temperature sensitivity of Earth is a measure of how much one extra watt/sqM will raise the temperature. I used a value of 0.266C whcih I got by differentiating Stefans law for a temperature of 255K (the emission temperature for Earth claimed by the AGW believers). I did also find a number of other values on the web used by various AGW advocates ie: Ramanathan (1988) 0.24K, Soden and Held (2006) 0.25K, Hansen et al (1984) 0.26K, Bony et al (2006) 0.263K, Colman (2003) 0.30K, Kiehl (1992) 0.305K. As you can see my value is quite representative of the other values. The sensitivity 0.266 K/watt/sqM can also be exprssed in reciprocal form as 3.76 watts/sqM/K. So if the temperature rise is 0.4K (or 0.4C) the xtra heat retained is 0.4 * 3.76 = 1.5watts/sqM. I probably expressed this badly in what I posted because I obtained the number by rationing it from the 3C rise ie: if 3C equates to 11.3 watts then 0.4C equates to 11.3 * 0.4/3. I should have expressed it simply as temperature chage times sensitivity.
There is another way to look at all this. Since 1900 we have had 0.45 doublings of CO2. The temperature rise attributed to this rising CO2 is 0.4C. We are told by 2070 the CO2 level will have reached 560 ppm which is double the 1900 level. That means there are 0.55 doublings to go and we are toldthis will give a further rise of 3C. Hmm, the first 0.45 doublings gives 0.4C and the next 0.55 doublings gives 3C. How is that possible? Surely one would expect that it would only give 0.4 * 0.55/0.45 = 0.5C (simple ratio). The explanation I have heard is that there is massive stored heat which will cause further warming even if the current CO2 level did not rise further. In short the climate system has a long time constant. If that were the case what would be happening is that the current CO2 level (with feedbacks)would be retaining much more heat than the temperature rise suggests and this heat would be going into slowly heating up the planet. However the largest heat sink on the planet has to be the oceans and as the analysis shows the oceans simply do not have enough heat capacity for this exlanation to be credible. I have now seen a report by Roger Pielke saying the same thing. There is no stored pipeline of energy.
10
Thanks Michael. I pretty well agree with you now.
10
[…] This report gives details of heat calculations which show that the heat taken in by the world’s oceans is nowhere near enough to support the theory of global warming of the IPCC. Yet another piece of evidence that doesn’t add up. […]
10
Here’s some relevant data.
http://www.palisad.com/co2/ocean.html
This shows the average daily incident energy for each 10 degree slice of latitude and for each month. It also shows the average ocean surface temperature, for the same times and spaces. All of the data is averaged from satellite data accumulated over the last 25 years. The ocean surface temperature data originates fon GISS (Hansen et all) and the solar irradiation is from the University of Colorado which is adjusted for Sun angles and the length of the day for each slice.
Notice the lag from min/max incident energy to min/max surface temperature. Also notice the relatively large ocean temperature swings, over 10C in some latitude slices! The ocean is responding very quickly to changes in the incident energy and not the decades that are needed to explain AGW.
George
10
This post has been updated. Michael Hammer realized the discrepancy is not as large as he’d estimated (it’s still large though.) See here, http://joannenova.com.au/2009/07/14/a-climate-change-paradox-part-ii/ for the more accurate figures.
10
[…] The antidote to 150 million quadrillion joules | JoNova […]
10
Great opportunity at flippa on this site
10