Recent Posts
-
Thursday
-
Why is the renewables industry allowed to sponsor political advertising in schools and call it “education”?
-
Wednesday
-
In trying to be a small target, the Liberals accidentally disappeared
-
Tuesday
-
Monday
-
The best thing about the Australian election was that Nigel Farage’s party won 30% in the UK
-
Sunday
-
Saturday — Election Day Australia
-
Vote for freedom…
-
Friday
-
Bombshell: Sir Tony Blair says climate policies are unworkable, irrational, and everyone is afraid of being called a denier
-
Thursday
-
Blackout in Spain to cost 2-4 billion Euro, likely due to solar plants — blind and biased ABC says “cause is a mystery”
-
Wednesday
-
Days after Spain reaches 100% renewable, mass blackouts hit, due to mysterious “rare atmospheric phenomenon”
-
Tuesday
-
Help needed: Site under DDoS attack from hundreds of thousands of unique IPs this week — especially China and the USA
-
Monday: Election Day Canada
-
When the Labor Party talk about “The Science” the Opposition can easily outflank and outgun them with bigger, better science
-
Saturday
-
UK Gov spends £50 m to dim sun to create slightly less beach weather
-
Friday
-
The cocoa price crisis is a Big Government price fixing disaster, not a climate change one
-
Thursday
-
Blame the Vikings! Moss found in East Antarctica lived in warmer summers a thousand years ago.
-
Wednesday
-
Tuesday
-
Monday
-
Easter Sunday
-
Saturday
-
Good Friday
-
In crash-test dummy land, we solve teenage girl climate anxiety with $500b in fantasy weather experiments…
-
Thursday
-
Nothing says “Safe and Effective” like destroying all the data from Australia’s giant abandoned vaccine study
-
Wednesday
-
Who owns the oceans? The UN wants to tax ships to reduce carbon emissions — a $40b windfall for unaccountable global bureaucrats
-
Tuesday
-
Monday
-
Sunday
-
Saturday
-
Conservatives promise to axe the car tax that would have added $10k to petrol and diesel cars
-
Friday
-
The monster Green Tariffs we put on ourselves are worse than a foreign trade war
-
Thursday
-
Trump goes gangbusters on coal power and coal mining to supply AI energy demand
-
Wednesday
-
Instead of $8b in rebates, Labor could have built gas and coal plants and actually made cheap electricity
-
Tuesday
-
Labor wants the working class to help rich people buy batteries
-
Monday
-
Sunday
|
Andy Hoffman has flown from Michigan to deliver the pop science solution to our atmospheric catastrophe.
You may have thought it was about planetary radiation, or moist adiabatic lapse rates, but Hoffman is here to save you from the waste-of-time science debate. Discussing science with “climate deniers” is like “talking to a wall” he says. We agree — anyone who denies we have a climate is thick-as-a-brick. Have you ever met one? No, neither have I. The mythical climate denier seems to be causing global warming through their inaction, but no one as yet, can name a single person who denies the climate.
I’m sure Hoffman wouldn’t want to be loose and inaccurate with his words — so no doubt he will find an actual “climate denier” or start to speak English instead.
Perhaps the debate he says he wants, will start when we speak the same language?
It’s obvious the Great Global Warming Scare is unravelling when the losing team turn into sour-puss-psychologists — finding dark mental failings in those too stupid to understand their Gift with The Weather.
When it comes to pop-psychology anyone can play…
Hoffman thinks skeptics aren’t convinced because they are afraid:
MANY climate sceptics do not trust environmentalists because they consider them “borderline communists” who want to curtail people’s freedom, a leading US social scientist says.
Speaking on Wednesday night, the University of Michigan’s Andy Hoffman said US global warming sceptics had “a serious distrust of the political ideology behind its proponents”.
“The fear is that environmentalists are left-leaning, they are socialist, borderline communists, and they are using the government to try to control your freedom,” Prof Hoffman said in the Sydney Ideas lecture at the University of Sydney.
“The expression for environmentalists is watermelons, they’re green on the outside, but they’re red on the inside. That really represents their feeling.”
We think Hoffman is using pop-psychology because he doesn’t have the science. (He will disagree. All he needs to do is phone-a-friend and find that mystery paper — the one that finally shows the models assumptions about relative humidity in the upper troposphere were right?)
Though he seems confused:
“It’s not about CO2, it’s not about climate models, it’s about values, it’s about world views,” the business and environment academic said.
If it’s not about CO2, that explains why the carbon tax doesn’t work. Will it cool the planet if I drive my SUV with a different world-view instead?
I can do that… 🙂
Once again, those-without-persuasive arguments resort to character assassination and confounding slurs:
Professor Hoffman said a “social consensus” to fight climate change needed to be built, similar to that created in the past to combat smoking and slavery.
(So does that mean finding some evidence to support your case Andy, or were you thinking “Civil War”?)
This about sums up the current state of play:
The losing team are plain flummoxed and confused. They tried to convince the unconvinced by calling them “Deniers” but that didn’t work. Then they declared that 97% of the anointed Gods-of-Climate-Science had seen the light through unvalidated climate simulations. When skeptics pointed out the models were wrong, the upper tropospheric hot spot was not there, and 7000 quintillion joules of energy were missing, the climate scientists responded that the skeptics were oil funded renegades from the tobacco movement.
At this point the dumb punters became more skeptical.
Not so coincidentally, about then, the pop-psychologists appeared to try to pretend they are not losing.
My favourite line
“One of the most important first steps in engaging the debate is not to blame or mock or ridicule,” he said.
Which is why he calls us deniers right?
—————————————————–
h/t To Geoff Derrick
PS: Sorry to Barry. I know we talked about being nice.
PPS: Thanks to the good souls who’ve been donating to my personal account. I didn’t realize it was so busy. Cheers to Keith (x 3!), Rodney, MaxL, and especially Mal, Tom K, and Wes. 🙂
9.6 out of 10 based on 79 ratings
Here’s a benefit FOIA probably didn’t imagine. Skeptical networks. For anyone who doesn’t know, Jennifer Marohasy has published one of the longest-running skeptical blogs in the world, and she’s one of the few other women on the front lines. I don’t know why we hadn’t spent a long time on the phone before. I’m delighted that we are in much better contact…
— Jo
—————————————————————————-

FOIA is a recognised shorthand for Freedom of Information Act. Legislation by this name has existed in the USA since 1966, Australia since 1982 and the UK legislation was introduced in 2000. It was climate scientists at the Climatic Research Unit, University of East Anglia, conspiring to evade the UK FOIA that probably inspired Climategate, with Mr FOIA, as the “hacker” calls himself, releasing over 220,000 documents and emails beginning in November 2009. In a recent email he explained: “The circus was about to arrive in Copenhagen. Later on it could be too late.”
By providing public access to emails and documents from leading climate scientists, Mr FOIA exposed how tricks, adjustments, and corrections, were routinely applied to climate data to support the propaganda of the largely government-funded global warming industry.
I recently scrutinized documents from a successful FOI request by John Abbot to the Australian Department of Climate Change and Energy Efficiency, DCCEE. As far as I can make out from the documents the entire Australian Climate Change Science Program can be likened to what Mr FOIA describes as “a massive hole-digging-and-filling-up endeavor” for which the climate scientists are generously remunerated by the Australian taxpayer. Let me explain in more detail:
Modern history suggests that democracy aligns, and progresses, with the expansion of civil liberties including access by the ordinary citizen to government information. But in the Climategate emails, it is clear that leading UK climate scientists held the FOIA in contempt, considering it a waste of time and recommending that data and information be deleted rather than released. The problem extends beyond the CRU to western democracies more generally where ballooning bureaucracies are increasingly reluctant to share information with their public. Yet without meaningful public oversight of public expenditure there is reason to fear that government bureaucracies will become self-serving and oppressive which is the antithesis of the egalitarian democratic ideal.
“It appeared that there were significant accounting discrepancies suggesting the overpayment of CSIRO and BOM of about $10 million.”
In Australia, for example, public expenditure on global warming has continued to increase, but there is no evidence that there has been any corresponding improvement in climate science, for example, through improved seasonal rainfall forecasts.
In March 2010, John Abbot – a PhD scientist who is also a qualified solicitor – made a Freedom of Information request to the DCCEE asking for documents concerning the Australian Climate Change Science Program, ACCSP, including how monies were allocated between specific projects and the outcomes from these projects. The request was initially denied, claiming various exemptions as detailed in recent peer reviewed articles in Environmental Law and Management [1] and Public Law Review [2].
Following a protracted appeal process through the Information Commissioner that included scrutiny of the manner of application of the public interest test and bogus claims of intellectual property rights, the original decision was reversed and the documents were eventually released.
These documents detailed funding for 160 government climate scientists, almost all of these employed by the CSIRO and Bureau of Meteorology, BOM. It appeared that there were significant accounting discrepancies suggesting the overpayment of CSIRO and BOM of about $10 million. The DCCEE has declined to comment on the discrepancy, in particular the provision of funding for salaries apparently far in excess of what could be reasonably justified and supplementary to core agency funding.
Professor Abbot’s FOI request was made at a time when there was much public discussion and debate about the merits of the newly-elected Australian federal government introducing significant economic reform by way of a wide ranging carbon tax to address issues of anthropogenic global warming. The BOM and CSIRO were cited in support of government policy developed by the DCCEE and underpinned by the assumption that the Millennium drought (2001-2009) was linked to climate change.
The BoM and the CSIRO had directed much of their research efforts towards understanding rainfall patterns and generating rainfall projections by using General Circulation Models, GCMs. These are the same models that are relied on to provide evidence for global warming associated with greenhouse gas emissions. The models require very large capital expenditures for supercomputers (tens of millions of dollars) and are also very expensive to run to perform calculations. A reasonable question from a public interest perspective is therefore – do these models perform well at forecasting rainfall? After investing millions of dollars, has this actually improved rainfall forecasts in a practical way? There is no evidence, however, in any of the documents released under FOIA that the DCCEE has any interest in the real world application of this climate research.
***
Keep reading →
8.8 out of 10 based on 105 ratings
UPDATE: Cash is being flown to British Troops in Cyprus. The banks will stay shut til Thursday. The finance minister has resigned. [SkyNews]
Remember how the EU was supposed to promote stability?
Sooner or later a central fund managed by central bureaucrats is going to fail in a “central” way. This isn’t it, but we are getting closer to the center.

Without competition between states on currency, Europe left itself open to be a case study in centralized stupidity. The bureaucrats needed to stop the waste of public spending, they needed to halt the corruption, increase competition. And their answer? Steal 10% of depositor’s funds from everyone in Cyprus. It seemed like a good idea at the time.
We are now in new territory. In previous bank bailouts, if anyone took any losses it was the shareholders and the bond holders, and the depositors did not lose any money. In the Cyprus bail out, the bondholders and shareholders lose nothing but the depositors lose about 10%. (Any chance the bondholders of the Cyprus banks include the ECB or IMF?)
Where is the natural law that makes sense in this decision? Don’t punish the shareholders, or the bondholders, break the centuries long promise that is the entire reason for banking. If the government can steal your money in the bank, why keep it there? Hello Bank-run.
Wasn’t the point of banking to keep your money safe from burglars?
The Cyprus move is changing everything:
James Turk : “There are bank runs here in Europe again, Eric. Today is a national holiday in Cyprus, so the banks are closed. But people are lining up at ATMs to get their money out before the ATMs run dry. And there is talk that a bank holiday will be declared, possibly keeping them closed for days.
Depositors in Cyprus are going to lose some of their money as part of a proposed EU bailout of that country announced over the weekend, which like a a number of other countries, along with its banks, are insolvent and teetering on the edge of bankruptcy….
“To help fund this bailout the government is taking 9.9% of all deposits over €100,000 and 6.7% under that amount, even though these small deposits are supposed to be insured, which is a key point. Bank insurance means nothing these days when bureaucrats and politicians are looking for wealth to grab.
It is indeed mind-blowing, particularly when considering that the banking system in Cyprus is not that big. The total amount taken from depositors is only €5.8 billion. Given what the ECB and other central banks are printing these days, €5.8 billion is small change.
James Turk Founder & Chairman of GoldMoney
This is organized crime on a mass scale. The not-so-funny irony is that it’s organized crime against organized criminals!
The bureaucrats not only broke the rules, but look who they targeted. If you were hoping for easy money to patch up the budget, would you take it from the Russian mafia and ex-KGB officers?
Keep reading →
9.6 out of 10 based on 57 ratings
 Hyperia | Credit Wikimedia Despite the fuss about CO2 emissions, on a global scale no one is quite sure where a lot of it ends up. Those mystery “sinks” draw in a large proportion of CO2. Here’s a big sink that just got twice as big.
Science Daily Mar. 17, 2013 — Models of carbon dioxide in the world’s oceans need to be revised, according to new work by UC Irvine and other scientists published online Sunday in Nature Geoscience. Trillions of plankton near the surface of warm waters are far more carbon-rich than has long been thought, they found. Global marine temperature fluctuations could mean that tiny Prochlorococcus and other microbes digest double the carbon previously calculated.
The trouble started when someone made an assumption.
Keep reading →
8.8 out of 10 based on 55 ratings
File this under: What don’t we know?
 We just discovered slice “2” is alive. |1 – Continental crust | 2 -Oceanic crust | 3 – Upper Mantle | 4 – Lower Mantle | 5 – Outer Core | 6 – Inner Core | Image Credit: Dake You might have thought that photosynthetic life forms had the Earth covered, but according to some researchers the largest ecosystem on Earth was just discovered and announced last Thursday, and it’s powered by hydrogen, not photosynthesis.
The Oceanic Crust is the rocky hard part under the mud that lies under the ocean. It covers 60% of the planet and it’s 10km thick. (The oceans themselves are a paltry 4km deep on average.) We’ve known for years that the isolated hot springs in trenches held life. But who thought that all the hundreds of thousands of square kilometers of basalt rock in between had its own life cycle? Last week a group from the Center for Geomicrobiology at Aarhus University, Denmark announced that they had drilled through crust that was 2.5km underwater and 55 km away from anything that mattered. They found life in the basalt.
“We’re providing the first direct evidence of life in the deeply buried oceanic crust. Our findings suggest that this spatially vast ecosystem is largely supported by chemosynthesis,” says Dr Lever, at the time a PhD student at the University of North Carolina at Chapel Hill, USA, and now a scientist at the Center for Geomicrobiology at Aarhus University, Denmark.
The microorganisms we found are native to basalt,” explains Dr Lever.
It’s a hydrogen powered life
Energy from reduced iron
We have learned that sunlight is a prerequisite for life on Earth. Photosynthetic organisms use sunlight to convert carbon dioxide into organic material that makes up the foundation of Earth’s food chains. Life in the porous rock material in the oceanic crust is fundamentally different. Energy — and therefore life’s driving force — derives from geochemical processes.
“There are small veins in the basaltic oceanic crust and water runs through them. The water probably reacts with reduced iron compounds, such as olivine, in the basalt and releases hydrogen. Microorganisms use the hydrogen as a source of energy to convert carbon dioxide into organic material,” explains Dr Lever. “So far, evidence for life deep within oceanic crust was based on chemical and textural signatures in rocks, but direct proof was lacking,” adds Dr Olivier Rouxel of the French IFREMER institute.
It’s not just hydrogen-powered, there’s sulphate, methane, and carbon fermentation too
Even though this enormous ecosystem is probably mainly based on hydrogen, several different forms of life are found here. The hydrogen-oxidising microorganisms create organic material that forms the basis for other microorganisms in the basalt. Some organisms get their energy by producing methane or by reducing sulphate, while others get energy by breaking down organic carbon by means of fermentation.
These bugs are not the same ones in the sea water. There is no oxygen, and while they are in old rocks, they are not fossils
Keep reading →
9 out of 10 based on 39 ratings
There are probably only ten people in Australia who haven’t heard it was the Hottest Ever, Record Summer Downunder. And they were probably born yesterday.
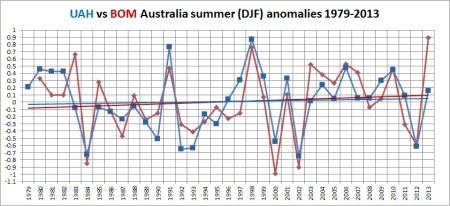
Summer here was so scorchingly awful it was Angry. But a funny thing happened on the orbit overhead. Check out the UAH satellite data on summers since the UAH records began. The graph below (thanks to Ken) is the temperature data from the NASA satellites, processed by UAH (University of Alabama in Huntsville). Strangely there is a disparity between what the satellites recorded and the BOM.
The satellite data shows that the summer of 2012-2013 was close to ordinary, compared with the entire satellite record going back to 1979. Not a record. Not even extreme?
 According to UAH satellite measurements summer in early 2013 was not a record. Not even close. The graph data comes thanks to John Christy, Director, Earth System Science Center, Distinguished Professor, Atmospheric Science
University of Alabama in Huntsville, Alabama State Climatologist and Roy Spencer. It was graphed by Ken Stewart at KensKingdom, and inspired by Tom Quirk at Quadrant. I was very happy to connect them this weekend. The data cover “average lower troposphere temperature anomalies for land grids only for the region 10S-40S by 110E-155E.” UPDATE: The data in the graph above does include Tasmania as well, and does not include PNG or Timor.
Perhaps there is some error in the data? But on Ken’s site, you can see he gets a reasonably close correlation for most points with ACORN.
As Ken says:
According to BOM, last summer was a record, yet the satellites say it was pretty ordinary- 14th warmest out of the last 35. The last time there was such a large discrepancy was 1983- the two series since then have been reasonably similar.
Ken Stewart compared the UAH summer record to the BOM one.
 … Note though that the other large discrepancy was 1983 which was also a year when the BOM records a very high temperature, and UAH records an average one. Perhaps that is a clue?
The UAH data is not covering the same area as the BOM stats do.
There is no Tasmanian data, and while a lot of surrounding ocean is included in the longitude and latitude, the UAH data is for land-grids only. The black rectangle marks the land covered in the UAH satellite data.
UPDATE: John Christy sent a second set of data to Ken that does include Tasmania and doesn’t include Indonesia and PNG. I will update the graphic below as soon as I can. The UAH data is more accurate than I thought.

Even if the UAH data included some ocean stats leaking into the mix, according to the BOM the ocean was the hottest on record in any case.
The Age quotes the BOM telling us that seas weren’t just warm, and it wasn’t just one month. It was the hottest, and it was all of summer:
Seas around Australia are also warmer than usual, with surface temperatures reaching record highs at the end of February, according to a Special Climate Statement issued by the Bureau of Meteorology in the wake of this month’s heatwave across south-eastern Australia.
Summer sea temperatures were 0.5 degrees above normal and the warmest since records began in 1900, the bureau said.
The Australian BOM says: “Summer ocean surface temperatures around Australia were the highest on record.“ (March 12) Note the warm water surrounding the Western and Southern coasts on the latest ENSO map (below).
Keep reading →
9 out of 10 based on 85 ratings
Who knows what might have turned up…
7.8 out of 10 based on 25 ratings
The message to the world is unequivocal:
“We are heading for somewhere that is far off from anything we have seen in the past 10,000 years – it’s through the roof. In my mind, we are heading for a different planet to the one that we have been used to,” said Jeremy Shakun of Harvard University, a co-author of the study.
Source: The-world-is-hottest-it-has-been-since-the-end-of-the-ice-age–and-the-temperatures-still-rising.
There are two factors in the new Marcott paper that are major red flags. For one, there is hardly any data in the modern end of the graph. Ponder how researchers can find 5,000 year old Foraminifera deposits, but not ones from 1940? Two: they’ve smoothed the heck out of longer periods. Marcott et al clearly say there is “…essentially no variability preserved at periods shorter than 300 years…” So if there were, say, occurrences of a warming rise exactly like the last century, this graph won’t show them.
Some of the data has a resolution as poor as “500 years” and the median is 120 years. If current temperatures were averaged over 120 years (that would be 1890 to now), the last alarming spike would blend right in with the other data. Where would the average dot be for the “last 500 years”. It would be low, cold, and there would be no hockeystick at all in a “500 year” averaged graph. But if there was a period of rapid warming sometime in the last 10,000 years, one which occurred over say, 50 years, it would disappear amongst the uncertainties.
Robert Rohde (of the BEST Project) points out that so much of the variance is lost that it is equivalent to smoothing the series with a 400 year running average, saying “it will completely obscure any rapid fluctuations having durations less than a few hundred years.”
It may be necessary to sacrifice the variance, and blend and blur those past peaks (given the uncertainties) but after doing so, how can Marcott et al say anything at all, even a squeak, about the rate of warming in the last 100 years?
In the end the hockey stick seems to come from a 20 year “reconstruction” of data that has a median of 120 year resolution. Would that have the effect of heavily weighting some proxies while smoothing out the others? It’s all very well to trumpet that there are 73 proxies, but some of them obviously count for a lot more than others.
 Repeat of the old hockey-stick: The last 2,000 years. The new hockey-stick blends high and low resolution data from many proxies in the past with mixed resolution data (but few proxies) in recent times. It’s a complex method which produces something not seemingly reflected in the actual proxy data. Where are the hockey-stick-proxies? It also doesn’t help that ten percent of all 73 proxies fail their own criteria for inclusion. (Thanks to Willis for all those spectacular spaghetti graphs, and thanks to both Craig Loehle, and Roberto Soria for advice).
There appear to be hardly any records from the time of the spike?
Am I reading this incorrectly? Note fig a and fig e here. See that dive to zero on the right hand edge — just at the point that the “hockey-stick” appears in lower graphs? Are there virtually no proxy records during the time of the spike? Note that the lines in the other graphs here come from “temperature reconstructions” which are area weighted and “Monte Carlo” based graphs.
 .Fig. S10: Temperature reconstructions separated by latitude. (a) Number of records used to construct the temperature stack through time for the 5×5 degree weighted 90-60°N sites (black line), 60-30°N sites (blue line), 30-0°N sites (green line), 0-30°S sites (pink line), 30-60°S sites (purple line), and 60-90°S sites (brown line). (b-d) 5×5 degree weighted temperature envelope (1-σ) of the global temperature anomaly (blue fill) plotted against the 5×5 degree weighted latitudinal sites. Uncertainty bars in upper left corner reflect the average Monte Carlo based 1σ uncertainty for each reconstruction, and were not overlain on line for clarity. e-h same as a for the last 11,300 years. Temperature anomaly is from the CE 1961-1990 average. Note that b and f have larger y-axes, but are scaled the same as the axes in c,d,g,h. (Click to enlarge)
See also the next figure. Note in a and d, the ragged edges as the proxies run out of data on the right? See how the number of records plummets to zero? Note how this correlates with the spike (c and f). Steve McIntyre writes that the Alkenone proxies are the largest group of proxies (31 of 73) yet the uptick is mysteriously absent from the data. McIntyre does not believe that the uptick is due to splicing in of the instrumental data, but cannot explain it yet. Can Marcott explain it? You would think so, but his response left McIntyre baffled.
 Fig. S11: Temperature reconstructions separated by ocean vs land. (a) Latitudinal distribution of the records used to construct the terrestrial (brown bars), and ocean records (blue bars). (b) Number of records used to construct the temperature stacks through time (terrestrial – brown line; ocean–blue line). (c) Global temperature anomaly 1-σ envelope (5×5 degree weighted) (blue fill) and terrestrial (brown), and ocean records (blue). Uncertainty bars in upper left corner reflect the average Monte Carlo based 1σ uncertainty for each reconstruction, and were not overlain in plot for clarity. d-f same as a-c for the last 11,300 years. Temperature anomaly is from the CE 1961-1990 average. (Click to enlarge) Notice in c, the hockey-stick spike is coming mostly from the “ocean”? Hmm.
Even the author admits the spike is not robust?
Even Marcott admits the reconstruction of the modern spike is not robust in either the Northern or the Southern Hemisphere, and where else is there? (Thanks to Steve McIntyre for asking him).
Regarding the NH reconstructions, using the same reasoning as above, we do not think this increase in temperature in our Monte-Carlo analysis of the paleo proxies between 1920 − 1940 is robust given the resolution and number of datasets. In this particular case, the Agassiz-Renland reconstruction does in fact contribute the majority of the apparent increase.
…
Regarding the SH reconstruction: It is the same situation, and again we do not think the last 60 years of our Monte Carlo reconstruction are robust given the small number and resolution of the data in that interval.
So why all the newspaper headlines? The non-robust result turns into a PR message.
Did they mention this is the paper in paragraph four as Marcott says? Well, kind of — not really. Here’s a “hint”:
Without filling data gaps, our Standard5×5 reconstruction (Fig. 1A) exhibits 0.6°C greater warming over the past ~60 yr B.P. (1890 to 1950 CE) than our equivalent infilled 5° × 5° area-weighted mean stack (Fig. 1, C and D). However, considering the temporal resolution of our data set and the small number of records that cover this interval (Fig. 1G), this difference is probably not robust. Before this interval, the gap filled and unfilled methods of calculating the stacks are nearly identical (Fig. 1D).
He’s saying the “difference” between the two versions is not robust, but not that the main feature of the graph is fickle, flakey, or may disappear under analysis. (Thanks to McIntyre and Eschenbach for spotting that.)
Me, I wonder why Science published the paper in the first place?
The proxies, the proxies
Now look at the graphs of the actual proxies offered in the supplementary material. Note how the proxy data – in red and blue lines shows no hockey-stick. But this is the tropics, so that’s not unexpected.
Keep reading →
9.3 out of 10 based on 78 ratings
FOIA has been in touch with skeptics today. Here is the email below, sorry, without that password. There are 220,000 emails in the file. There may be private information which could cause grief that is not related to taxpayer funded work. Obviously that large file is not in a form that can be released publicly yet. I do hope people are very very careful with the password.
This is your chance to understand why FOIA did what they did, and your chance to say thanks to the person who quite possibly saved us from a bureaucratic coup in Copenhagen in 2009. The draft treaty promised to take up to $140 billion from some and redistribute it to others. As Christopher Monckton revealed, sovereign nations would be ceding powers to a group of foreign officials, but the document did not have the words “election” or “democracy” or “vote” or “ballot”.
To all those who think, post hoc, that Copenhagen was never going to succeed anyway, I say that in November 2009, when I asked the carbon traders which outcome the money was betting on. The answer was: we don’t know. The players are out of this market.
You can leave your messages for FOIA below. I’m sure he or she will be back here to read them 🙂
===================================
Subject: FOIA 2013: the password
It’s time to tie up loose ends and dispel some of the speculation surrounding the Climategate affair.
Indeed, it’s singular “I” this time. After certain career developments I can no longer use the papal plural 😉
If this email seems slightly disjointed it’s probably my linguistic background and the problem of trying to address both the wider audience (I expect this will be partially reproduced sooner or later) and the email recipients (whom I haven’t decided yet on).
The “all.7z” password is [redacted]
DO NOT PUBLISH THE PASSWORD. Quote other parts if you like. Releasing the encrypted archive was a mere practicality. I didn’t want to keep the emails lying around. I prepared CG1 & 2 alone. Even skimming through all 220.000 emails would have taken several more months of work in an increasingly unfavorable environment.
Dumping them all into the public domain would be the last resort. Majority of the emails are irrelevant, some of them probably sensitive and socially damaging.
To get the remaining scientifically (or otherwise) relevant emails out, I ask you to pass this on to any motivated and responsible individuals who could volunteer some time to sift through the material for eventual release. Filtering\redacting personally sensitive emails doesn’t require special expertise. I’m not entirely comfortable sending the password around unsolicited, but haven’t got better ideas at the moment. If you feel this makes you seemingly “complicit” in a way you don’t like, don’t take action.
I don’t expect these remaining emails to hold big surprises. Yet it’s possible that the most important pieces are among them. Nobody on the planet has held the archive in plaintext since CG2. That’s right; no conspiracy, no paid hackers, no Big Oil. The Republicans didn’t plot this. USA politics is alien to me, neither am I from the UK. There is life outside the Anglo-American sphere.
If someone is still wondering why anyone would take these risks, or sees only a breach of privacy here, a few words…
The first glimpses I got behind the scenes did little to garner my trust in the state of climate science — on the contrary. I found myself in front of a choice that just might have a global impact.
Briefly put, when I had to balance the interests of my own safety, privacy\career of a few scientists, and the well-being of billions of people living in the coming several decades, the first two weren’t the decisive concern.
It was me or nobody, now or never. Combination of several rather improbable prerequisites just wouldn’t occur again for anyone else in the foreseeable future. The circus was about to arrive in Copenhagen. Later on it could be too late.
Keep reading →
8.7 out of 10 based on 147 ratings
I’m not keen on short term trends at all, they have a habit of flicking in and out of statistical significance with each month’s new data, or even switching from cooling to warming. But for what it’s worth, and only time will tell, perhaps the world entered the downswing of the PDO cycle in temperatures circa 2005.
If the world was entering a gently cooling phase, this is what it would look like
Syun Akasofu pointed out that there was a simple 60 year oscillation of global temperatures (about 30 years of warming, about 30 years of mild cooling) on top of a long slow rise that started more than 200 years ago. He predicted that we were at the top of one of the cycles, and were about to see the beginning of a cooler cycle. This early data suggests he may be right.
 See the little red dot with the green arrow at about the 2010 mark. Dr Syun Akasofu The cooling for the last eight years is statistically significant in 4 of the 5 major air temperature datasets. One, UAH, shows a small (statistically insignificant) rise since 2005.
And here’s the political point: how many of the policy makers, the media, or the public are even aware of the current trend? Approximately no one. I’ll bet even most skeptics didn’t know it.
 … ….
Keep reading →
8.4 out of 10 based on 101 ratings
Oh the irony?
Three years after the scandal that was ClimateGate, the University of East Anglia has a campus wide poster program to teach staff and students how to protect themselves from pfishing. (Thanks to reader pickabelief). Could this be a plan to protect the university from more embarrassing hacks and leaks too?
(Given other standards at UEA*, we have to ask if this is the rapid-response-squad?)
 … *With apologies to good scientists and workers at UEA. You didn’t ask for this test, but if you want to protect your reputation, you need to speak up. You could start with explaining why you do things differently to the people who use tricks to hide declines, avoid FOIs, and consort to delete taxpayer funded email records.
Some at UEA applaud work where random numbers produce the same “result” as a poor-censored-and-truncated-proxy does, and you might think, rightly, this is not science. But as long as sloppy, inept activist-scientists use the UEA brand to bolster their credibility, everyone who tacitly supports them gets tarred with the same brush.
The hoax that matters is the one that billions of dollars depend upon ($257 billion are invested in renewables per annum and $176 billion turns over in the carbon market). For those who say that committees investigated and cleared UEA, I say, who needs a committee to spot rank deception? Read the emails yourself.
They are talking about temperature data:
“I’ve just completed Mike’s Nature trick of adding in the real temperatures to each series for the last 20 years (i.e. from 1981 onwards) and from 1961 for Keith’s to hide the decline.” – Phil Jones, UEA
“Can you delete any emails you may have had with Keith regarding the latest (IPCC) report? Keith will do likewise…Can you also email Gene and get him to do the same?…We will be getting Caspar to do likewise.” – Phil Jones, UEA
“We also have a Data Protection Act, which I will hide behind.” – Phil Jones, UEA
“Mike Mann refuses to talk to these people and I can understand why. They are just trying to find if we’ve done anything wrong.” – Phil Jones, UEA
Can you spot a hoax?
9 out of 10 based on 76 ratings
I’ll be back at the desk later today… 🙂
8.7 out of 10 based on 20 ratings
 The animated Christopher Monckton
Apologies for the lack of posting, Christopher Monckton is staying with us, he’s in the kitchen right now, and we’ve had an event on, or radio interviews, or high level log-graph must-do calculations every day. It’s been marvelous, and as it happens, very productive (though not conducive to writing posts).
Christopher was in absolutely fine form on Wednesday night in Perth, as he tackles the teetering health of Western Civilization. The crowd was filled with many new faces — people who missed Monckton on previous tours, and were delighted to finally get the chance to see him. There were “undecideds” bought in by skeptical friends, as well as some believers-of-man-made-global warming (good on them for turning up).
What was also especially obvious at the Dalkeith-community-Hilton was the generous support of the Oil Moguls (not). We arrived half an hour ahead to find that there was no stand for the enormous projector screen. Dr David Evans sorted that out with great improvisation under pressure. (What he didn’t do was phone an emergency support contractor at great expense to turn up and save the day and send the bill to some Australian Government agency. )
 The crowd were so impressed they hardly noticed the stand, discretely visible here in the background…. Note the 5- Star projector screen infrastructure (above and below).
Essential ingredients: 6 trestle tables and 4 bricks. It performed very well (though Occ Health and Safety would have been apoplectic.)
Readers under 18 — don’t try this at home. 😉
 O’where is that Exxon cheque? ..
Information for the Perth Events:
Keep reading →
9.5 out of 10 based on 77 ratings
TIM FLANNERY, CHIEF CLIMATE COMMISSIONER 7-30 Report ABC: “…everything we’re seeing is consistent with what the climate scientists have been telling us now for decades…”
Leigh Sales, ABC PRESENTER : “… … …(no comment)…”
Steve Hunter Cartoonist:
 … Thanks to Steve Hunter (political cartoons). See also Andys rant. 😀
What are the odds?
Tim Flannery makes out that they have used maths to arrive at their conclusion. Let’s be clear, if you have a 499 in 500 chance of winning at poker, that’s not the same as the odds of us being able to predict a normal climate, and be able to spot an “artificial” one. Yet Tim would like you to think that’s the same bet.
7:30 Report excerpts
LEIGH SALES: How do you know that the new climatic conditions are responsible for the extreme whether events? How do you know that it’s just not some combination of meteorological circumstances?
TIM FLANNERY: Sure. Look, the studies suggest it’s a 1/500 chance that this sorta stuff is just normal. This is way outside the range of anything we’ve experienced before. It is really an extraordinary summer….
What studies Tim? Name them.
(What would Dorothy Mackellar have said?)
Extraordinary? In what sense of the word?
The three main Archaean cratons of Australia formed the greater Australian land mass around 2 billion B.C. We started recording the temperature about 1,999,999,850 years later (give or take a few hundred million years). At best, we have 150 years of temperature records. Most of our thermometers have only been recording for 50 years (many for less). The Pacific Decadal Oscillation (PDO) dominates our climate and one cycle of the PDO is about 60 years long. What part of that suggests we have the data to pronounce that events are extraordinary and outside of “normal”? Which part suggests we can calculate the odds to 2 decimal places? Who is kidding who here?
What’s the standard error on our flood record?
A new trend? Yes in failed predictions. There are more of them than ever …
TIM FLANNERY: ” … we’re not talking about one event here, we’re talking about an emerging trend. And we can see that that trend is entirely consistent with what the climate scientists have been saying for years. It’s taking us into new climatic territory here in Australia as we break more records. Blizzards: look, we don’t know. Is that due to cold conditions or not? Sometimes when you’ve got very warm oceans, you get a lot of evaporation and you get more snowfall. So I think just to jump to the conclusion that you’re seeing a blizzard somewhere, it’s not telling you anything, that single event, about the climatic trend.”
This is not a trend in climate warming, not a trend in storms, but a trend in disparate events. How do we do the regression stats on that? What? — Add three floods to one-a-half cyclones, a late monsoon, a drought that isn’t, and the eye of a newt, and voila! Plot the linear trend, and call yourself a witchdoctor.
How many cat-3 cyclones equals a 150 year record temperature which lasted for a half hour in Sydney?
The IPCC got all the trends-that-matter wrong
The trends that count are the decadal warming trend for the globe, and right now it is so close to zero, even IPCC chief Pachauri admits there has been no significant warming for 17 years. Those climate scientists didn’t predict a global pause, they told us there would be 0.2C degrees of warming each decade at a minimum for the next few decades. They predicted a tropospheric hot spot and there wasn’t, and still isn’t, and they can’t explain it. The models didn’t predict the climate on a local, regional, or continental scale either. This focus on wild weekend weather is exactly what they told us was “unscientific” not so long ago, but now, it’s all they have.
Look who’s denying the data now?
Leigh Sales is very specific here. She wants a statement about the last “15 years”. She also wonders how today’s extreme events are due to a global temperature that is the same as 15 years ago. Good question.
Keep reading →
9 out of 10 based on 159 ratings
 There were not many long term sites (in black dots) in the centre of Australia in 1930. This summer the Bureau of Meteorology (BOM) invented a whole new metric to measure average national heat, which might be all very well except no-one (other than the BOM) seems to know what it is.
On January 7th the BOM claimed Australia set a new “average maximum daily temperature record”. Now the headlines are about the “hottest” Australian summer.
With both records, no one outside the BOM team has access to the methods or data. This post is about the new “daily” temperature of Australia used to declare Jan 7th was a record, but the same point applies to the “hottest summer” records, even though they may be a different data set. Where is the data? Where are the methods?
Is the BOM a science agency or a PR bureau?
The January 7th heatwave supposedly broke all previous “daily” records in this category — a dubious honor since no-one can remember any records like it.
It’s a bit like winning the Side-Jump. It’s not an event anyone knew was on until the medal ceremony. Worse, no one knows how the event was measured, even after the Gold Medal was given away, because the rules are kept secret.
Where are the methods?
It is good marketing. It isn’t science.
Chris Gillham and others asked the BOM and apparently a whole new historic analysis of daily temperatures (based on the AWAP station network) will be released soon. Hopefully it’ll be a fully digitised dataset back to 1911 that researchers can look forward to, but, once again, the bureau is scoring newspaper headlines with black-box procedures that are not complete enough yet to publish.
Is it so urgent that the public had to hear about “record” heat now, rather than after the calculations had been published and reviewed? It’s rather like the “compelling psychology research” (showing we’re all nutters) that still isn’t published six months after the headlines. No one can replicate it, check it, or point out the flaws. It is good marketing. It isn’t science.
The new “area daily average” comes from 700-800 records which sounds impressive. But as far as the independent audit team can tell, more than half of these have been operating for only 30 to 50 years. Our last major heatwave was 1939, not 1972, so many of those thermometers weren’t even recording temperatures the last time Australia got seriously hot.
How many thermometers have 100 year records? Just 16.
The brutally simple average of all the temperatures recorded at 721 weather stations on Jan 7th was 35.1C, not 40.3C. The extra 5 degrees is produced by a form of area weighting to average the thermometers over the entire nation. Most thermometers are located on the cool outside edge of Australia, not the hot middle of the country where hardly anyone lives. So there are not many thermometers with long records to average across the center.
The BOM team, quite realistically, needs to make up for the non-random way those thermometers are placed. But there are many ways to “average” the numbers and different datasets to use (like HQ, ACORN, AWAP). No-one suggests that the BOM ignored the 382 cooler stations within the 721 known to the audit team, but the average of the hottest 339 stations is 40.3C. Curious.
For most Australians on Jan 7th the heatwave averaged somewhere around 35C, not 40.3C.
To have any legitimacy with a new record, the BOM needs to publish its methods that explain how temperatures can be calculated every day over a hundred years from weather stations that in many cases didn’t exist. How else would we know it was a reasonable effort? We all know that tweaked black-box statistics could be used to achieve meaningless records that drive news headlines. Of course, the BOM wouldn’t stoop that low, would they?
Thanks to the independent team who’ve worked very hard to get as far through this as they did. – Jo
——————————————————————–
A GUEST POST by The Team
(Special thanks to Chris Gillham for collating thoughts, see below for the names of the independent non-aligned members who contributed).
What’s hot and what’s not: how did the BoM create its temperature record?
The Bureau of Meteorology claims that Monday, 7 January 2013, was the hottest day ever in Australia, based on an area-averaged calibration that took climate researchers by surprise.
As stated in the BoM’s Special Climate Statement on the extreme January heat: “Australia set a new record for the highest national area-average temperature, recording 40.33C and surpassing the previous record set on 21 December 1972 (40.17C)”.
Or as the BoM put it in its media release for public consumption: “On Monday the average maximum daily temperature record for Australia was broken at 40.33C. The previous record, 40.17C on 21 December 1972, was held for 40 years”.
From that it seems reasonable to assume that the national average maximum daily temperature was 40.33C on 7 January. Media reports quote the BoM as saying the temperature was estimated from the maxima of between 700 and 800 Australian weather stations. In its Special Climate Statement 43, the bureau corrects the national average maximum to 40.30C.
The actual maximum average
The independent research team (instigated through Jo Nova’s blog) thought they’d look at the average maximum at 721 of these stations where temperatures are publicly available.
Keep reading →
8.6 out of 10 based on 138 ratings
For all the non-hottest-summer in Australia talk.
…
7 out of 10 based on 16 ratings
Despite the wild hype about records being broken, and how hot this summer has “felt” for most Australians there have been many hotter summers, and for millions of people this summer was not remarkable at all.
The BOM is planting the unscientific suggestion it “felt warm” when thermometers in most major centres tell us it was just summer. The population of Sydney, Brisbane and Melbourne combined is almost 11 million. Nearly 50% of all Australians experienced an average to above average summer, but none of them experienced an extreme summer or a record hot season.
Since there are 100 different ways of measuring a “record”, could it be the BOM is cherry picking whatever record it can find, but ignoring all the non-records, the average measurements, and the ordinary heat?
Melbourne, hot but not extreme
In Melbourne there have been nine hotter summers, and two of those were more than a century ago. Those summers weren’t just a bit hotter. It was nearly a whole degree hotter (as an average of maximum summer temperatures) in 1898 and 1951.
 In Melbourne this summer qualifies as the tenth hottest. It was far hotter in 1898, 1951, 1981, and 2001
Much of the upward rise in Melbourne could be due to the Urban Heat Island Effect (UHI). Compare the slope of Melbourne temperatures to the country surrounding it. See John McLean’s page on UHI in Melbourne. (H/t to Warwick Hughes for the UHI point)
 Credit to John McLean for this graph.
“That the overnight temperatures in Melbourne are higher than those in most surrounding localities is a consequence of the city being under the influence of the effect of urbanisation (cities are usually warmer than their rural surroundings, especially at night, because of heat stored in bricks and concrete and trapped between close-packed buildings).”
Sydney had two hot days in an ordinary summer
In Sydney there have been 18 or more summers that were hotter than this one.
Sydney may have scored it’s hottest day ever, but it hasn’t been an extraordinary summer at all.
 In Sydney there have been 20 or more summers that were hotter than this one.
There were not many extreme hot days either in Sydney and Melbourne
Keep reading →
8.7 out of 10 based on 92 ratings
UPDATED: The Mann-Ball case is not settled yet. See below.
Christopher Monckton is cutting across Australia and leaving a wake behind him. He’s called for one Doctor’s deregistration, and one university Prof to be investigated for fraud. Today the VC from Uni of Tasmania has agreed do an investigation and “rigorously“. It is already having an effect. Below, Monckton answers the critics and explains why legal action is “the deadliest weapon”. He is after all, the man who took on Gore and won. He took on the BBC and won too. The Lord knows exactly why he’s doing this. How many prophets of doom will sit up and pay attention and think twice the next time they do a media interview? — Jo
PS: Don’t forget to see him in Perth next week, and Queensland the week after that.
“I am not prepared to sit back and let the liars, cheats and fraudsters win.”
Christopher Monckton
Why taking climate extremists to court works
 Christopher Monckton Christopher Monckton of Brenchley
One or two commenters on the postings about “Dr.” Helen Caldicott on the unspeakable ABC and “Dr.” Tony dePress at the “University” of Tasmania have whinged that one ought not to seek to get “scientists” struck off or dismissed just because they have flagrantly breached professional ethics, lied, cheated and committed scientific fraud.
Get with the picture. Going to court is the deadliest weapon we have against the extremists who have lied and lied and lied again to save the Party Line.
Lies have consequences. I spoke in the Hunter Valley last night. A mining engineer spoke up after my talk. His mine was having to pay an extra $1 million a year in carbon taxes. He will cling on for a few months in the hope that Tony Abbott, immediately on taking office, will zero the rate. Then, and only then, hundreds of workers’ jobs may survive.
From now on, it’s no more Mr. Nice Guy. If the various authorities to whom I have complained … fail to respond, the next thing they will get is court orders requiring them to reply properly, with costs and indemnity orders too
The agony on his face was palpable. Those who comment here should not allow themselves to think that the debate about the climate is a mere senior-common-room colloquy with no real-world consequences. Jobs, families, livelihoods are on the line.
I have seen that same fear and agony on the faces of miners, farmers, fishermen and property-owners throughout Australia. The carbon tax is shutting your nation down. The working guy is being hurt first and worst. He spends more of his hard-earned income on fuel and power than most. The carbon tax is a poll tax on the poor.
We have had some good court victories. In 2007 the London High Court condemned Al Gore’s mawkish sci-fi comedy-horror movie. It found nine errors so serious that the court ordered 77 pages of corrective guidance to be circulated to every school in England. The judge said: “The Armageddon scenario that he [Gore] depicts is not based on any scientific view.”
Two days later, Gore won the Nobel Mickey Mouse Prize. But he was holed below the waterline. Now he is seen not as a prophet but as a profiteer.
The whingers of the do-nothing brigade were at work even then. The lawyers refused to file the case on the ground that there was no chance of success. They were fired.
The new lawyers said we could not possibly win on the science and refused to use any scientific testimony. The judge threw the case out. I recovered the position by instructing the lawyers to write to the judge asking if he had even seen Gore’s movie before he had reached his judgment without holding a hearing.
Tellingly, the judge did not reply. I insisted on – and got – a new judge. This time the lawyers did what they were told. I wrote 80 pages of scientific testimony. Bob Carter and Dick Lindzen– bless them both – worked from the document in crafting their evidence, and signed off as expert witnesses. As soon as the other side saw it, they collapsed and settled, paying the plaintiff $400,000.
Going to court works because the Forces of Darkness know they will be cross-examined. They know their lies will be exposed. So they crumble.
Dr. Michael Mann, producer of the “hockey-stick” graph that abolished the medieval warm period, sued Dr. Tim Ball for calling the graph scientific fraud. Tim Ball’s defence was to propose showing the judge the many techniques by which Dr. Mann had done what Dr. Overpeck had called for in 1995: “We have to abolish the medieval warm period.”
Rather than face cross-examination, “Dr.” Mann gave up the case at a cost that cannot have been much less than $1 million.
————-
(UPDATE: The case is still running. Tim Ball advises me that Mann’s lawyer gave a partial Discovery on Friday as this was being posted which Monckton was unaware of.).
Mann writes:
“What is most peculiar about the false assertion that we ‘gave up’ the defamation suit against Mr Ball (it is very much alive and well thank you) is that this statement appeared on the very day that my lawyer, Canadian libel expert, Roger McConchie, was DEPOSING BALL as part of the discovery phase of the lawsuit.
[Jo notes that the case would be settled quickly if Mann provided the data, methods, and emails which all scientists and taxpayer funded workers normally provide. Science is a transparent process, why does anything about tree-rings need to be secret?]
————
I sued the BBC a couple of years ago when they did a hatchet job on me. I had been told – in writing – that I should have the chance to alter any points that were inaccurate. Fat chance.
So I lodged a High Court application for an injunction. The BBC’s first reaction was to deny that the director-general’s office had received my letter. Not having been born yesterday, I had delivered the letter myself and had insisted that the director-general’s personal assistant should sign for it.
I insisted on seeing the programme before it was broadcast. It was a disgrace. I wrote to the Director-General listing two dozen factual errors and numerous other biases in the schlocumentary. No reply.
So I lodged a High Court application for an injunction. The BBC’s first reaction was to deny that the director-general’s office had received my letter. Not having been born yesterday, I had delivered the letter myself and had insisted that the director-general’s personal assistant should sign for it.
The BBC crumbled and cut the programme from 90 minutes to an hour, taking out the overwhelming majority of the vicious nonsense. There were still some objectionable points, so I went into court.
I fought the case myself. When I introduced the two barristers and three solicitors for the Beeb, the judge interrupted me and said: “Lord Monckton, I fear I must draw your attention to a potential conflict of interest. You see, I am a member of your club.”
I had no objection and invited the BBC’s expensive QC to give his opinion. He had no objection either, but added: “Er, I too have a conflict of interest. I also am a member of Lord Monckton’s club.”
The judge did not prevent the Beeb from leaving a few barbs in my side. The BBC issued a lying statement that I had lost. But the judge held that I had “substantially won” the action. A 90-minute programme had become 60 minutes. The Beeb had lost. Big-time.
One interesting follow-up. The creep who made the programme had visited me in Scotland and asked me, on camera, about the medical invention that cured me of 25 years’ crippling illness four years ago. I had said it showed promise against various infections, but until we had done the clinical trials that are now in preparation we were not making any claims.
The creep said my answer was too long and complicated. He asked me simply to list the diseases the invention might be effective against. I said, “We have had some promising indications and, subject to clinicial trials, it is possible that we can cure [followed by a list of infections]”. The clip was edited dishonestly. What was broadcast was “We can cure the list of infections]”.
In no time an Australian climate extremist at Melbourne “University” had complained to the medical regulators in the UK that I was conducting unauthorized clinical trials. The complaint failed when I pointed out that the BBC programme had evilly tampered with what I had said, the extremist had lied in correspondence and, in any event, he had no standing to interfere.
From now on, it’s no more Mr. Nice Guy. If the various authorities to whom I have complained about la Caldiclott and “Dr.” dePress fail to respond, the next thing they will get is court orders requiring them to reply properly, with costs and indemnity orders too.
Then the police will be called in, and any regulator failing to investigate my complaints will be prosecuted as an accessory after the fact of organized, systematic fraud.
Now that I have seen and heard the heartbreaking stories of farmers driven off their land by crazed officials threatening to prosecuting them for shifting a rock; of fishermen tricked out of their fishing grounds by crafty bureaucrats asking them to nominate zones they did not want regulated and then regulating only those zones; of miners driven to bankruptcy as their industry dies; of householders having their electricity cut off because they cannot pay the monstrous carbon-tax-driven increases; of businessmen terrified that if they mention the carbon tax at all they can be fined $1.1 million; of the regime of terror in the countryside that has driven thousands of farmers off the land in the name of absurd environmental over-regulation; now that I have seen all this and more in just a few weeks, I am not prepared to sit back and let the liars, cheats and fraudsters win.
In most instances where I should like to help, I have no standing to intervene. But if the liars tell lies about me, if the fraudsters deny the scientific truth when I speak it, if the cheats make up baseless personal attacks on me, then I have the opportunity to fight back, not so much on my own behalf as on behalf of the silent, broken millions who cannot speak for themselves and whom your political class no longer bothers to represent. Someone must speak for them and fight for them. It may as well be me.
————————————-
Friday: Minor post editing has taken place for clarity.
—————-
Monday am – in light of the news about partial discovery the words fabricator, dodges and falsely were changed.
9.2 out of 10 based on 337 ratings
 Not a good news week for wind power. Not a good news week for wind power.
First windpower probably doesn’t produce as much electricity as people though it could. If the new estimates are right, humanity would need to cover 3 million square kilometers of the Earth to get just 10% of our electricity from wind. (And how many storms will that prevent do you think?) Could the “cure” be worse than the condition?
Second, it appears that wind turbines in the ocean might snap like matchsticks in particular conditions — conditions that are different for each turbine and at the moment, impossible to predict. The authors explain that it doesn’t have to be big waves or big storms — medium sized waves were the worst.
Windpower’s theoretical maximum isn’t what we thought it might have been
When we account for the wind shadows that large installations produce, at best, wind power may only give us 1 Watt per square meter (or 1 MW per square kilometer). According to this team our global energy needs are in the order of 30 terawatts, and one terawatt is one trillion (1012) watts. If that is the case, to to supply 10% of our global energy needs we’d have to cover… 3 trillion square meters or 3 million square kilometers.
…the latest research in mesoscale atmospheric modeling, published February 25 in the journal Environmental Research Letters, suggests that the generating capacity of large-scale wind farms has been overestimated.
Each wind turbine creates behind it a “wind shadow” in which the air has been slowed down by drag on the turbine’s blades. The ideal wind farm strikes a balance, packing as many turbines onto the land as possible, while also spacing them enough to reduce the impact of these wind shadows. But as wind farms grow larger, they start to interact, and the regional-scale wind patterns matter more.
Keith’s research has shown that the generating capacity of very large wind power installations (larger than 100 square kilometers) may peak at between 0.5 and 1 watts per square meter. Previous estimates, which ignored the turbines’ slowing effect on the wind, had put that figure at between 2 and 7 watts per square meter.
In short, we may not have access to as much wind power as scientists thought.
“If wind power’s going to make a contribution to global energy requirements that’s serious, 10 or 20 percent or more, then it really has to contribute on the scale of terawatts in the next half-century or less,” says Keith.
If we were to cover the entire Earth with wind farms, he notes, “the system could potentially generate enormous amounts of power, well in excess of 100 terawatts, but at that point my guess, based on our climate modeling, is that the effect of that on global winds, and therefore on climate, would be severe — perhaps bigger than the impact of doubling CO2.”
… Keith says, “It’s worth asking about the scalability of each potential energy source — whether it can supply, say, 3 terawatts, which would be 10 percent of our global energy need, or whether it’s more like 0.3 terawatts and 1 percent.” [Science Daily]
To go “100% renewable” with wind, we could convert, say, four countries to windfarms (pick four of these: US, Australia, China, Brazil or Canada).
Offshore wind towers have their own major problems
You would think the ocean is the obvious way to fill millions of spare square kilometers, but it is harder than it looks. This week one study suggests that offshore wind turbines may unpredictably break “like matches” when the right sized waves hit with the right pattern. It’s like the damage from resonance on a suspension bridge, and known as “ringing”. It is a problem that is hard to predict. It depends on how deep the water is, the solidity of the bottom, the slope, size of the tower, and the spacing of the waves. But no one is able yet to model that.
Keep reading →
9 out of 10 based on 73 ratings
 Coal power provides most of our electricity and despite widespread floods these plants have to keep working day in and day out to provide our baseload power. | This one above is the old decommissioned “New Farm” Coal Power Station (1942) | Queensland State Library Anton Lang cuts the numbers, and finds that while the Australian floods cut power consumption by 9% on the Eastern seaboard they only reduced CO2 emissions by 0.9%.
Even if cutting CO2 emissions was useful, it’s much much harder than most people realize. Electricity use is so pervasive that even though whole towns were off-the-grid due to floods, and real consumption fell, it didn’t make any difference to emissions. That’s because the baseload consumption is still so high, and is mostly still a coal powered load. Reducing the peak use of electricity by a whopping 9% hardly makes any difference to the total daily curve of electricity demand. The electricity for the peak load comes from natural gas, a bit from hydro, and some from intermittent unpredictable renewables. Coal can’t be switched up and down quickly, and it isn’t efficient to do so, even if it were possible to ramp up or change the massive coal-fired electricity stations on an hourly basis.
Here Anton wrote to me saying how surprised he was that, in the end, all those people who were cut off from electricity at home or at work during the East Coast flooding in January didn’t help reduce the Australian carbon footprint. This perverse result shows that many “green” energy saving projects are a waste of time. The only thing that counts are long term reliable reductions in baseload electricity.
Jo
Keep reading →
8.5 out of 10 based on 52 ratings
|
JoNova A science presenter, writer, speaker & former TV host; author of The Skeptic's Handbook (over 200,000 copies distributed & available in 15 languages).

Jo appreciates your support to help her keep doing what she does. This blog is funded by donations. Thanks!


 Follow Jo's Tweets
 To report "lost" comments or defamatory and offensive remarks, email the moderators at: support.jonova AT proton.me
Statistics
The nerds have the numbers on precious metals investments on the ASX
|


Recent Comments