The Mystery: The most resource rich nation on Earth has the highest electricity prices?!
Ask anyone and get confused: It’s poles and wires, gaming of the system by capitalist pigs, excessive taxes, privatization, and record gas prices. The CleanEnergy Council tells us that Australia has one of the longest electricity networks in the world — we need lots of poles! And so we do. But once upon a time Australia had the cheapest electricity in the world and we still had lots of poles. Not only were miles of poles and wires, there were also capitalist pigs, excessive taxes, and privatized generators. There were wild gas price spikes too, (during which we probably just burned more coal).
But of course, cause and effect are devilishly difficult. The one thing we know for sure is that even though sunlight and moving air is free, there is no country on Earth with lots of solar and wind power and cheap electricity.
Any day now, renewables are going to make electricity cheap, but when that happens, it’ll be a world first.
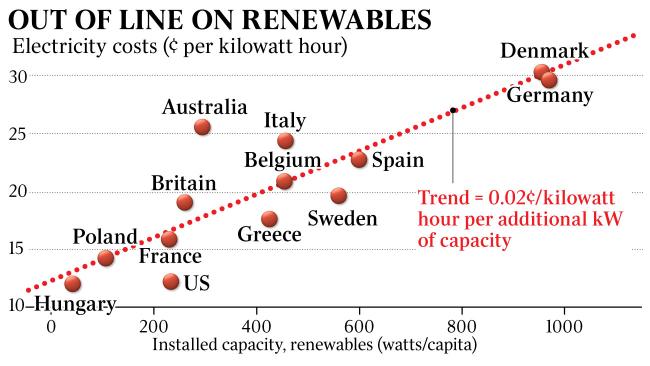
See the graph: the more renewables we have the more we pay…
The countries with more wind and solar power pay more for electricity.
Australia is far above the trend-line. Our electricity is even more expensive than it should be for the amount of renewables we have. At a guess this might be because other nations have more “hydro” in their renewable mix and less wind and solar. Or they have access to nuclear power (like all the EU countries). It may be made worse by the way our energy markets are managed, the profusion of bureaucracies, the subsidies and rebates, the renewable energy target, or the overlapping state and federal green aims. It also may be that in our smaller market we have a few big players gaming a volatile, complicated market. Stability may cost more here, due to the fragility of our network.
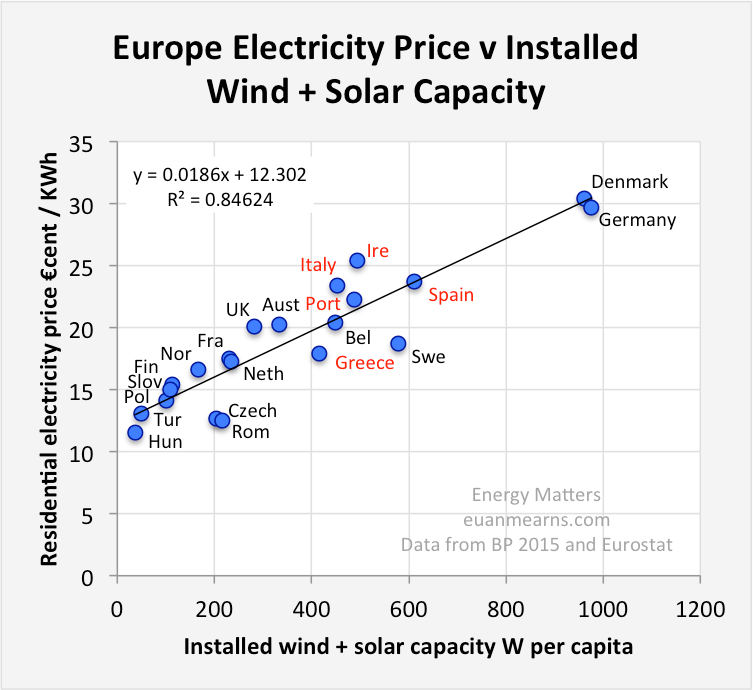
Figure 1 The Y-axis shows residential electricity prices for the second half of 2014 from Eurostat. The X-axis installed wind + solar capacity for 2014 as reported in the 2015 BP statistical review normalised to W per capita using population data for 2014 as reported by the UN.
As Euarn Mearns says, there’s more than one variable at work here, but the inescapable conclusion is the countries with the highest levels of renewables pay the highest prices. h/t Don B.
Is that another 10 cent price rise coming?
According to wikipedia our wind power capacity is set rise 250% or something crazy (I’m skeptical):
For a population of 24 million that means we would add another 500 watts/capita. Eyeballing the trendline in the graph, prices would rise by another 10c/KWhr. (Don’t try to unpack the x and y units exactly and calculate it. That’s another story.)
Say it again: there is no country on Earth with lots of solar and wind power and cheap electricity.
Hope foreign readers are enjoying the spectacle of a first world nation destroying its competitive advantage with renewables. Hope that helps you avoid the same fate.
Praise the lord, states without coal don’t have to load-shed-industry (because they don’t have much left):
“In terms of supply we should be okay,” he [the SA Treasurer] said.
“Victoria I understand is about to load shed industry. So they’re not coping with the power supply.
“They are a coal-dependent state and they are having to take industry offline to support their households. In South Australia we’re not having to do that today.” — h/t A H
The Treasurer didn’t mention that SA shed the load already over the last two years by driving heavy manufacturers out of business, and out of the state. Let’s name some:
Gone from the SA power load: Mitsubishi, GMH, Plastics Granulating Services (Recyclers), Caroma (76 jobs) after 79 years in business, Penrice, Arnotts biscuits (120 jobs), Aldinga Turkeys (79), ACI Glass (60 following previous 50 jobs), Arrium (600), BHP (90), SANTOS (~200), Alinta Energy (Pt. Augusta power stations and Leigh Creek mines) (438), Unibooks (100), United Dairies (>100). Plus many more…
Nor did he mention that when peak times hit, SA couldn’t generate enough electricity for itself, even at $14,200/MWh and was drawing around 350MW from Victoria (which was mostly coal fired).
ABC rent-seekers do free PR for Labor-Green-renewables:
The ABC political reporter Nick Harmsen, above, swallowed this one-sided Labor party fantasy, and didn’t bother to interview anyone (skeptic or industry) who knows what rot the Treasurer was speaking. Harmsen probably votes Labor (or Green), has been trained not to “seek balance” lest the public vote out the innumerate, expensive vanity-signalers (who also pump up the ABC budget) at the up and coming SA election.
I’m sure no one ordered him to toss his journalistic standards, but if he ever showed any talent for asking real questions it would have been quashed in the tea rooms, or, was pre-quashed at university, where everyone is trained to think the exact same way.
In masterful form, Harmsen described the Lack of Reserve level 2 (LOR2) notice as meaning “there is a small buffer of surplus left”. Nice spin-winner-way to put an emergency notice that is there to let the market know the buffer is frighteningly small, and far below recommended.
At LOR2 level, things are so bad, the AEMO is throwing our money at the electrical grid to keep it from crashing.
If only he had the internet or a phone he could have used the actual AEMO terms. At least he wouldn’t look like a PR hack instead of a journalist.
While geniuses are bragging that the Australian grid survived two normal hot summer days without falling over, they don’t mention the flaming spectacle of the cost.
Tom Quirk and Paul Miskelly, after a couple of suggestions from me, have calculated the full staggering electricity bill at $119m for SA and $267m for Victoria, making it nearly a $400 million dollar bonfire — for two days that were neither the hottest ever, or records for peak electricity use. See their work and details below.
To put this in perspective, a whole new gas plant could have been built for around $230 million. Instead of vaporising this money, Australians could have constructed one whole new gas generation plant, paid it off, and had money left over to give away free electricity.
Every household of four in Victoria just lost something like $170 of productivity for two days of electricity, and in South Australia, $280. Respectively, $45 per Victorian and $70 per South Australian. While businesses also share this burden, ultimately companies are made of people, and this is productivity lost to both states. The losers are shareholders, customers, and employees. Some will be interstate, but the pain flows back. The price is also paid in higher cost items, lower investment, and fewer jobs. Coles and Woolies still have to cover the cost of keeping the fridges running. The money will be squeezed out of citizens one way or the other.
And this is not the total bill, it’s theexcess electricity bill above and beyond the normal but inflated January prices of the last few weeks. Even normal prices now are twice what they were in 2015. Back then, the average price in Victoria and SA was $35 per megawatt hour and the average peak price was $49/MWh. Now the average on a January day are $82MW/h, and $87/MWh respectively.
But wait, it’s worse than that. Even above this excess electricity price, there is the price of buying the diesels (a secret ’til the $400m bill was revealed), plus the cost of all the businesses which bought their own diesel generators (aren’t we a first world country any more?), plus the cost of all the “Demand Response” — the mini blackouts required to stop the system breaking (more on that tomorrow).
Then, then, there is the awful cost of all the businesses that were affected — the stress, the lost production, the investments that won’t happen, and the bizarre spectacle of Australia not having enough electricity to keep the lights on at our hospitals. We are leading the way to the third world!
Ponder the bureaucrat brain that asked hospitals to turn off spare lights
Victorians were using nine billion watts of electricity at the peak on Friday. How much difference was it going to make to turn off some 100W lights at hospitals? (Aren’t they using the horrid blue-white sleep-destroying-LED’s, in which case, how many 18W globes do you need to turn off to save a state? It would take 2.7 million globes to get 50MW of safety margin). At this point, the people making decisions were either desperately afraid of a meltdown, or not very good with numbers. Either way, it’s bad. The message has gone out to the world that this leading vanguard of renewables doesn’t have enough electricity to run lights at hospitals. A “gift” to skeptics. (Yeah, thanks a lot).
Fergoodnesssake?! Why didn’t the SA government run those diesels — Could’ve saved millions?
Businesses everywhere were running their diesels. Yonniestone reports that ” Fairfax press rural Victorian factory had two shipping container sized diesel powered generators running complete with black exhaust smoke.” (They were probably printing newspapers telling everyone of the evil of fossil fuels, and advising they turn their air conditioners down.)
Can South Australia waste even more money? Yes. it. can.
Meanwhile, the SA Energy Minister seems proud that the diesels “weren’t needed”. Reader Andrew writes: What if they’re right, and while BHP et al turned on the diesel, Weatherill didn’t, to preserve his “battery miracle” story?? That would mean he has spent $400m on diesel – diesel that is purely decorative and he never plans to use! Electricity at $14,000 a MW? Not an emergency. Load shedding? Not an emergency. Businesses like smelters closed? Not an emergency. Economically, the diesel should be on whenever the price reaches $300/MW.
Stupid piled on stupid in the quest for virtue signaling. How much is too much to spend to “look green” and achieve nothing?
More than 800 properties in North Adelaide were blacked out just after 5pm on Friday. Businesses and pubs in North Adelaide were forced to close their doors on a night owners say would have been one of their busiest of the week.
Co-owner of Lion Hotel Tim Gregg said it was hard to have to ask customers to leave after the lights went out. “It is disappointing when you have got people booked in for a meal and you can’t call them because their details are in a system which doesn’t work when the power is out,” Mr Gregg said, sitting in the darkened and empty restaurant area which would have been just starting to fill if the power was on. “We have to ask people to leave because of OH and S issues. It is lucky that it was between lunch and dinner service but the bar would be losing in the thousands of dollars. Mr Gregg said he had more than 40 staff who were at a loose end until the power comes back on.”
Never forget the point of all this suffering. All these householders, spending up to two or three hundred on electricity for two days, are paying to make the weather nicer in 100 years, according to a theory that no official ever did due diligence on.
Hands up, who thinks residents would pay this kind of money if the government knocked at their door and gave them a choice? Anyone?
Analysis of electricity costs for 18 and 19 January heat wave
Guest Post by Paul Miskelly and Tom Quirk
The cost of electricity for the 18 and 19 January two day heat wave may be found from data on the AEMO website. For January there are half hour demand and price tables for each day. The extra cost of 18 and 19 January can be estimated by finding the cost differences from the average daily costs over the period 1 to 17 January after adjusting these costs to match the higher demand on 18 and 19 January.
The changes in prices can be clearly seen in the figure below with South Australia and Victoria having price spikes at the same time (AEMO data). New South Wales and Queensland had no such trouble.
….
The table below shows an estimate of the extra cost; The AEMO website dashboard gives average daily prices that are not weighted by the change of demand and price during the day. There are high prices with high demand and low prices with low demand. The costs have been calculated using the weighted electricity prices.
State
South Australia
Victoria
24 Hour averages
From
30 min data
AEMO*
From
30 min data
AEMO*
18 January
Average MW
2,016
6,444
Average price/MWh
$1,404
$1,074
$1,210
$905
Total day cost
$68,015,878
$187,279,332
19 January
Average MW
2,091
6,878
Average price/MWh
$1,195
$1,012
$648
$523
Total day cost
$59,917,331
$106,777,887
1-17 January week day average
Average MW
1,409
4,865
Average price/MWh
$91
$87
$84
$82
Total day cost
$2,865,478
$9,817,774
Total day cost
Scaled to 18,19 January demand
$4,177,600
$13,450,111
18-19 January
Extra costs
$119,578,009
$267,156,997
The total extra electricity cost is some $400 million. This is an amazing example of the problems resulting from the introduction of too much renewable energy and the closure of coal burning power stations.
___________________
UPDATE: Alan Moran discusses these costs at Catalaxy and argues that with extra coal back up, the loss of any one unit would not cause a price spike. As I mentioned, looking at those forecast graphs, the AEMO was predicting prices to hit the peak cap of $14,200 in SA, and $8,500 24 hours before the single generator failure at Loy Yang B.
Commenter David Bidstrup asks some valuable questions about the way our electricity bidding system works:
Why does the market call “bids” every 5 minutes instead of contracting for firm power over a longer period, say a year?
Who decides that “bids” of 160 times the going rate should be accepted when it is clear that they are just predatory bids made when the generators know the market is caught with its pants down?
When are those who “lead” us going to realise that their policies are destroying the country and making ordinary folk electricity paupers?
When will the leaders realise that renewables are the problem and not the solution, and when will they realise that there is no climate change problem to “fix”?
When will the realisation hit that the electricity crisis is a creation of stupid policy decisions and is a technical problem requiring folk who actually know something about power generation. It is not one to be fixed by intellectually challenged politicians, economists and pet scientists who push their own agendas, egged on by renewable rent seekers and rabid left wing greenies.
The physical market (i.e. the NEM) is set around 5 minute dispatch due to the need for supply to meet demand instantaneously. Contracting for longer periods of time occurs in financial markets either via over the counter agreements between counter parties or via the ASX electricity futures exchange. These markets are settled purely financially and while they influence what happens in the physical market, they are not a direct component of it.
The market decides. A true market however would not place price controls like in the NEM. High prices provide information to entrepreneurs to direct capital investment in the market (i.e. where to build more poles and wires and/or power plants). Labelling the behaviour of generators as predatory seems to imply they should be prevented by force from doing so. This will simply distort the market and lead to adverse outcomes.
Jo says:
The market is already hugely distorted by the RET and other subsidies. It’s not a free market, and will not act like one, and will not send useful price signals anyway. It’s predetermined to send the signal to close coal and open wind farms. It is “succeeding” for bureaucrats and renewables companies, but failing for consumers.
At the moment all the successful bidders are paid the price of the highest successful bidder. So it is in every bidders interest to have price spikes, and for the low cost supply to be insufficient. Why do we have that system? Is there any disadvantage in paying only the successful bidders exactly the price they bid?
*Correction:The per capita cost in SA is $70 per head, not $80 as first written. (Though for lots of reasons the real cost is far larger, but specifically, for these two days, it is $70pp. Thanks to Stephen H).
_______________
*AEMO estimates: These are the official AEMO costs, but they assume each hour is equivalent during the day. Quirk and Miskelly instead weight the charges according to the load each hour of the day to reach a more accurate average cost.
UPDATE: MELBOURNE hospitals are enacting emergency procedures to prepare for the potential loss of power. Hospitals are switching off non-essential electrical equipment, including some lights, to minimize energy use. This is a “Code Yellow” alert asking hospitals to check their back up generators are ready. The Victorian Minister insists this is not about the “threat” of blackouts, but because hospitals need to be “good corporate citizens”. Pull the other one. At the very least, this is about reducing electricity bills. h/t Chris in Hervey Bay.
See further UPDATES on “The art of blaming coal” at the bottom.
How much fun can you have? The AEMO (Australian Energy Market Operator) projects that as temperatures hit 42C in Victoria, prices are forecast to rise over 100 fold. The AEMO is furiously busy issuing market notices.
The ABC tells us it is 42C, that Portland Alumina has reduced production, but for an ‘undisclosed price’ (why can’t taxpayers know what they are paying this group, not to produce aluminium today?) Meanwhile the AEMO has put the RERT plan into action: “Under the RERT scheme, AEMO has contracted 884 megawatts of “demand side response” across Victoria, NSW and South Australia.” Translated, that means the AEMO has organised 884MW of controlled blackouts to prevent the system breaking. What’s the cost!
For the next three hours Victoria is short of reserve by an eye-watering 1090MW. There is an Actual Lack of Reserve, level 1 (LOR1): “The Actual LOR1 condition is forecast to exist until 1800 hrs. The contingency capacity reserve required is 1120 MW. The minimum reserve available is 32 MW. “ South Australia has been upgraded to a LOR2 (2nd level) requiring 350MW but having only 32MW available. (Why the exact same number?). The next level up, LOR3 would mean “unexpected load shedding blackouts are likely.“
These industries would not be shutting down and prices would not be this high if Hazelwood power station was still open, last March it was producing 1,400MW at $30/MWh.
Total NEM demand is just about 30,000MW, but this is far from being a record high (which I recall as being around 35,000MW). Fossil Fuels are producing 25,000MW of the total, or 83%.
Or you can watch the state level electricity flows. Right now SA — the leading international star of renewable energy — is getting 350MW from Victoria, which is in turn, getting 700 MW from NSW and Tasmania. Queensland is sending 1,000 MW to keep the rest of the grid alive. Look at those prices! Tasmania, through some miracle of government run markets, is paying people to take electricity during these highest peak, most valuable hours of the year, when every other generator is about to earn millions.
Go figure?
…
Apart from wasting millions of dollars, the Australian NEM might get through today just fine. But if anything goes wrong…
Australian Electricity Generation by source:
Questions for the crowd:
What were the highest MW peak demand days for the whole NEM and individual states ever recorded?
How much will SA energy companies pay for electricity this afternoon?
Who will calculate the total cost for electricity, for paying people to not use it, for lost productivity, for lost opportunities (companies that wouldv’e but now won’t invest in Victoria or SA and the jobs lost)?
The art of blaming coal
In the news at the moment people are saying coal is unreliable. But in the current bipartisan hostile anti-coal government scene — who would invest in and repair old stations? The rest of the world is building new coal. Only in Australia is there a bizarre subsidy-bubble where renewables make more “sense”. (OK, sorry, obviously the UK and Germany — also bonkers. Probably Spain, Italy, Denmark too.)
TonyFromOz points out that only 3 of 49 coal units are out of action:
Australia has 16 coal fired power plants and 49 Units at those plants. Currently, just three of those Units are off line. One is Liddell Number Two, now down for more than seven Months, and I have questions whether it will ever come back on line if the plan is to close the plant down, so why would they bother fixing it back up and realistically wasting the money if they plan to close it down. Then there are two Units in Queensland down, one at Gladstone and the other at Kogan Creek.
So, that takes 1520MW out of the system. That leaves us with the total Nameplate for the remaining Units at 21500MW.
Yesterday at around 4PM, just on Peak Power time, those 46 Units were generating 20200MW. So, they were, all of them, running virtually flat out, generating at a Capacity Factor of 94%. Barring a few plants in Queensland, all of them are older than the best case hoped for lifespan of 25 years for wind plants.
Cole Latimer — The Australian Energy Market Operator has kicked off emergency measures to protect power supply after Victoria’s Loy Yang B brown coal-fired power station failed on Thursday afternoon, sending electricity spot prices soaring.
As temperatures rose around southern Australia Loy Yang B’s generators failed at around 4pm, instantly taking around 528 megawatts of energy out of the state’s grid.
The price rises to the cap were predicted by the AEMO yesterday before Loy Yang B’s generator problem. The prices simply did what the AEMO said they would. How can this be due to coal power?
LOR1 – Lack of Reserve: The safety margin is smaller than it should be, but services won’t be affected (as long as nothing breaks).
LOR2: Things are even more marginal, and services will (hopefully) not be affected. The AEMO can start bringing in diesels and “demand response” type activities. (ie. This costs real money).
LOR3: Even more serious, and load shedding is possible.
Today things are not running smoothly in the green states of Victoria and SA where prices this minute have hit $14,000 per MW hour, or $14 per KWh. These are wholesale prices. Right now heads of major industries are watching the dashboard, turning off everything they can turn off, or switching on the diesel generators, or counting hundreds of thousands or even millions being added to their bills if production cannot stop.
Demand Management schemes (a form of load shedding) will be running to reduce demand — air conditioners will be remotely switched down.
How much of the productive brain power of Vic and SA is distracted from more useful tasks today?
With a few hot days in a row, as buildings get warmer and tempers get shorter, people use more electricity. Hence even if temperatures don’t rise, the longer a hot spell goes, the higher the electricity demand.
This is the 30 minute graph including price and demand, and the forecasts for tomorrow. As far as I can tell, often the shocking forecasts which look like being 3 solid hours of $14,000 electricity will instead resolve to smaller shorter spikes. But millions of dollars of productivity is likely to be burned.
Victoria
Times here are Western Standard Time 3 hours behind actual. (It’s an unhelpful thing the AEMO site does).
In SA:
Times here are Western Standard Time 3 hours behind actual. (It’s an unhelpful thing the AEMO site does).
Even if you don’t use Twitter or Facebook, you need to know this. If you disagree with big-government intrusion and rampant corruption, these dirty tricks are working against you, though you may never have sent one tweet or opened a facebook account. They’re stopping the thousands who agree with you from meeting, organising, helping each other, and generally clawing back power from the deep state. We’ve known about Google bias for years, but there are so many other ways to suppress a good idea.
How do you know you’ve been shadowbanned? You may be tweeting, but you’re no longer being heard. You wonder if maybe people just aren’t interested in what you have to say.
But they might be interested. Twitter just isn’t interested in letting them read your messages.
Shadowbanning is the censorship that social media companies do in the shadows. It’s cowardly and dishonest. And it’s how the big firms get away with covertly censoring conservatives.
“The idea of a shadow ban is that you ban someone but they don’t know they’ve been banned, because they keep posting and no one sees their content,” Abhinav Vadrevu, a former Twitter employee, explains in Project Veritas’ undercover investigation of the company.
“They just think that no one is engaging with their content, when in reality, no one is seeing it.”
Twitter employees are so closeted (and selected) they have no idea that real people may even be patriots who talk about guns, flags, or the cross. Algorithms pick up these words, and “delete accounts that twitter employees think are bots. ” Some Social Justice Warriors (SJW’s) may never have met an outspoken patriot.
Today, as you read this, my website Right Wing News is shutting down operations. It has been around since 2001, but became massive a few years ago because of Facebook. …
In July of 2015, in just a week, the Right Wing News Facebook page reached 133 million people. Because conservatives were sharing content they were interested in, little ol’ Right Wing News … was driving the same amount of web traffic as some of the biggest newspapers in America.
Facebook bleeds groups dry slowly:
…what Facebook giveth, Facebook can take away.
…Facebook systematically, methodically reduced the reach of all its pages with each algorithm change. By then, most of us understood where it was going long-term. If Facebook killed every conservative page overnight, there would be a huge outcry. On the other hand, if Facebook slowly strangled us to death, we’d fade away and would people even notice? …
As someone who has been working for a living in this business since 2005, let me drop a little truth bomb on you. We are now in a very oversaturated, corporation-dominated media environment. If you don’t already have a legacy website that captured traffic years ago and held onto it, huge traffic you can bring in from elsewhere, or millions of dollars to spend, your chances of getting a political website off the ground today are infinitesimal. …
Except Facebook has for all intents and purposes announced that it’s killing off pages. So much for having a conservative voice there.
Youtube is demonetizing conservatives and libertarians:
Dennis Prager’s PragerU is suing YouTube for exactly that reason. Just to give you an example of the sort of content YouTube thinks is over-the-line, here are some of the videos it demonetized: Why America Must Lead, The Ten Commandments: Do Not Murder, Why Did America Fight the Korean War, and The World’s Most Persecuted Minority: Christians.
Of course, YouTube would claim that it’s not censoring the videos because it didn’t take them down. However, people are not going to spend large amounts of time and money putting together high-production-value videos if they’re not going to be allowed to make money on those videos because of their political beliefs. …
These giant monopolies are staffed and owned by people who really do despise you:
Many of these companies effectively became monopolies because they worked hard to serve ALL of their users. Now that they completely dominate their spaces in the marketplace, their liberal political views are impacting their services. As Robert Conquest once said, “Any organization not explicitly right-wing sooner or later becomes left-wing” and that is a much bigger threat than most conservatives realize. …
We’ve already lost the schools, Hollywood and the mainstream media. What happens when you can’t get out conservative opinion via social media because they block, shadow ban and demonetize everyone who gets any traction? What happens if they put rules in place that essentially make expressing conservative opinions something that gets you kicked off their service? You’re pro-gun? Sorry, not allowed. You don’t like gay marriage? Get out of here. Criticizing Black Lives Matter? Out of bounds! We can hope for the best, but that seems like the future we’re headed toward and it’s one that will leave conservatism weaker than ever.
Fight back, spread the word. First we make sure everyone knows. Then we find alternatives and take back the schools, the movies, and grow the alt-media. Despite all this concerted, organised, dirty-work, Trump still won, over half the population in western nations are skeptical, and the extreme left have parked themselves far out on bizarre, indefensible ideas. Windmills won’t hold back the tide, and almost no one believes they will. The bubble will pop, it’s fragile, which is why the deluded and rent-seeking are working so hard to stop the sensible masses from even talking to each other.
They are ripe for the mocking, and we still have free speech.
h/t David E
Shadowbanned through their own home P.C.,
In ways that the user can’t see,
With communication denied,
To sympathizers worldwide,
On the whim of the Left or Leftie.
–Ruairi
* * *
PS: I’m a slack slack tweeter (four months between messages). I don’t think my tweets are being blocked. If you “follow me” @JoanneNova, can you check now, and find a way to let me know if you can’t see the tweet today in your account? Thanks.
The electric car push is on. Sadly, what people save on petrol bills looks like it’s going to be spent on electricity or tax.
Steve Goreham outlines the international push to get our cars and heaters electrified. But the dark alter-implication of electrification is renewables. (No point in driving a coal driven car.) It follows then, that electrification of everything that isn’t already electrificated, will mean more solar, more wind, and then more decimal places on your electricity bill. Welcome to the Bermuda triangle of cost savings in a subsized-mandated-unfree-market. The more you save, the less you have.
We all know wind power is “free”, but somehow costs seem to keep rising in places with more wind power. It’s so unfair:
Inconvenient Factoid: Electricity prices in most top “wind” powered US states rose 2 – 7 times faster than in other states
Read and weep Australians. Pedal faster:
“…on average US electricity prices increased less thanfive percent during the eight years from 2008 to 2016″
Some US consumers are still paying rates in single digits.
For contrast, the Australian situation, is pathos and bathos simultaneously:
Australian households are paying 60 per cent more for their power than those in the US and double their Canadian counterparts after enjoying the third-lowest electricity prices of any OECD nation a decade ago. — Simon Benson
See the graph. Please someone tell me why Texas prices have fallen. Is that shale oil I see? Wikipedia tells me “Texas produces the most wind electricity in the U.S., but also has the highest Carbon Dioxide Emissions of any state.” Ahhh. — Jo
UPDATE: From comments below and from Goreham — Texas electricity is deregulated, so competition is fierce, and obviously it also has shale.
“Electrification” is the new buzz word touted by climate fighters and environmental groups. Where electrification once meant providing electricity to people, today it often means elimination of traditional fuels. But the only tangible result of green electrification policies will be higher energy prices.
Proponents of electrification intend to force transportation and heating and cooling systems to run on electricity, and eliminate the use of hydrocarbon fuels. Electric cars, electric furnaces and water heaters, and heat pumps must replace gasoline-powered vehicles and gas-fueled appliances. In addition, wind or solar systems must supply the electricity, not power plants using coal or natural gas, in order to reduce greenhouse gas emissions.
California’s 2017 Climate Change Scoping Plan calls for a 40-percent reduction in greenhouse gas emissions by 2030 and an 80-percent reduction by 2050. Goals call for 4.2 million plug-in electric and plug-in hybrid cars on California roads by 2030, up from about 300,000 today. The plan also calls for electrification of space and water heating.
Utility Southern California Edison (SCE) recommends an even more aggressive plan. The SCE “Clean Power and Electrification Pathway” plan calls for 7 million electric cars on California roads by 2030 and for one-third of state residents to replace their gas-fired furnaces and appliances by 2030.
Nine other states promote adoption of electric cars as part of a broad electrification program. New England states are exploring “strategic electrification” in order to meet tough emissions reduction goals. In most of these efforts, cost to consumers is rarely discussed.
Graph, increase in costs of electricity in wind powered states of the USA.
Electrification has become a global quest. Germany, Netherlands, Norway, and the United Kingdom propose to ban sales of internal combustion engine cars by 2040. The Dutch government proposes to eliminate gas as a source of heating and cooking from all homes by 2050. Amsterdam, Rotterdam, and Utrecht announced intentions to become “gas-less neighborhoods.”
Perth is set to become the world’s first ‘Ghost City’ according to a long-term weather forecaster and a news anchor. “I’m reading here that unless drastic action is taken, Perth could become the world’s first ghost city – a modern metropolis abandoned by the 1.7 million people there for lack of water,” she said.
As I write, the remnants of a small cyclone are raining down on us in midsummer, which the ABC earlier warned was a “deluge” dropping “three months of rain”. What they don’t mention is that, even before this “downpour” (of 90 mm or 4 inches so far), Perth Dams already have 35% more water than at the same time last year, and an extra 69 gigalitres of the precious wet stuff. We have more water than we’ve had since 2009, and more is on the way.
So far in the last 24 hours we’ve had 90mm, which is unusual for Perth in summer, but hardly a “deluge”. Perhaps that’s why the ABC changed their headline.
The Water Corp says 70 Billion Litres is Nothing to See Here…
You might think this was “good”, but the WA Water Corporation helpfully explains that this extra 70 billion litres is “little”, “slight” and may not even be from rainfall, (though those figures are strangely unavailable):
What does this mean?
Our metro dams are currently holding 35%more water
than this time last year.
Perth’s recent rainfall is welcome but it has made little difference to our dam levels. While it may look like dam levels are increasing slightly at this time of year, this may not be the result of increased streamflow. The water in our dams is no longer just made up of inflows from rain. Groundwater and desalinated water are stored in these dams during periods of low demand so it is available when it is most needed in the hotter months.
And if that extra 70GL is not from rain, somebody tell me why we might be pumping groundwater or adding expensive desalinated water into our dams in a year with average rainfall?
Rivers in the southwest region of WA are struggling to cope with the impact of climate change despite average winter rainfalls returning to the area.
Got more rain than usual? That’s climate change:
Mr Kelly said the February rainfall was another example of climate change where more extreme and unusual weather is predicted.
“River flows are one of the best indicators for measuring the effects of reduced rainfall,” he said.
Because when you get extra rainfall we need to talk about the effects of something that didn’t happen.
“What this year shows is there is no escaping the impact of climate change, which is not only reducing flow to our water supply dams but to our rivers as well.”
Another effect of climate change is that journalists will write self-evident contradictions, internally inconsistent stories, and general click-bait meaningless climate drivel. The well of nonsense is deep and no end is in sight, no matter what the climate does.
And general climate noise can always provide mindless cherry-pickable truthisms:
By Crikey! Birds are deliberately using fire as a tool. Humans are not the only animals on Earth setting things on fire.
Aerial arsonists are on the loose. Sneaky Australian raptors have been spotted picking up burning sticks, or even stealing them from a campfire and then deliberately dropping them on grass so they can feast on rodents fleeing from the fire. Apparently they do this in hunting packs, and will drop the burning stick half a mile away on the far side of waterways or roads. Aboriginal people have been talking about this for years, but no one quite believed it.
This really puts a spanner in the works of the fire management plans. So much for firebreaks.
Someone is going to have to get these birds to apply for permits.
Australian raptors can spread fires. Credit: Bob Gosford
Three species of raptors — predatory birds with sharp beaks and talons, and keen eyesight — are widely known not only for lurking on the fringes of fires but also for snatching up smoldering grasses or branches and using them to kindle fresh flames, to smoke out mammal and insect prey.
Dick Eussen thought he had the fire beat. It was stuck on one side of a highway deep in the Australian outback. But it didn’t look set to jump. And then, suddenly, without warning or obvious cause, it did.
Eussen, a veteran firefighter in the Northern Territory, set off after the new flames. He found them, put them out, then looked up into the sky.
What he saw sounds now like something out of a fairy tale or dark myth. A whistling kite, wings spread, held a burning twig in its talons. It flew about 20 metres ahead of Eussen and dropped the ember into the brittle grass.
And the fire kicked off once again.
All told that day, Eussen put out seven new flare-ups, according to a research paper published recently in the Journal of Ethnobiology. All of them, he claims, were caused by the birds and their burning sticks.
What’s more, the paper argues, the birds might well have been doing it on purpose.
According to the team, firehawk raptors congregate in hundreds along burning fire fronts, where they will fly into active fires to pick up smouldering sticks, transporting them up to a kilometre (0.6 miles) away to regions the flames have not yet scorched.
“The imputed intent of raptors is to spread fire to unburned locations – for example, the far side of a watercourse, road, or artificial break created by firefighters – to flush out prey via flames or smoke,” the researchers write.
Live Science:
Scientists recently collected and evaluated reports from Aboriginal and nonindigenous people of these so-called firehawks — black kites (Milvus migrans), whistling kites (Haliastur sphenurus) and brown falcons (Falco berigora)
The range of the birds’ reported fire stealing spans a significant area measuring approximately 1,490 by 620 miles (2,400 by 1,000 kilometers) across part of northern Australia, the scientists reported.
From their reports, a behavioral pattern emerged: Firehawks (also described as kitehawks, chickenhawks and, on several occasions by non-Aboriginals, s—hawks) purposely swiped burning sticks or grasses from smoldering vegetation — or even from human cooking fires — and then made off with the brands and dropped them into unburned areas…
Mark Bonta, Robert Gosford, Dick Eussen,Nathan Ferguson Erana LovelessMaxwell Witwer (2017) Intentional Fire-Spreading by “Firehawk” Raptors in Northern Australia, Journal of Ethnobiology Dec 2017 : Vol. 37, Issue 4 Special Section: Birds II, pg(s) 700- 718 https://doi.org/10.2993/0278-0771-37.4.700
Now temperatures on Venus reach 250°C with powerful 300mph winds. Hawking says a greenhouse effect burned the planet’s oceans and lands, and that something similar could happen right here on Earth if climate change continues unabated.
“Next time you meet a climate-change denier, tell them to take a trip to Venus; I will pay the fare,” says the physicist in his show.
Sadly, Hawking is an atmosphere-denier. Venus’s atmosphere is ninety times denser than the Earths. The lapse rate* just goes on and on through 60 kilometers of “air” and Venus ends up with a 467 degree surface, just like Earth would if it had an atmosphere this thick. (See these calculations.)
When Hawking yells “Venus”, I yell back “Mars”. Both have atmospheres of 95% CO2, but one is 467 degrees and the other is minus 40. Hawking may say “but the Martian atmosphere is thin”. I would say “Exactly“! It’s not the percentage of CO2 that matters most, it’s the thickness of the atmosphere.
On Earth, to get the same atmospheric pressure you need to get down about a kilometer below sea-level or 50 kilometers down a mine shaft, which is 40 kilometers deeper than anyone has ever dug.
Hawking can save himself the money for my fare to Venus, and get himself a ticket to Mars. He wants to go to there anyway, so I’m doing him a favour.
Compare the outrage: Germany abandons carbon target, but stays in Paris agreement. US abandons Paris, but makes actual “carbon” cuts. One of these nations is a global pariah.
— a potential embarrassment for Chancellor Angela Merkel.
Oh.? Well, it’s only dates and numbers anyway:
Instead, they would aim to hit the 40 percent target in the early 2020s, the sources said, adding that both parties are still sticking to their goal of achieving a 55 percent cut in emissions by 2030.
Which is more important, paper promises you don’t keep, or lower outputs of “planet destroying gas”? Nevermind about CO2.
In the past year alone, more than 2,000 employees in this sector have lost their jobs. Locations like Carbon Rotec in Lemwerder or Powerblades in Bremerhaven have been closed. The Hamburg wind turbine manufacturer Senvion had to go 660 full-time employees. Nordex , the second large wind power company based in the Hanseatic city, wants to cut up to 500 jobs due to eroding profits. And Enercon, the German market leader with more than 20,000 employees worldwide, recently announced “unpopular measures” to cut costs.
Read the article. Try to explain the problem in 25 words or less. As far as I can tell, for some reason, the German government cannot design enough loopholes to allow this revolutionary, cheap, technology to make a decent profit.
Tony Thomas has unearthed a ten year old document that reads like a wet dream for mini-climate dictators. It envisages, by 2028, that the first climate skeptics will be convicted of denying the existence of climate change and exiled to three penal colonies in, wait for it, Kerguelen Island, South Georgia and New Zealand’s South Island. Magically, these are “International convict settlements.” So it’s globalist prisons for the deplorables who say unpermitted things, because they are so bad, we wouldn’t want them mixing with normal criminals back home who believe in climate change but rort the carbon markets.
Luckily their fantasy fiction is even less accurate than climate models. By 2030 they are tipping Africa as an economic powerhouse:
2030 … the global economy today is less dominated by the big three of China, India and the US. Instead, economic blocs such as the African Union, the Latin American Trade Council and the Alliance of Turkic States have emerged as powerful players on the scene.
As Tony Thomas points out they also estimated oil would rise from $150 in 2008 to $400 by 2022. So far it has risen all the way to $60. They also predicted a global depression in 2009-18. Instead we got “Dow Record highs “. I guess they didn’t see Donald Trump coming either.
And by 2020 they predict that not only will there be no snow in the Northern Hemisphere, there will be “No more Winter.” Though I expect Canadians and Americans are disappointed to know that five feet of snow can still fall in a New Year “spring”.
This dream is so wet it should come with flood warnings:
“In most cases this [emissions control] has happened gradually, ratcheting up over time, with citizens surrendering control of their lives piecemeal rather than all at once, as trading regimes, international law, lifestyles and business have responded to the growing environmental crisis.
“Expensive, state-funded information campaigns reinforce the need for changes to lifestyles and aim to keep the mandate for state intervention strong. Inevitably parallels are drawn between this and the authoritarian state propaganda of the twentieth century.
“‘Climate crime’ is a social faux pas everywhere, but in some countries it is a crime to publicly question the existence of anthropogenic climate change or to propose actions that could in some way contribute to climate change.
“It is very rare to come across dissenting voices with any real power, but resistance to overly strong state intervention is occasionally violent. The media in some countries has been permitted to discuss …
The climate futures fantasy would also look like manna for simple sheeple who ache to get off the treadmill, grow kale, and tye-dye hemp shirts, but don’t have the balls to go do it unless everyone is forced to join them.
As loopy as this sounds, look at the list of supporters?
Go to Wikipedia and download the Forum for the Future Report and financial statements for the year ended 31 December 2014.
Take a look at the long line up of virtue signalling, pecksniffian actors ….
Grant funders and major donors
Benindi Fund
C&A Foundation
Calouste Gulbenkian Foundation Economic Development Board Singapore The Esmée Fairbairn Foundation
The European Commission
The Sainsbury Family Charitable Trusts The Shell Foundation
Pioneer partners and US founder partners
Bupa
The Crown Estate Ecover Belgium NV Ingersoll Rand Kimberly-Clark Europe Kingfisher
Marks & Spencer
O2
Sky
Target Corporation TUI Travel
Unilever
Network partners: worldwide
3M United Kingdom Aggregate Industries Aimia
Air New Zealand AkzoNobel NV Alliance Boots
Arriva
Associated British Foods
Aviva Investors
Capgemini
Carillion
Cathay Pacific
Certis Europe
The China Navigation Company Colep
Penrith may have recorded 47.3C for at least one-second this week, but Windsor is only 23 km north-east of Penrith, and on January 13th, 1939, it recorded 122F or 50.5C with an old fashioned liquid thermometer, not a modern noisy electronic one.
Apparently, climate change makes our extreme heat less extreme.
Furthermore, this was not measured on a beer crate in someones back-yard, but on the historic Windsor Observatory which was built in 1863 by John Tebbutt F.R.A.S who had discovered The 1861 comet, and published many scientific reports in Astronomical Journals. His meteorological observations are published at Harvard in 1899 (among others). Tebbutt died in 1916, so it’s not clear what instrument the 122 F was recorded on in 1939, but a Stevenson Screen had been installed around 40 years earlier, and the measurement was made by Mr Keith Tebbutt, presumably his son.
In 1939, I doubt either town was considered part of Sydney. But now both are on the metro network. Penrith is 54km from the CBD, Windsor, 56km. Notably, Windsor is a few train stops closer than Richmond, which the BOM acknowledges recorded 47.8C in 1939 on January 14, three days after the high of 122F recorded at Windsor.
Apparently Penrith that particular day, January 11th, was 110F, while Richmond was 115F or 46.1C. Neither Penrith nor Windsor appear to be recognised in BOM climate records.
Extreme heat of long ago — 48.2C (118F) at Windsor in 1896:
So in 1896, as recorded in an old liquid in glass instrument, temperatures were very similar to 2017, as recorded with an electronic sensor. The old thermometer was probably reading a bit high in a Greenwich Screen, but the new thermometer is reading a bit high due to electronic noise.
It follows then if the BOM was interested in our climate history, they could build side-by-side models and figure out how to compare these historic records. That they don’t — when climate is the Biggest Threat To Human Civilization — tells us all we need to know about how interested the BOM is in the climate history of Australia.
Imagine if Tebbutt’s 40 years of records from the late 1800s showed a cooler climate? Hands up, who thinks studying them would have been a hot topic for Australian PhD students…
Note the Stevenson Screen and Greenwich Screen side by side at Windsor Observatory in 1906. h/t Daily Telegraph.
More extreme heat — 117.1 F was recorded in 1878
Yesterday (Sunday) the shade temperature at this Observatory reached 116.8 degrees, or the same as that attained on the 6th instant. To-day, however, the maximum recorded was 118.8degs, the highest experienced here since 1862. The next highest was recorded in 1878 when the thermometer registered 117.1 degrees. During the 33 years of my experience I have never till today recorded as high as 100 degrees at 9 o’clocka.m. At that hour this morning the reading was 102.8 degrees, and at 6 o’clock this evening the temperature had not sunk below 105 degrees.
From what I have stated it will be seen that the heat of to-day is quite phenomenal.
— JOHN TEBBUTT. The Observatory, Windsor, January 13, 1896.
Old Windsor Observatory — more scientific than the modern BOM?
At Windsor the old Greenwich stand was employed ever since 1862, while at the College the thermometers are enclosed in a Stevenson’s stand. I suggested that a Greenwich stand should be placed beside the Stevenson’s stand and a series of comparisons be made with both modes of exposure in order to get an equation .
Tebbutt made comparisons between Greenwich stand and the Stevenson, and published them, putting him ahead of the current $365 million a year Australian Bureau of Meteorology which has not published side-by-side comparisons of the two main thermometer types currently in use:
In accordance with the suggestion recorded on page 17 of the last Annual Report, I have had constructed a Stevenson’s themo- meter screen exactly similar to that employed at the Hawkesbury Agricultural College. It has been placed beside the old Greenwich stand employed at this Observatory during the past thirty-eight years, and a series of themometer comparisons is now being conducted in order to get an equation between the results derived from the two methods of exposure. I trust to be able to give, in my Report for 1901, a table embodying the results of these comparisons. The readings in the Greenwich stand are, as anticipated, considerably higher than those in the Stevenson’s screen.
It’s hard to tell, but as best as I can make out from an unformatted text page, at very high temperatures — over 100F, the Greenwich screen recorded temperatures about 2-5 F higher. (I’d like to see the original, can anyone help find it?)
The decrepit legacy media is now so low there are competing stories in the same week discussing which form of decay is the worst.
Is it that the media suppresses the good news, or that it amplifies the bad — throwing fake mud that is never cleaned up? It’s two sides of the same corrupt, self serving coin. Pass on these links to friends who think the legacy media still has journalists with , a) a backbone or b) ethics.
Here are headlines you won’t read in almost any major American newspaper, hear on any of the evening news programs, or see in your Yahoo “news” feed:
Dow Hits 87 Record Closes Since Trump Elected
Texas Hero Was NRA Instructor
Dow Reaches Four 1,000 Point Milestones in One Year for the First Time Ever
ISIS on the Run, Almost Completely Destroyed
New Home Sales Highest in a Decade
Texas Hero Uses AR-15 to Save the Day
Dow Hits Two Streaks Lasting More Than Ten Days, First Time Since 1959
Trump Donates One Million Dollars of His Own Money to Hurricane Victims
U.S. Economy Gains Over Six Trillion in New Capital
U.S. Senator Viciously Attacked by Deranged Socialist Neighbor
U.S. Economy Grows at 3% for First Time Since Bush Administration
Unemployment Rate Lowest in 17 Years
h/t David E.
Smear: Toss enough fake mud and make anything dirty
Sharyl Attkinson describes the abject decay of journalistic ethics as opinions become fake facts, and mistakes are rarely corrected. A Prager video. Thanks to MichaelSmith news. “Why no one trusts the mainstream media anymore”
The BOM announced it was the hottest ever day in Sydney today, then realized it had it wrong, but not before headlines spread across the country. For a million dollars a day you’d think the BOM would check their own “high quality” database. A scientific agency would take great care before announcing “historic all time records”for a city of five million people. A shameless PR agency might see that sort of mistake as an advantage.
It’s careless, piled on rank neglect
Even if the day had been “a record”, the temperatures are often artificially inflated due to site changes, thermometer changes, and the one-second-record effect thanks to the introduction of electronic thermometers, all of which are a product of careless BOM management and analysis. And even over and above that, past temperatures have been adjusted or homogenised downwards — often years after they are recorded — and by secret methods that the BOM will not disclose. I’ll have more information soon on changes at Sydney Observatory, that the BOM don’t make any allowance for.
Looks like another one second record?
The BOM announced the record after Penrith hit 47.1 at 1:55pm, the BOM tweet wrongly claimed it had “broken the all time maximum temperature record for … the Sydney Metropolitan area”. Later, they updated that Penrith was 47.3 at 3:25pm. They did not mention that the observations showed that five minutes after the first “record” at 2pm it was only 46.0, so temperatures fell as much as 1.1C in five minutes. Again, five minutes after the second at 3:30, temperatures fell to 46.5. How long did the 47.3 record last? It might have been just one single second.
The half hourly readings are marked in red. The “one second records” that the BOM uses for historic data and newspaper headlines are marked as stars.
…
From 1859 until 1990, mercury and alcohol thermometers could not possibly produce “one second records”. For 130 years, they missed all this noise. The BOM may be only scientific institute in the world that doesn’t seem to know the difference between electronic buzz and slowly expanding liquids in glass. And they appear to be working to keep it that way — the comparison data that would show the difference between old thermometers is being destroyed as routine practice.
“All time” is deceptive, misleading erasing history
How many Australians now think today was the Hottest Ever Day in Sydney, making the 1939 heatwave a bit more invisible?
The Penrith Lakes station only started recording in 1995, so this “all-time” record was not necessarily a record for anyone in Penrith over the age of 22. The Sydney Morning Herald claimed it went back to 1859, because that’s when records started at Sydney Observatory.
But there was no official BOM station in Penrith in 1939 or 1896, two notoriously hot years, when it might have been hotter. In 1896 in Kiama, south of Sydney on the coast it was 117F (47.2C). In Camden, 45km south of Penrith they recorded 125F. That’s 50.5C! Naturally, these are not recognised by the BOM — like the scores of other records across Australia that recorded 120 plus in the shade. Were they all wrong?
Even a tweet can fit the phrase “since records began in 1995”. Heck, the BOM could probably find the money for a double tweet if it had to. Shouldn’t all records be reported accurately? Normally the media and twitt-o-sphere adds the baseless hype, not the scientific institutions.
Penrith has sweltered to the highest temperature ever recorded in the Greater Sydney region, on a day of baking heat that saw international tennis cancelled and residents flock to the beach in droves.
The Penrith observation station reached 47.1 degrees just before 2pm, with the Bureau of Meteorology confirming it was the highest reading ever recorded at the station.
That makes it the highest temperature ever recorded in the Greater Sydney region, in records stretching back to 1859.
The SMH and ABC both changed the headline and text after the BOM realized they made a mistake.
The original ABC Headline appears to have been and may have stood for three hours (hard to tell):
In a mass syndicated snafu, the news that “Sydney sizzles through its hottest day on record” was shared by the MSN.com site, the SMH Facebook page, The Daily Advertiser, The Herald, The West Australian, The LaTrobe Valley Express, The Port Lincoln Times, the Northern Daily Leader, The Penrith City Gazette, The Bendigo Advertiser, and so on and on to scores more outlets… Many of these publications have back edited or altered the stories post hoc sometimes leaving the headline in contradiction to the first line of the story. None of these news outlets did a google search, or a trove hunt for past hottest headlines. The mass of different mastheads gives the appearance of a free press, but all of them speak as one voice when it comes to the BOM.
h/t to Dave B, Andrew, Pat, Scott and Brett.
The B.O.M. with their temperature ‘fact’,
Care not if it isn’t exact,
So long as it spreads,
Through the media heads,
They can later attempt to retract.
Hidden among the hottest headlines was a quiet mention:
As temperatures soared across the state, thousands of people were left without power, according to electricity provider Ausgrid.
Power outages across the NSW Central Coast affected more than 4000 properties, while almost 3000 properties were left without power throughout Sydney.
An Ausgrid spokeswoman said while additional load on the network from the high temperatures had contributed to some of the outages, there were several other factors at play.
We use cookies to ensure that we give you the best experience on our website. If you continue to use this site we will assume that you are happy with it.Ok


 Even if you don’t use Twitter or Facebook, you need to know this. If you disagree with big-government intrusion and rampant corruption, these dirty tricks are working against you, though you may never have sent one tweet or opened a facebook account. They’re stopping the thousands who agree with you from meeting, organising, helping each other, and generally clawing back power from the deep state. We’ve known about
 South West WA and Perth have been the Australian posterchild for Water-Panic for years.


Recent Comments